Monitor Service
Objective
This document provides instructions on how to monitor your application services using the F5® Distributed Cloud Mesh in the F5 Distributed Cloud Console. Mesh provides observability for the application by presenting detailed information on the service interaction for your application. To know more about the Mesh concepts, see Mesh.
Using the instructions provided in this document, you can monitor various details such as metrics, API endpoints, and anomalies.
Prerequisites
-
An F5 Distributed Cloud Account. If you do not have an account, see Getting Started with Console.
-
One or more applications deployed on F5 Distributed Cloud site and services configured. See Deploy for more information. See Create a Site for site creation instructions.
-
In case of a standalone pod such as a traffic generator, set the
ves.io/app_typeannotation for both the pod and the service for the service mesh to display accurate service graph. For more information on annotations, see Resource Management for vK8s.
Activities of Monitoring
Monitoring site deployment from the Console includes the following activities:
| Activity | Description |
|---|---|
| Inspect Service Graph | View the site dashboard to check metrics, alerts, reachability, and overall health. |
| Inspect API Endpoints | Check the nodes of your site and their detailed status. |
| Inspect Service Mesh Dashboard | View the site dashboard to check metrics, alerts, reachability, and overall health. |
| Inspect Service Metrics | View the system metrics such as throughput, drop rate, etc. |
| Inspect Virtual Services | View the site status to check the connectivity, software, OS, and scaling status. |
| Inspect Service Alerts | Check the nodes of your site and their detailed status. |
| Inspect Service Requests | Check the nodes of your site and their detailed status. |
| Inspect Service Connections | View the status of your connections and get more details. |
Navigate to Service Mesh
Log into the Console, select the Multi-Cloud App Connect service, and change to your namespace (click the Application icon in the options pane, and then select your namespace from the drop-down menu). Select Mesh from the configuration menu and Service Mesh from the options pane. A list of your applications gets displayed with the overall application health, total number of services, and individual service health for each listed application.
Click on your application from the displayed list to load the service graph for it.
Inspect Service Graph
The service graph presents an overall graph representation for your application's service interactions. The graph shows service interactions representing services as nodes and interactions as edges. The service request flow is indicated between the edges with arrows
Hover on any node or edge to display a snapshot of the overall application health and metrics.
This example shows the snapshot for an edge.
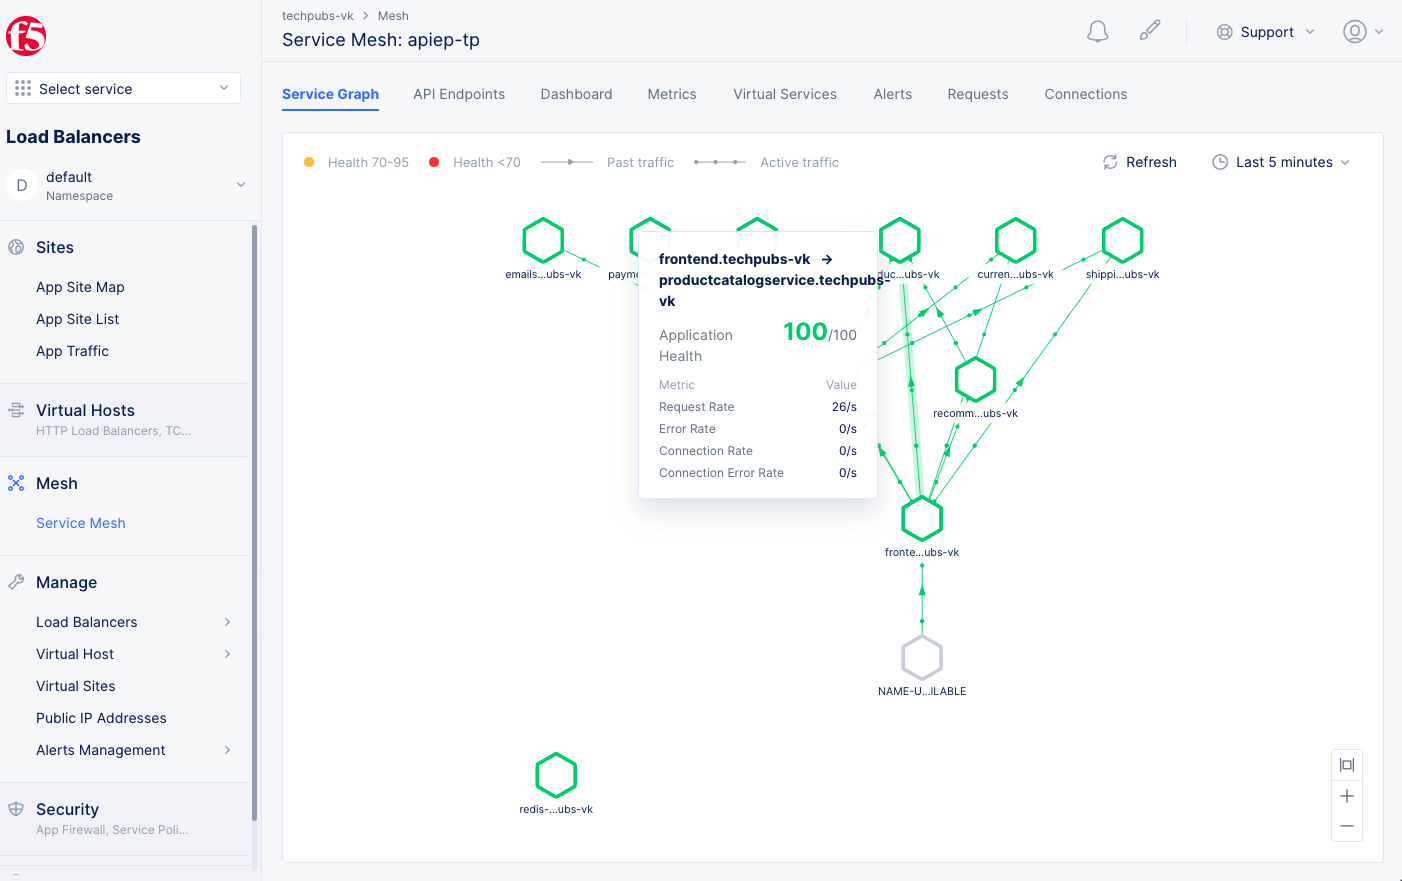
Figure: Service Graph for your Application Services
Click on any node or edge to display a quick information card for that service or interaction.
Click on the Details and Health tabs to obtain quick information on the current status and health respectively. From within those views, you can click Alerts for nodes or Endpoints for edges to load the alerts or endpoint views respectively. This example shows the quick view for a node.
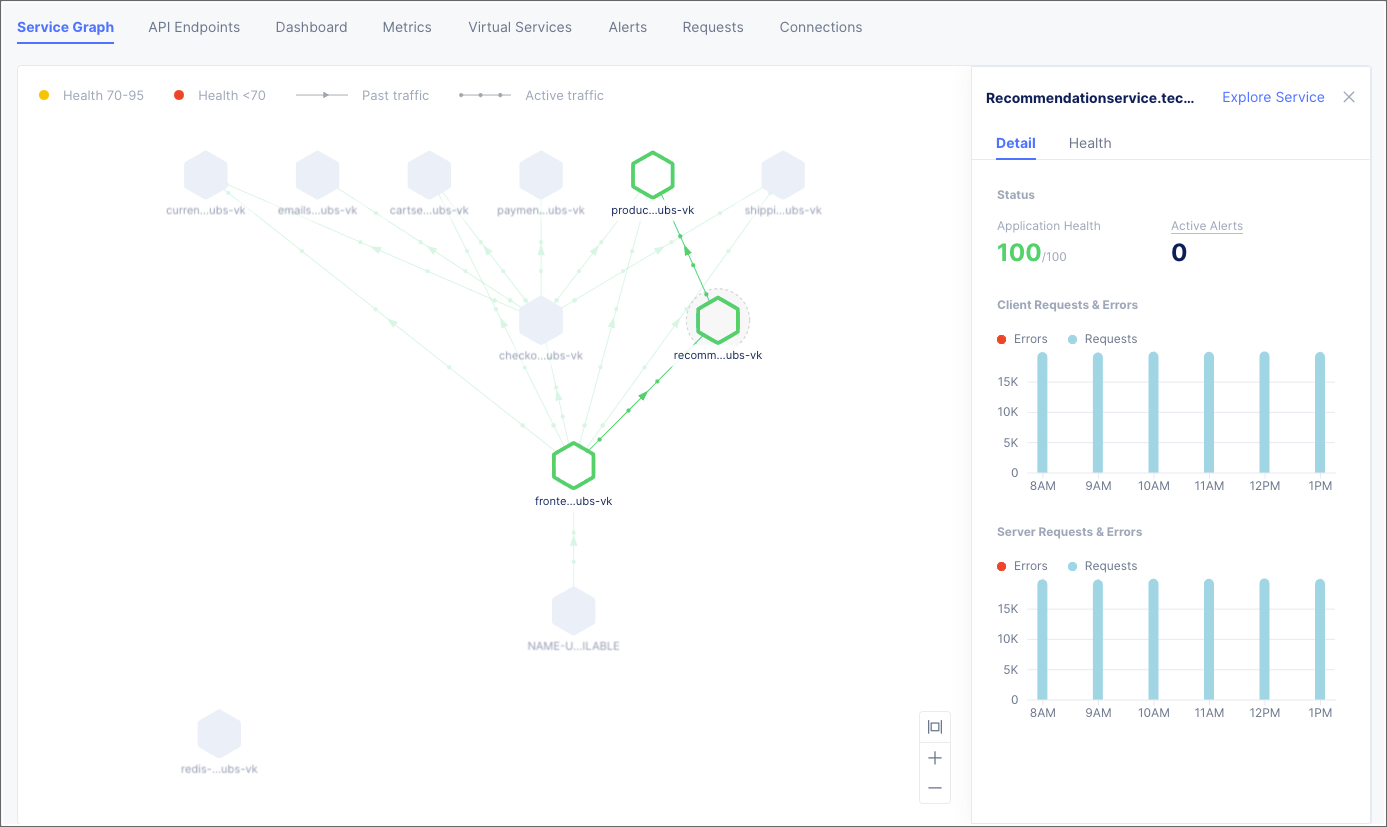
Figure: Service Graph Explore View for Service
Display service mesh only for one node of your application.
Click the Explore Service option on the quick view to display a filtered view of service mesh only for that service.
You can also click the node or edge to display quick view card for that service or interaction.
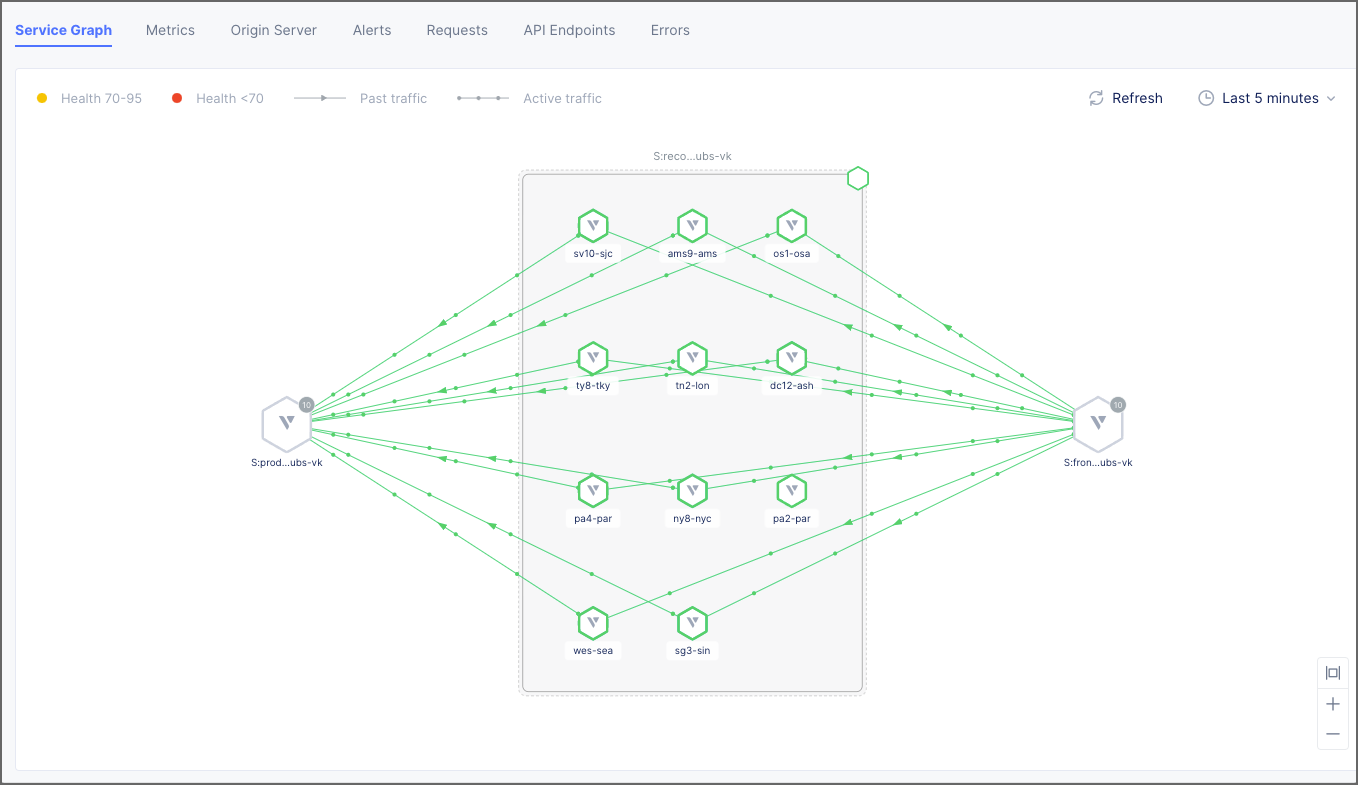
Figure: Service Graph Explore View for Service
Set time interval, refresh, or filters for your service graph view.
- Click Last 5 minutes dropdown on the upper right end of the view and select a time interval to inspect your site dashboard for that interval. The default for this is 5 minutes. You can also refresh the status periodically by setting a refresh value using the Refresh every field.
- Click Refresh next to the Last 5 minutes option to manually refresh the status.
Inspect API Endpoints
The service endpoints view provides the API endpoints for the services of your application in a graph view with the root and leaves representing the different API paths. You can also obtain the Probability Density Function (PDF) for the Request, Error, Latency, and Throughput (RELT) metrics for the API endpoints.
Load the endpoints monitor view.
- From the configuration menu, select Mesh > Service Mesh, and then click on your application from the displayed list to load the service graph for it.
- Click the API Endpoints tab to load the endpoints view.
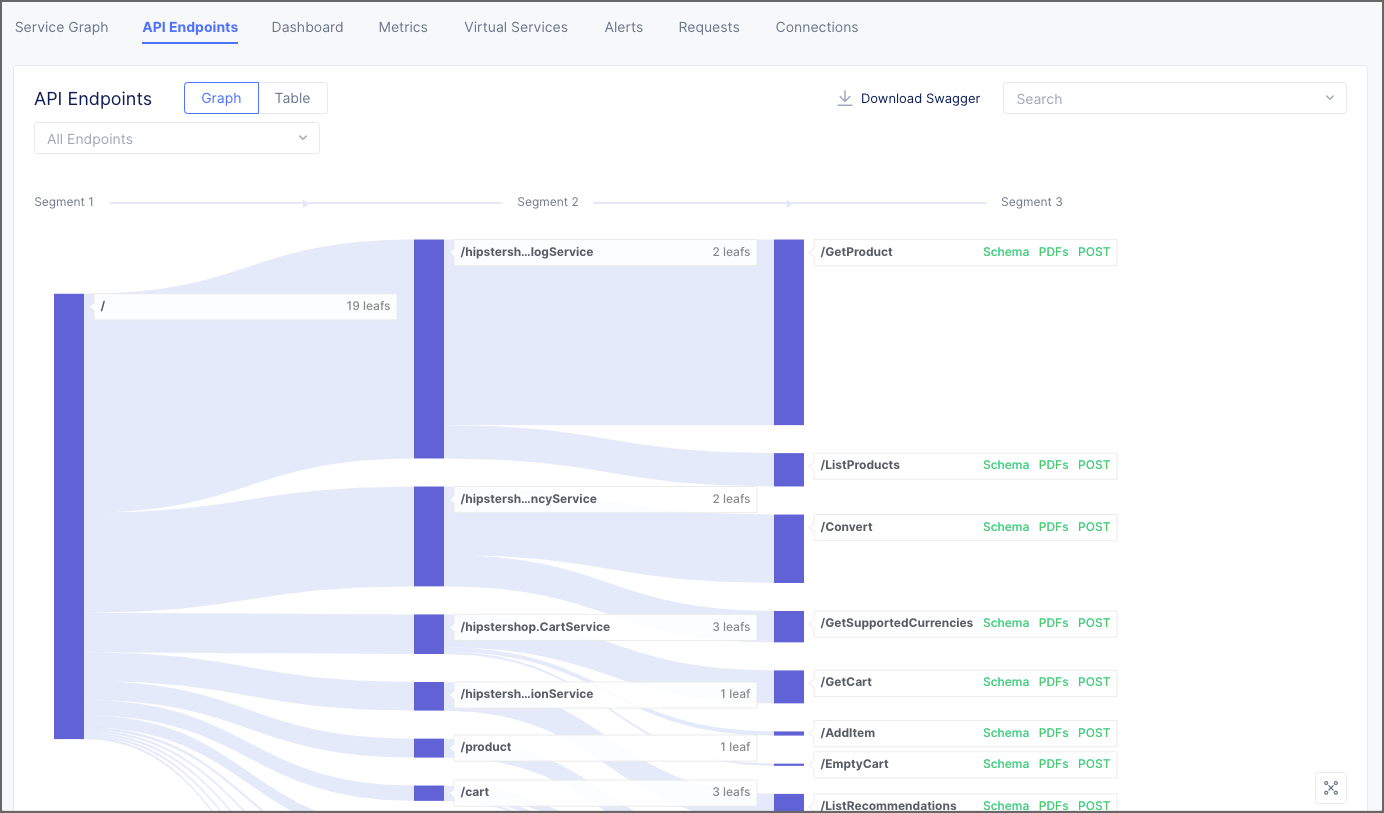
Figure: Service API Endpoints
Switch to PDF view for the endpoint metrics.
Click the Table option to load the PDF for the RELT metrics for all the endpoints. The following metrics are displayed:
- Request size and response size
- Request rate and error rate
- Latency with and without data
- Response throughput
Hover over any metric to display its PDF value in terms of percentage, percentile, and mean values.
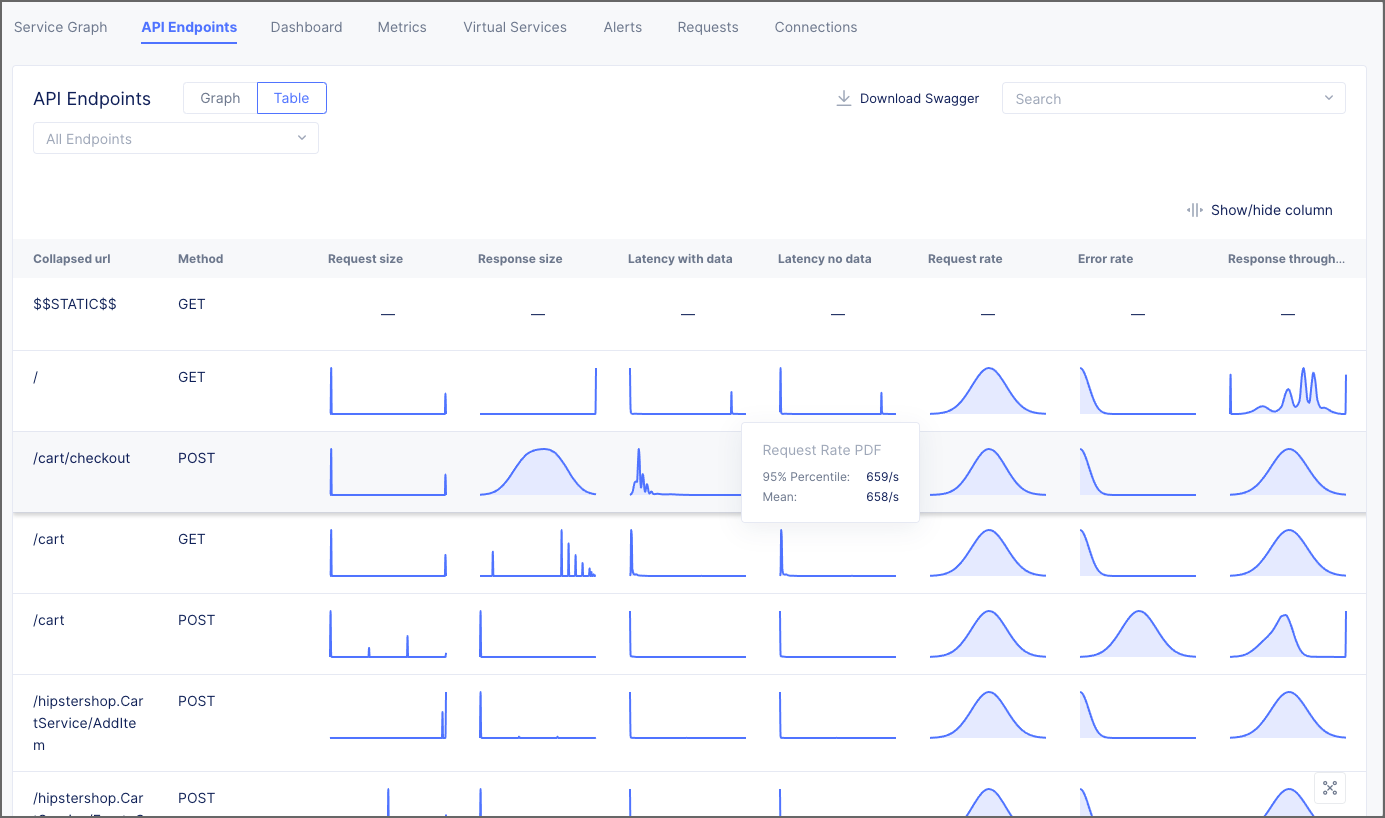
Figure: Service API Endpoints PDF View
Note: You can also use the search option to display PDF for a specific service or set of services.
Display probability density for a specific metric of a specific endpoint.
Click on the PDF of any metric in the Table view to load its probability density trend in a graph.
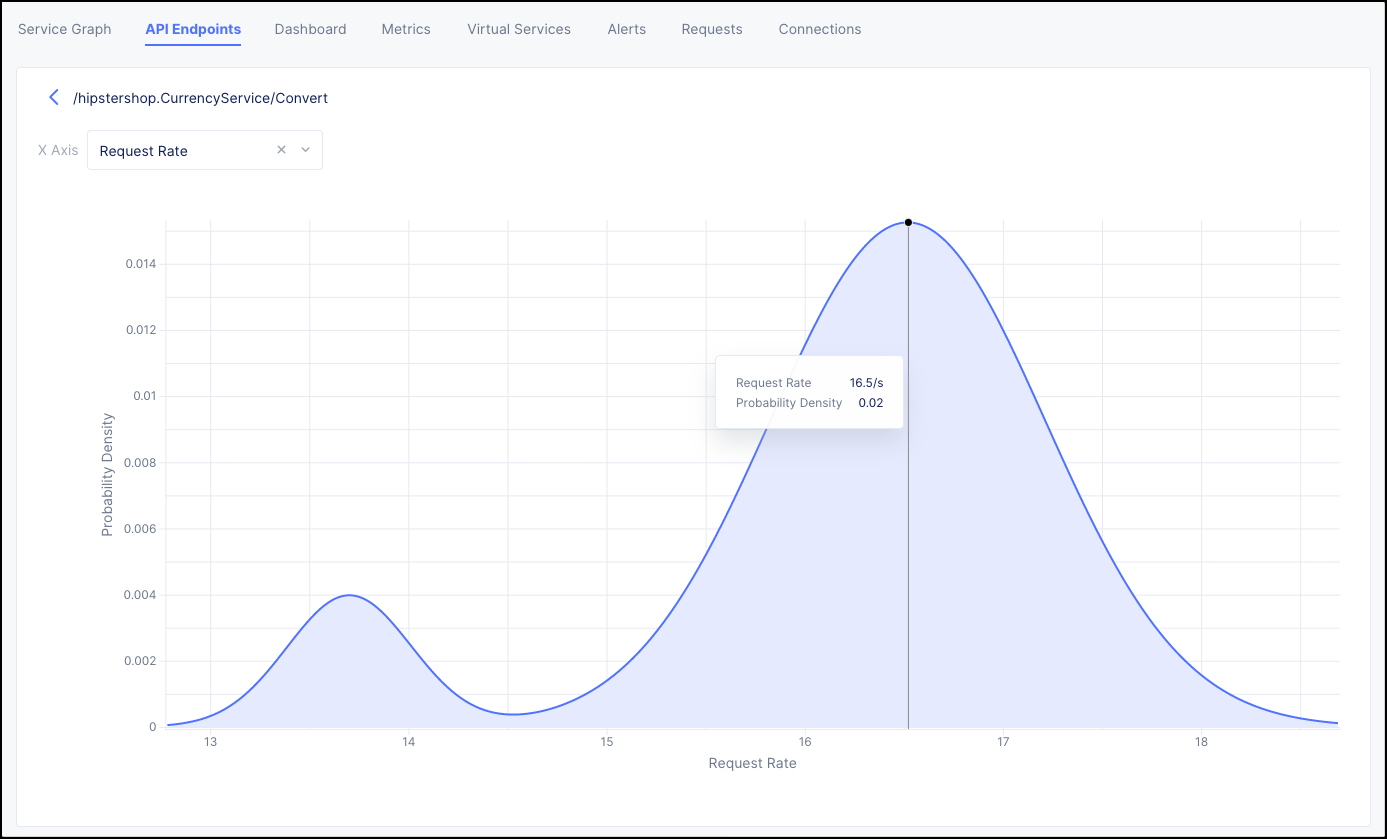
Figure: Service API Endpoints PDF View
Note: You can also switch to other metrics using the X Axis drop-down to display its graph.
Inspect Service Mesh Dashboard
The application's dashboard presents an overall monitoring view for your application so that you can inspect overall services, unhealthy services, HTTP errors, latency distribution, and trends for service metrics. Monitor your site dashboard as per the following guidelines:
Open the dashboard view of your service mesh.
Click the Dashboard tab to load the service dashboard.
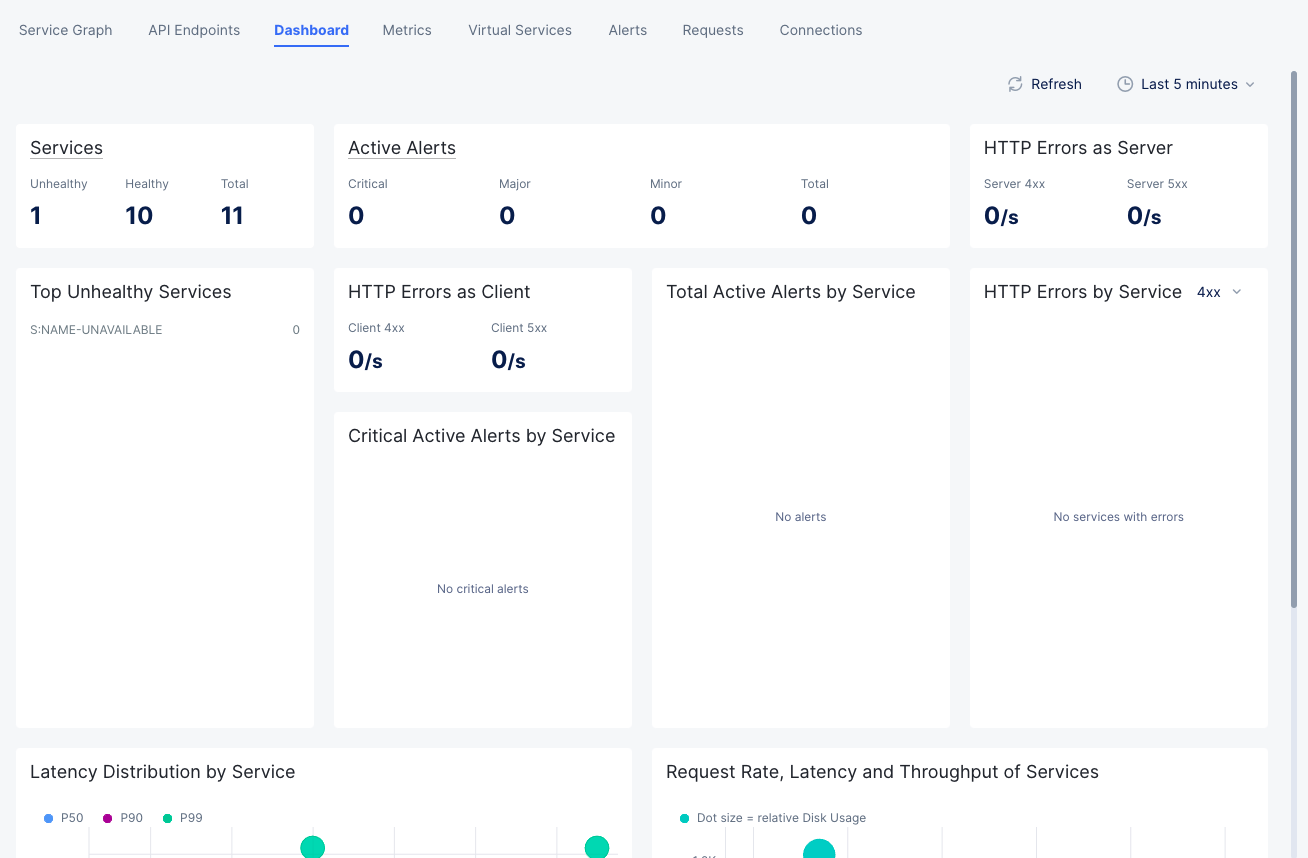
Figure: Service Mesh Dashboard
Monitor overall service snapshot and unhealthy services.
- Check the Services part of the dashboard to get a count for the healthy, unhealthy, and total services. You can also click Services in this view to load the service graph view.
- Check Top Unhealthy Services to obtain details on the unhealthy services.
Monitor active alerts from the dashboard view.
- Check the Active Alerts part of the dashboard to get a count for the critical, major, minor, and total active alerts. You can also click Active Alerts in this view to load the alerts view.
- Check Top Active Alerts by Service to obtain the active alerts per service.
- Check Critical Active Alerts by Service to obtain the critical active alerts per service.
Monitor the HTTP errors from dashboard.
- Check the HTTP Errors by Service part of the dashboard to see the HTTP errors per service for both client and server. You can also display errors for specific HTTP codes using the filter option. The default selected filter is 4xx.
- Check HTTP Errors as Server to obtain the server errors for HTTP codes 4xx and 5xx.
- Check HTTP Errors as Client to obtain the client errors for HTTP codes 4xx and 5xx.
Monitor latency, request rate, and throughput for services from dashboard.
- Check the Latency Distribution by Service part of the dashboard to check the latency per service.
- Check the Request Rate, Latency and Throughput of Services part of the dashboard to check the graph of latency versus request rate. The dot size represents the relative throughput and hover over the dots to see the latency, request rate, and throughput values for the service represented by the dot.
Set time interval or a refresh for your dashboard.
Click the Last 10 minutes dropdown on the upper right end of the dashboard and select a time interval to inspect your service dashboard for that interval. The default for this is 10 minutes. You can also refresh the status periodically by setting a refresh value using the Refresh every field. Alternatively, click Refresh next to the Last 10 minutes option to manually refresh the status.
Inspect Service Metrics
Click the Metrics tab to load the service metrics monitoring view.
The service metrics presents detailed service metrics of request rate, error rate, latency, and throughput. The metrics are displayed in graphs representing the trend over a period of time (default 1 hour). You can select to display client or server trends using the toggle option. You can also select specific nodes or edges to display the metrics for that service or interaction.
Monitor request rate and error rate.
- Click on Request Rate, Error Rate, Error Rate 4XX, Error Rate 5XX, Error Rate Client, and Error Rate Upstream fields on the right side under the Rate section to display the rate trend. Each field has 2 graph bar fields to its left. Select an area of one field and the other area of the second field to display combined graph for in and out drop rate.
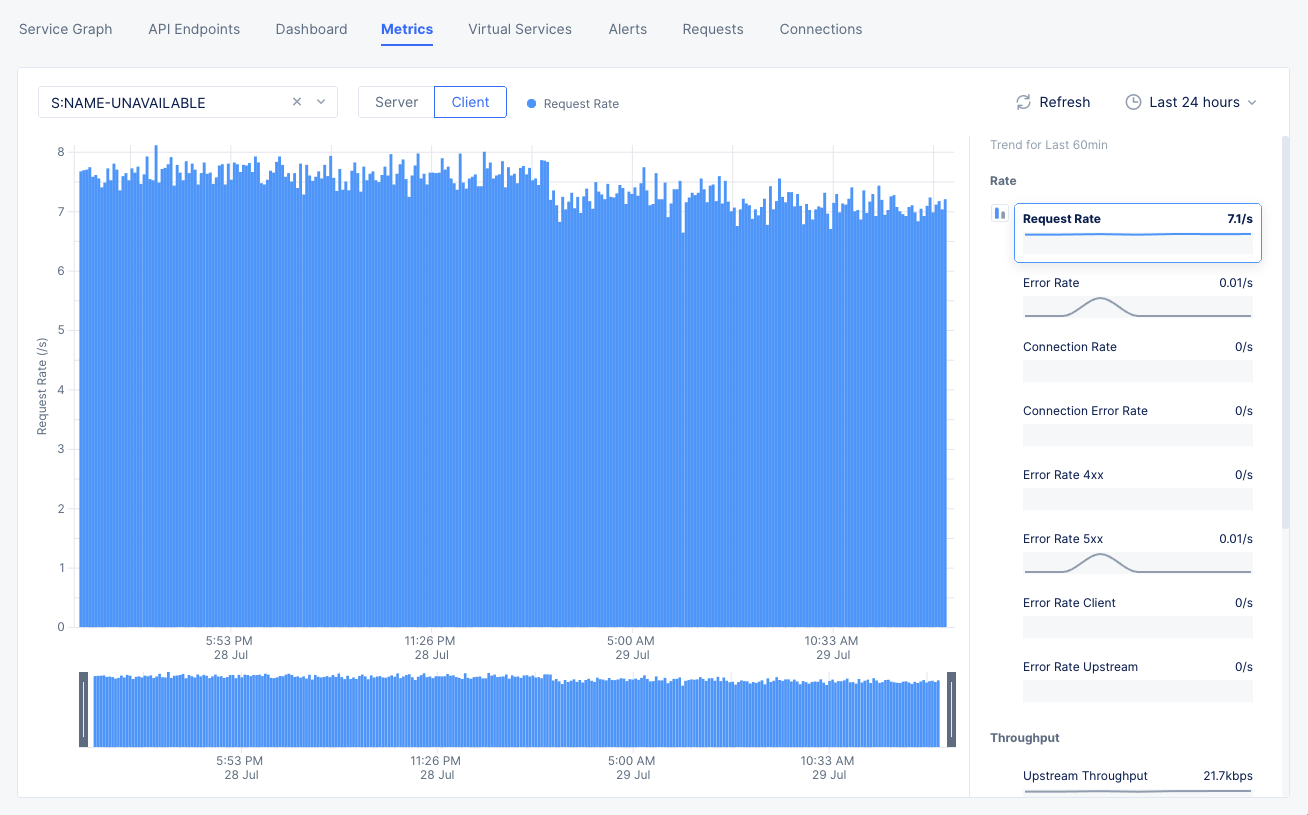
Figure: Rate Metrics
Note: The Request Rate trend for the server is displayed by default.
Monitor latency trend.
- Click on Client RTT, Server RTT, Latency, App Latency, and Connection duration fields on the right side under the Latency section to display the latency trend. Each field has 2 graph bar fields to its left. Select an area of one field and the other area of the second field to display combined graph for those metrics.
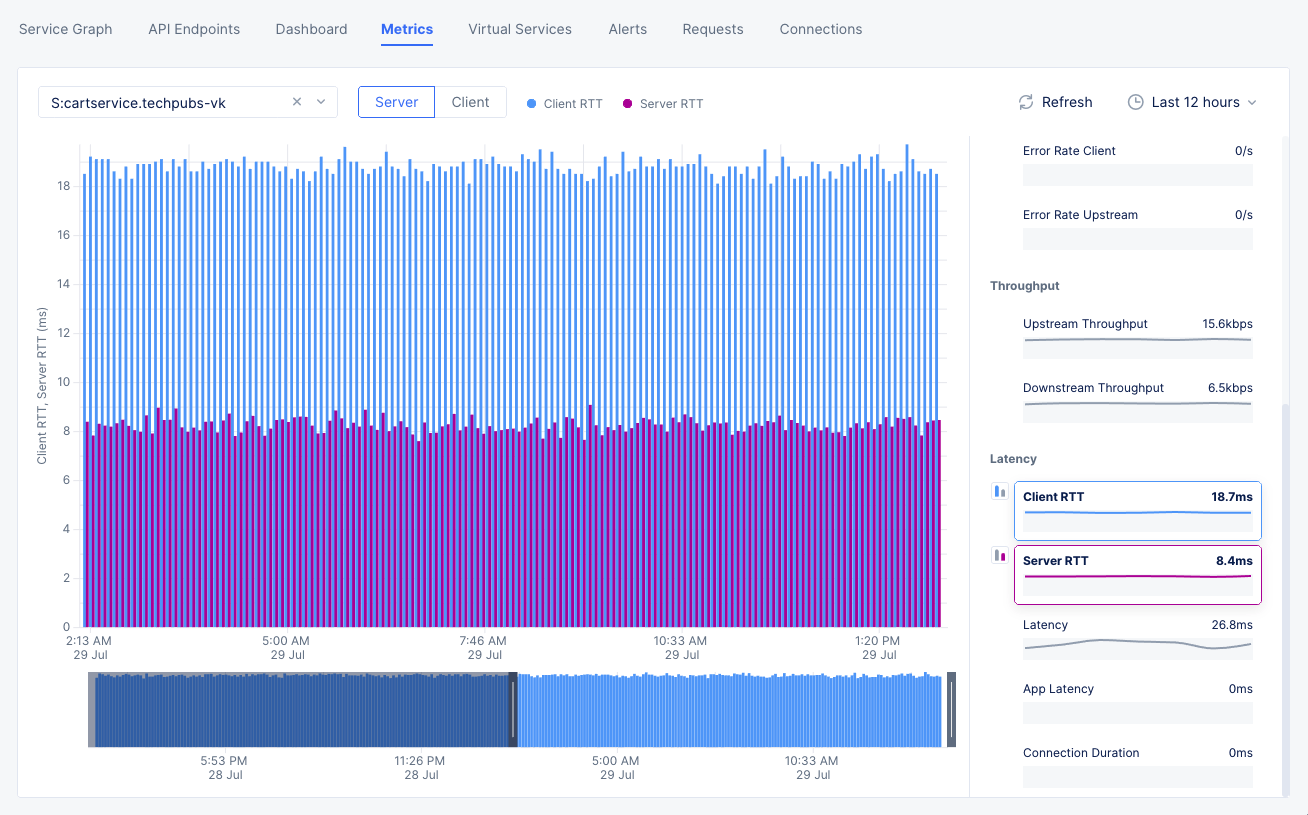
Figure: Latency Metrics
Monitor throughput trends.
- Click on Upstream Throughput or Downstream Throughput fields on the right side under the Throughput section to display the throughput trend. Each field has 2 graph bar fields to its left. Select an area of one field and the other area of the second field to display combined graph for them.
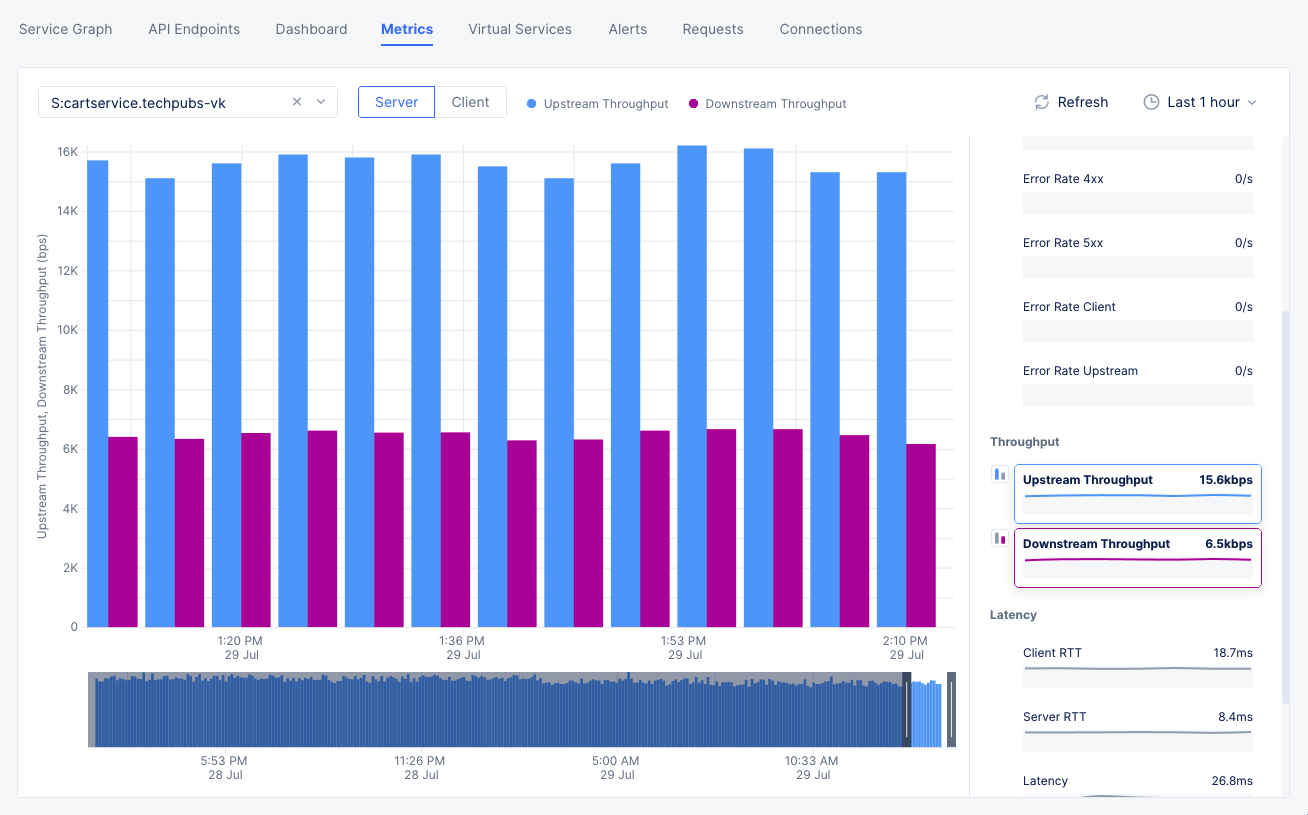
Figure: Combination of Upstream and Downstream Throughputs
Obtain metrics trend for a specific time interval.
Click Last 1 hour dropdown on the upper right end of the dashboard and select a time interval to inspect your site dashboard for that interval. The default for this is 1 hour and maximum allowed interval is 24 hours. You can customize the interval by selecting the Custom option and choosing date range. This can also be set graphically by adjusting the controls beneath the main graph.
Inspect Virtual Services
Monitor the virtual services for your application.
Click the Virtual Services tab to load the virtual services view.
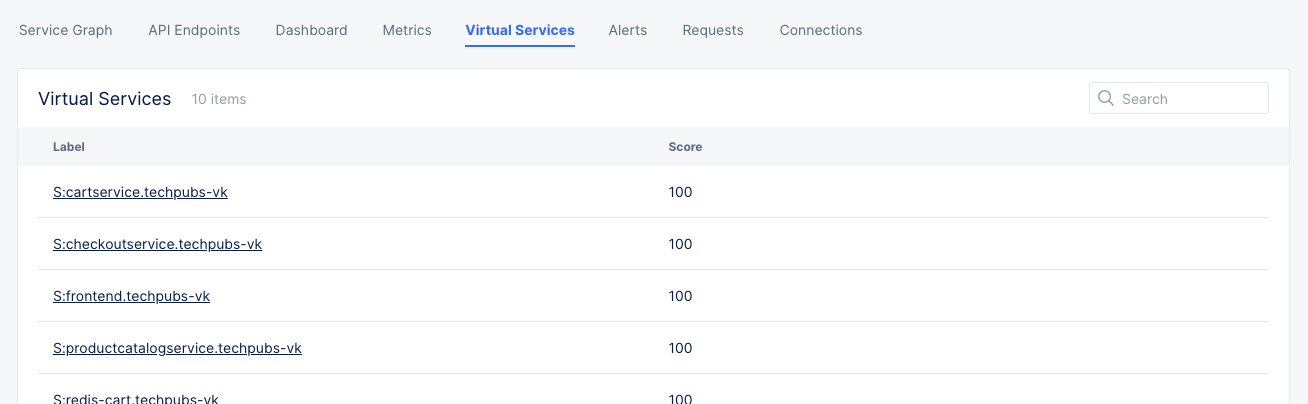
Figure: Virtual Services List
Inspect Service Alerts
The service alerts view provides monitoring of the alerts specific to the application services.
Monitor service alerts.
Click the Alerts tab to load the alerts view.
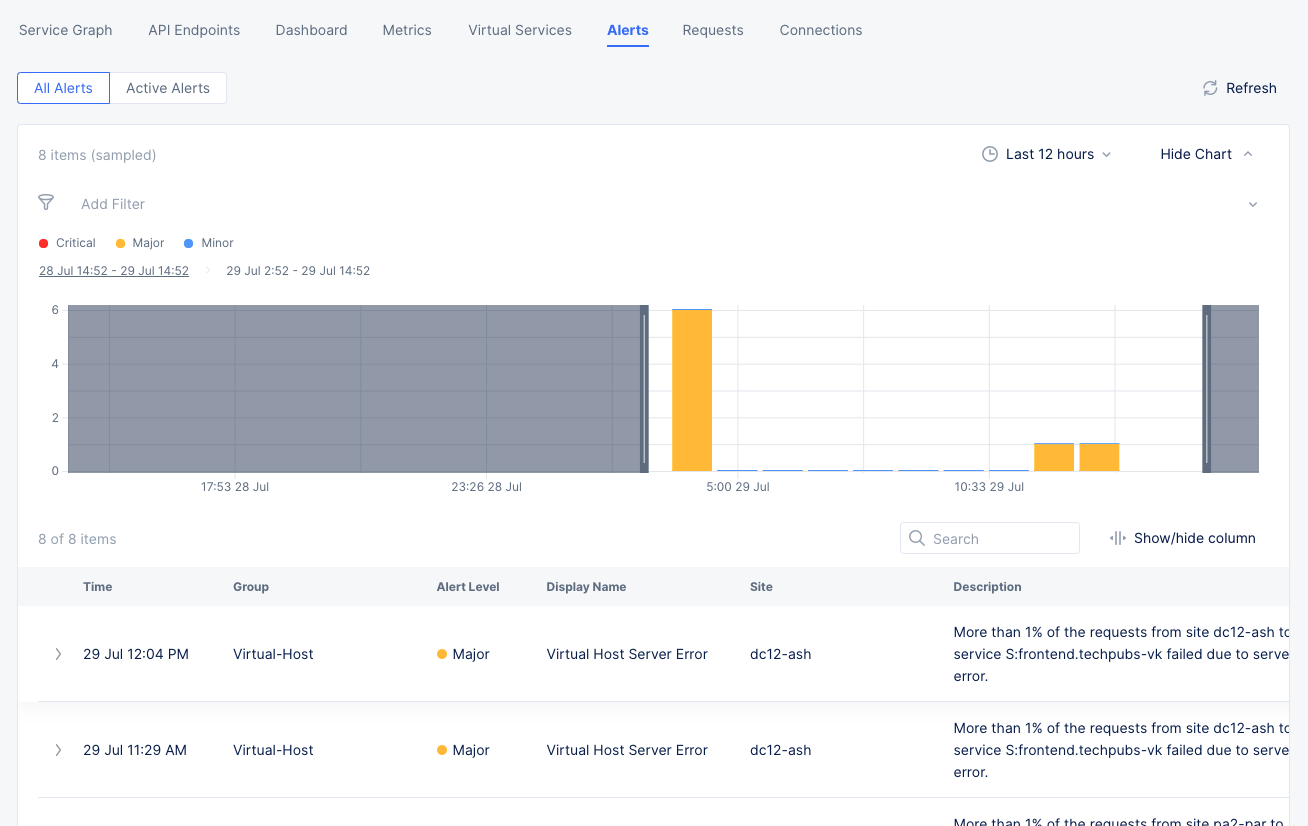
Figure: Service Alerts
The active alerts are displayed by default. Use the toggle selection to load all alerts. You can also set a time interval in the active alerts view to display alerts over a specific period of time. Click > for any alert entry to display details in JSON format.
Inspect Service Requests
The service requests view provides monitoring of the requests specific to the application services. This view presents the request trend for your services using sampled HTTP requests over a default or selected time frame.
Monitor the requests trend for your services.
Click the Requests tab to load the view for the trend of sampled HTTP requests
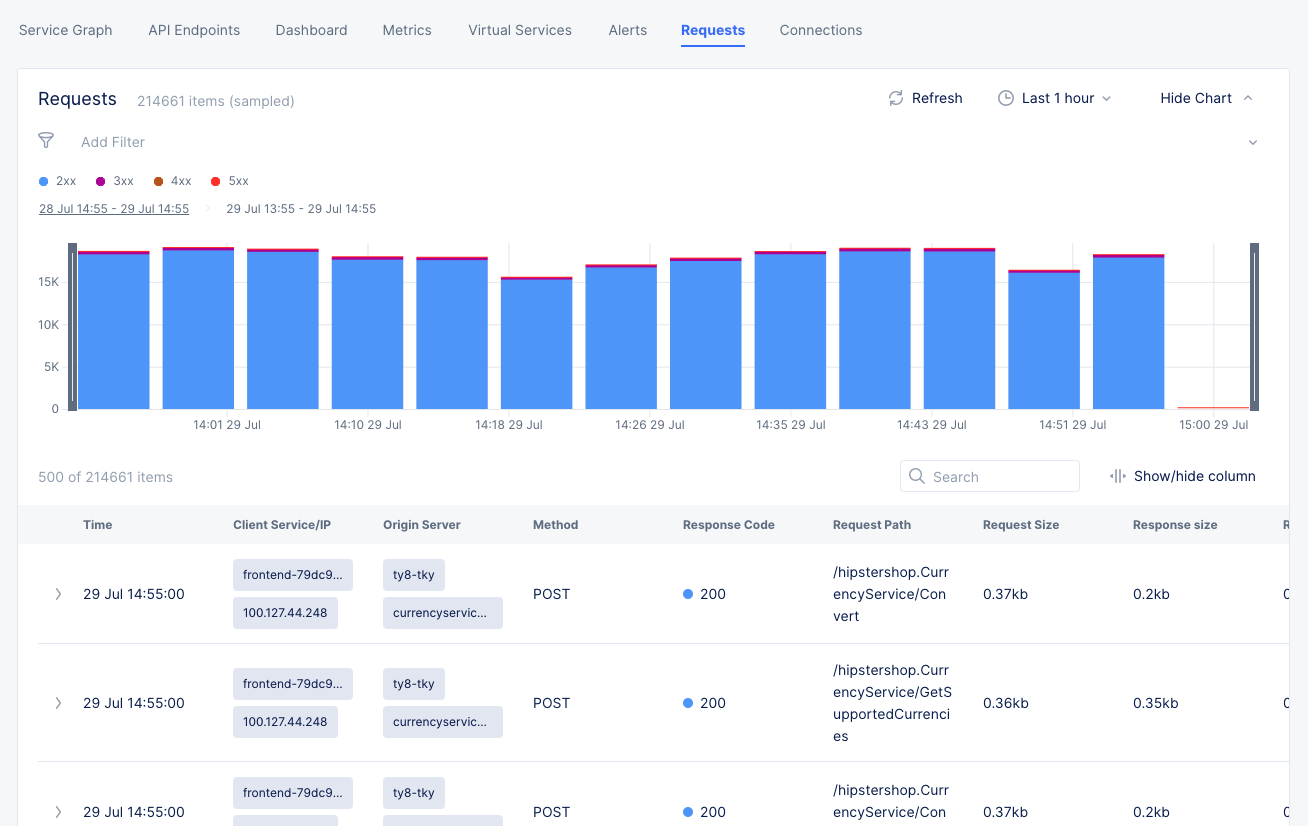
Figure: Service Requests
The requests are displayed in a graphical trend as well as in a list for the default or specific time interval. Click > for any listed request to display detailed information in JSON format.
You can apply filters to display the trend for specific HTTP codes. For example, de-select all and select only 2xx to display the requests for HTTP code 2XX.
You can also click Hide Chart to see only the list of requests.
Inspect Connections
The connections view provides monitoring of the connections specific to the application services. This view shows all the connections for a selected time frame and indicates those that are Ok Connections, Upstream Errors, and Client Errors.
Monitor the connections for your services.
Click the Connections tab to load the view for the trend of connection requests.
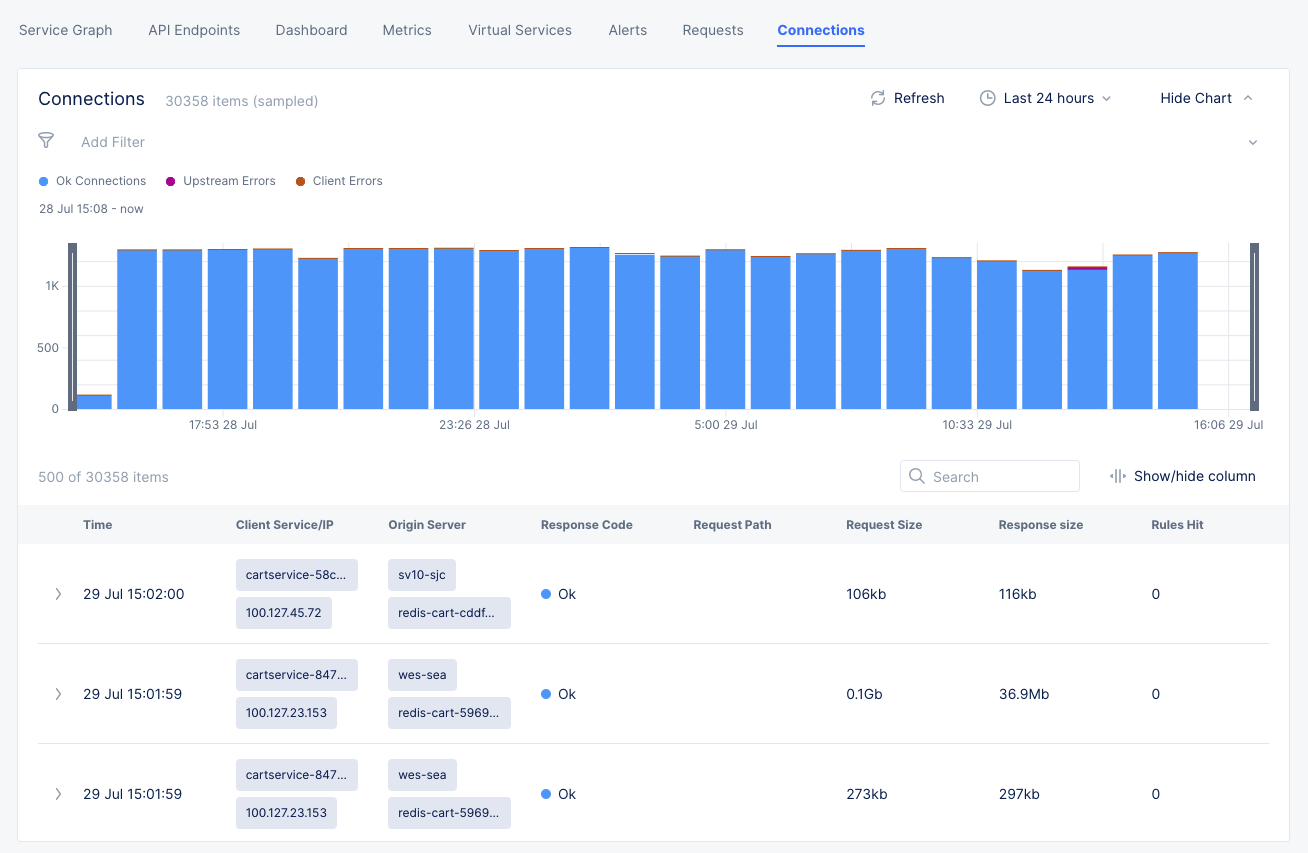
Figure: Connections
The connections are displayed in a graphical trend as well as in a list for the default or specific time interval. Click > for any listed connection to display detailed information in JSON format.
Click on a column in the graph to zoom into that time frame. Successive clicks on columns that show errors will drill down to specific errors, as shown below:
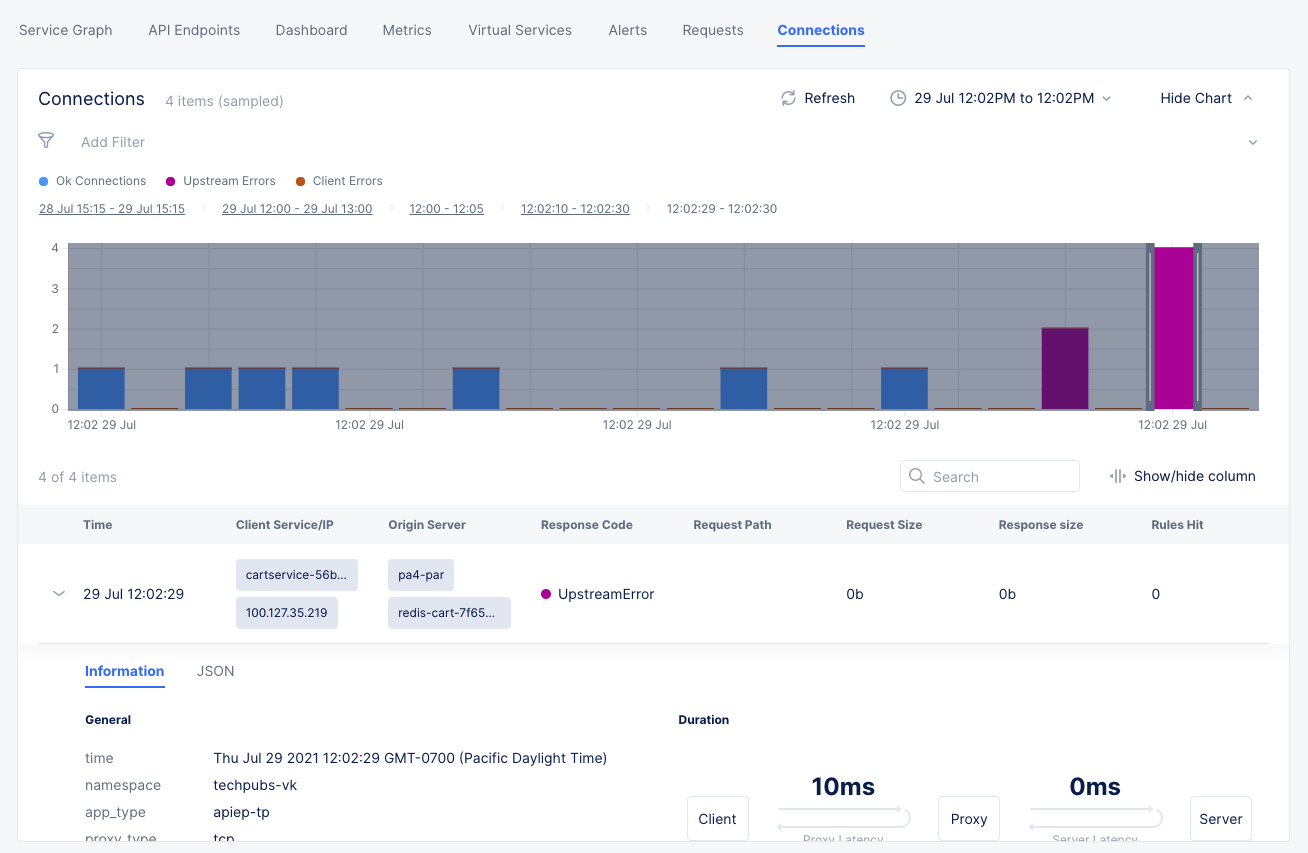
Figure: Connection Error
You can also click Hide Chart to see only the list of requests.