Observe and Optimize a CDN Distribution
Objective
This guide provides instructions on how to monitor your Content Delivery Network (CDN).
Prerequisites
The following prerequisites apply:
-
An F5 Distributed Cloud Account. If you do not have an account, see Getting Started with Console.
-
A valid DNS domain delegated to Distributed Cloud Services in case you want Distributed Cloud Services to act as domain name server (DNS). For instructions on how to create a primary or secondary DNS zone, see Manage DNS Zone.
-
TLS certificates in case of using HTTPS distribution with custom certificates.
-
Origin server with a valid DNS name and reachable by F5 Distributed Cloud Services.
Note: Ensure that the origin server hosts the content that needs to be served using the CDN Distribution.
Monitor a CDN Distribution
You can view your distribution performance dashboards either via the Manage > Distributions page or Monitoring > Performance page. Click on your distribution name from the list of displayed distributions to open the monitoring view.
Dashboard Tab
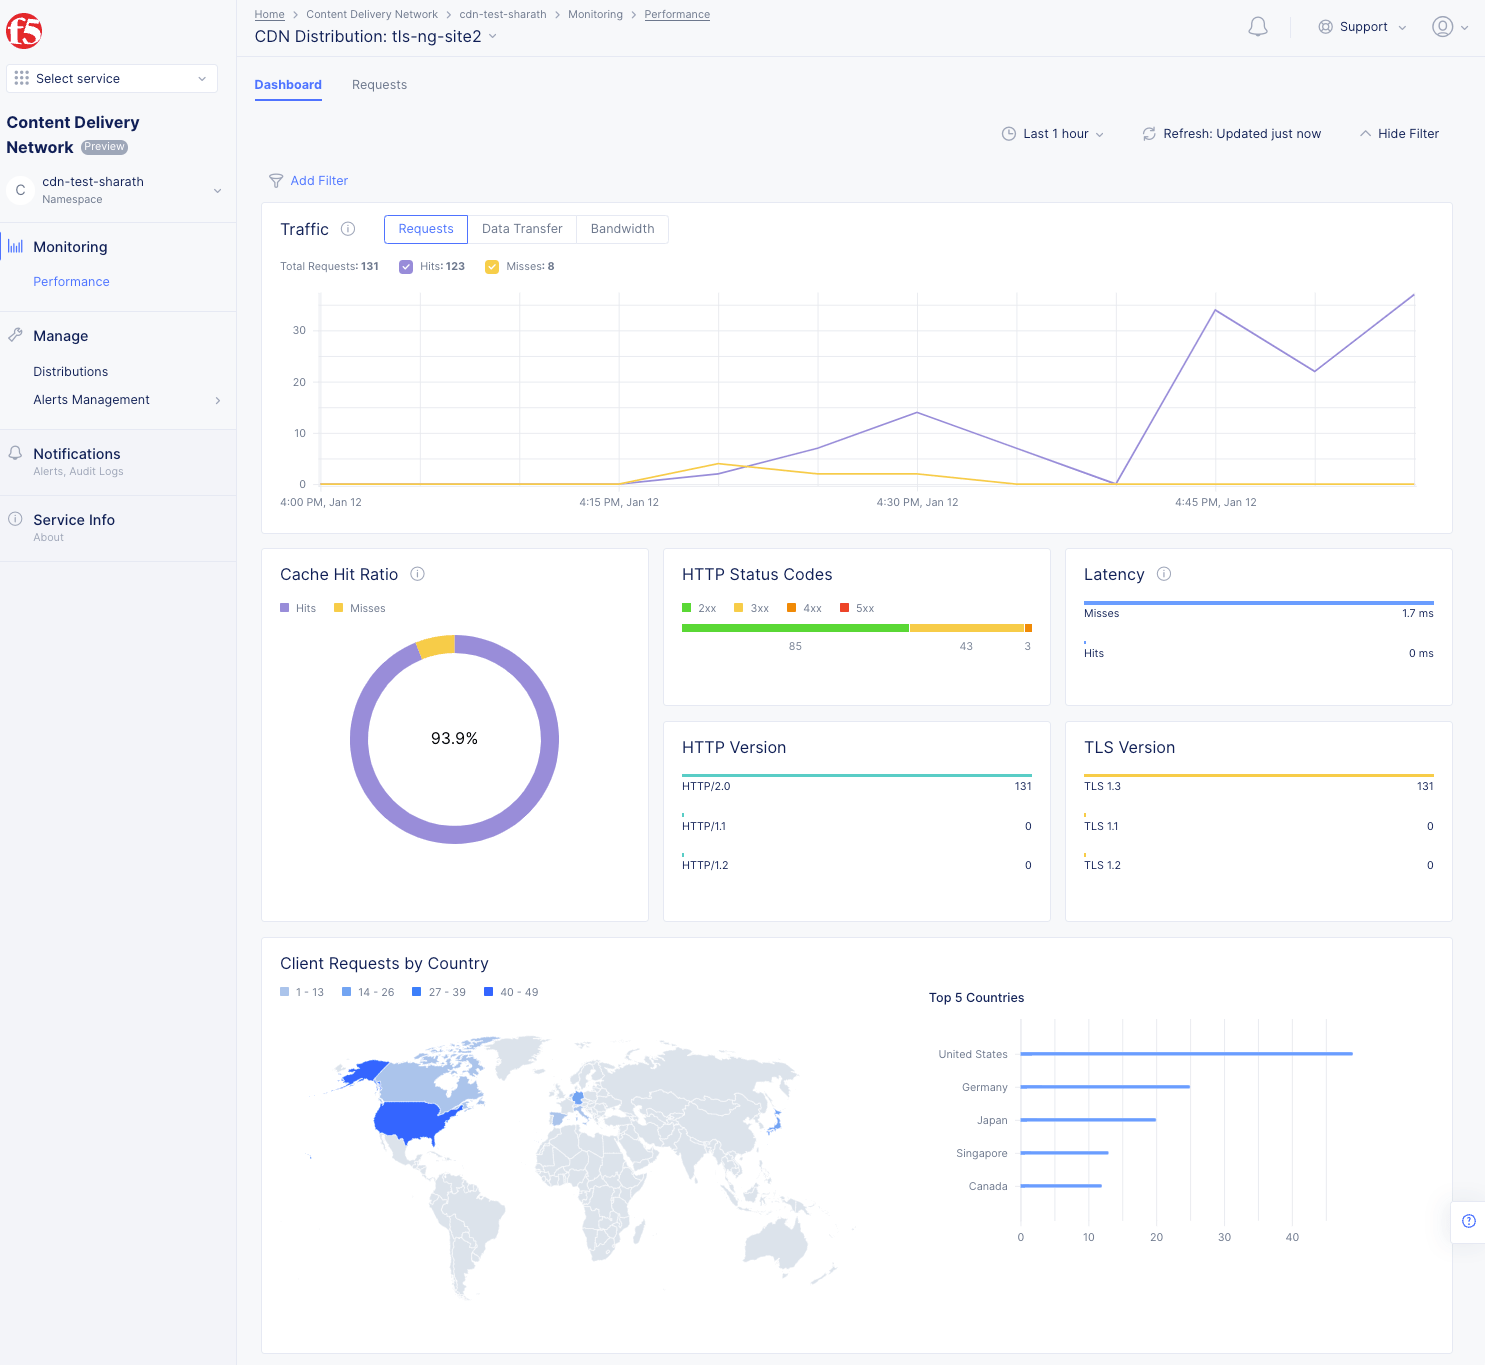
Figure: Distribution Monitoring View
The Dashboard view offers the following:
-
Time series view for statistics such as Requests, Data Transfer, and Bandwidth. This is shown in a graph where hits and misses are displayed. Hover over the graph to see specific quantity information for that time point.
-
Donut chart for cache hit versus miss ratio.
-
HTTP Status codes show the number of response codes in each of the categories. Hover over the horizontal bar to see the values expressed as percentages.
-
Latency shows the time taken between requests and responses for both hits and misses.
-
HTTP version metrics.
-
TLS version metrics.
-
Client requests by country. Hover over a country to see the number of requests originating from that country.
-
Top 5 countries providing requests, shown as a bar chart. Hover over a bar to get the specific value for that country.
Requests Tab
Figure: Distribution Requests Monitoring View
The Requests tab provides greater insight into requests. There is a bar chart as well as a list of the incoming requests. Use the time period drop-down menu and refresh button to set the time constraint and update the data shown.
Interact with the bar chart as follows:
-
The bar chart at the top shows the number of requests and response codes in each time period.
-
Use the
Add Filterto see only certain request based on your filter selection. -
Use the colored check-boxes below
Add Filterto quickly filter out specific response types. -
Hover over a bar to get specific bar values (request counts) for that time period.
-
Click and drag within the bar chart to zoom into a range of time. Use the time period drop-down menu to zoom back out.
The list view below the chart shows specific information for individual requests. The time period and filters also affect the requests shown in the list view.
Interact with the list view as follows:
-
Use the
Searchfield to only show list entries that match your search criteria. The search will work for all items in the list, not just the items on the current page; however, the search will not find information in columns that are not displayed (see the gear icon description below). -
Click the gear icon ( ⚙ ) to select which columns are shown in the list view.
TimeandClient IPwill always be shown. -
Click the arrow ( > ) at the beginning of the row to see the specific request in JSON or YAML format.

Figure: Distribution Monitoring Requests
You can also click the blue Forensics side tab to view the Forensics side panel. This is an easier way to filter your request to zero in on specific issues. For instance, you can filter by site and by top request page simply by selecting check boxes in the Forensics panel. This will create a search query for the filter at the top of the window.
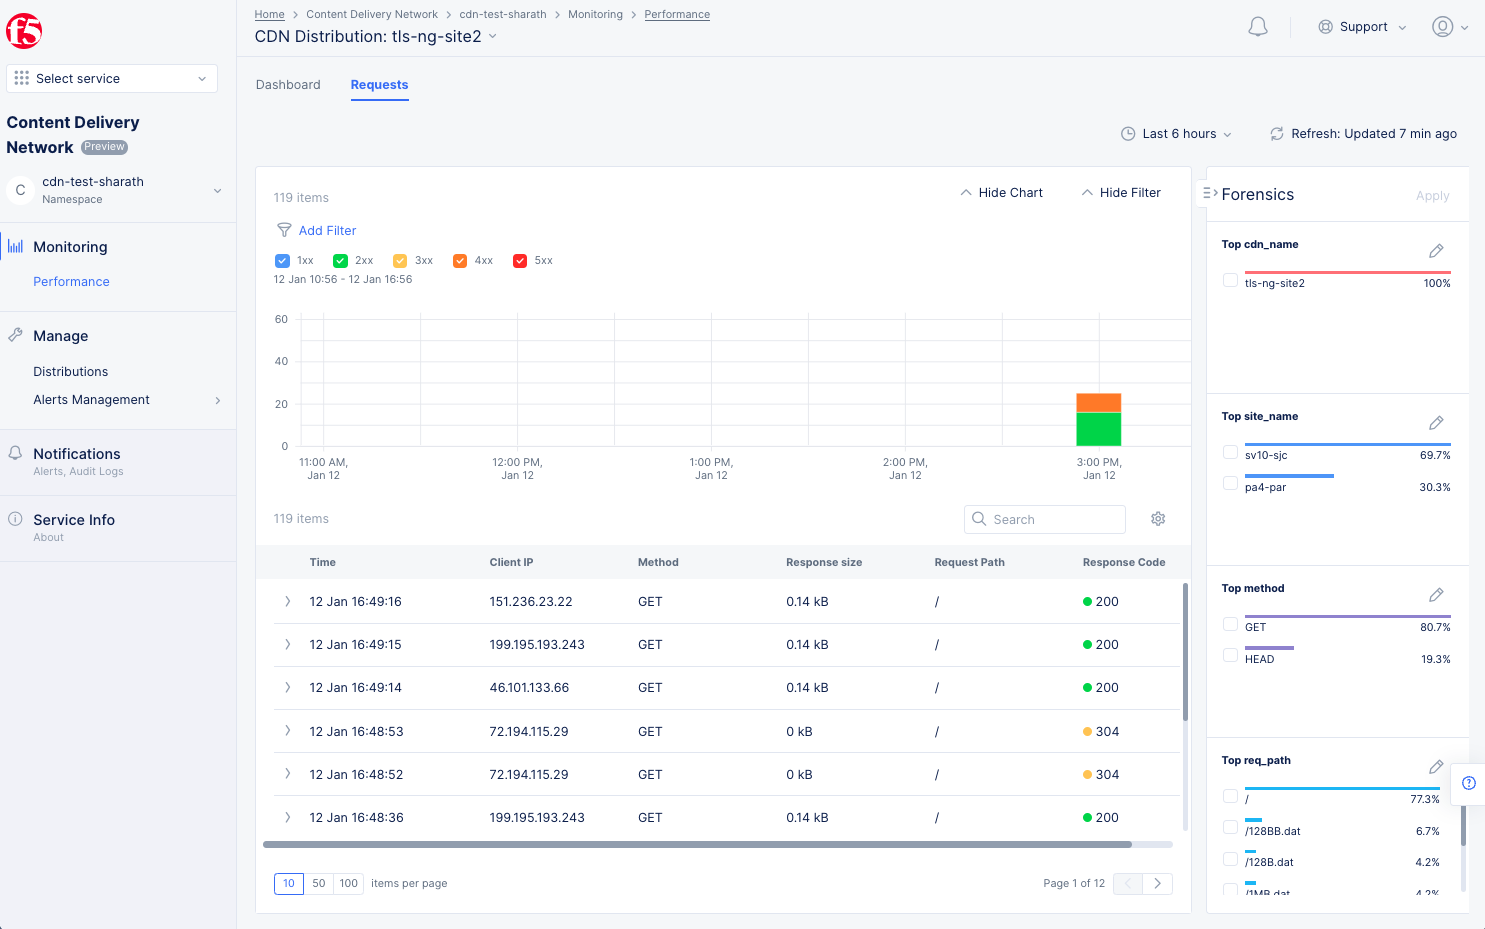
Figure: Distribution Monitoring Requests Using Forensics
Alerts Tab
Click the Alerts tab to load the alerts view. The active alerts are displayed by default.
You can filter the display for alerts of a specific severity using the severity selection options. All severity types are selected by default. Select a severity selection option to hide the alerts for that severity. You can again select it to display alerts for that severity.
Note: Severity selection options are color-coded and located above the
Add filteroption.
Use the toggle selector and click All Alerts. The All Alerts view shows graph for alerts over a specific period. The list of alerts is displayed beneath the graph.
Hover mouse pointer over a graph bar to view the alerts information specific to the time interval in which the bar is generated. Selecting the bar updates the graph and the list beneath the graph for the interval in which the bar is generated.

Figure: CDN Alerts
Click > for any alert entry to display its details in JSON format.
Cache Purges Tab
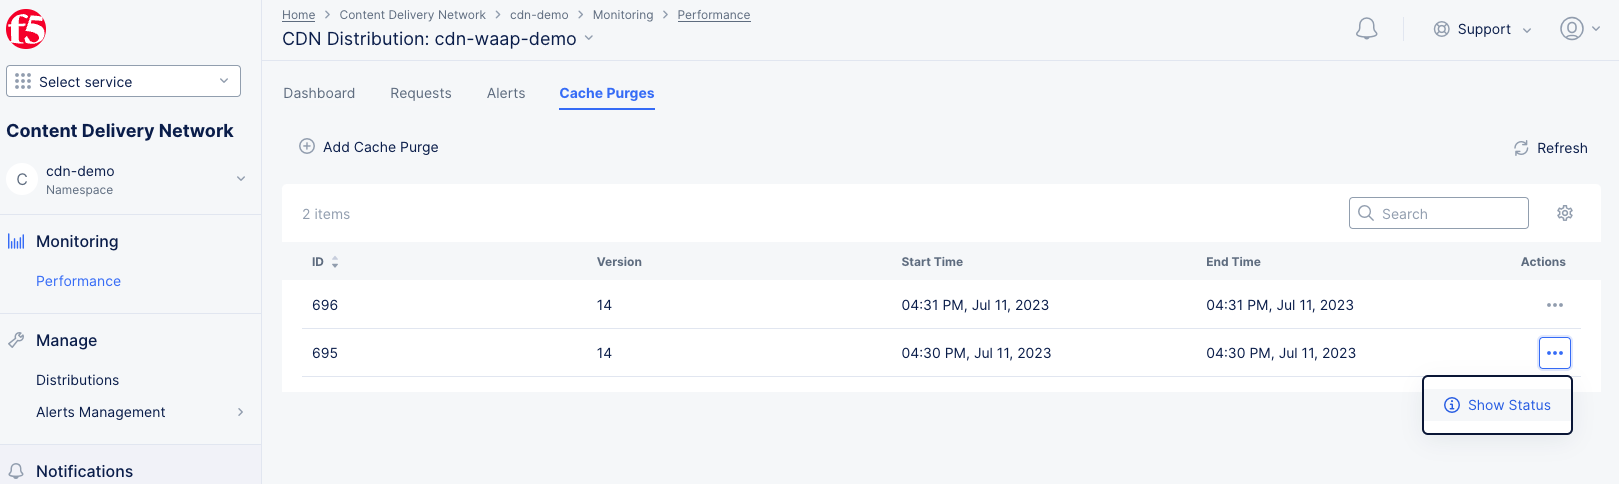
Figure: Distribution Cache Purges
The Cache Purges tab show past purges for your distribution in a table. Each row in the table provides a unique ID for the purge, the version and information on the date/time of the purge. To see details of the purge, click ... > Show Status in the Actions column for the purge you want to view.
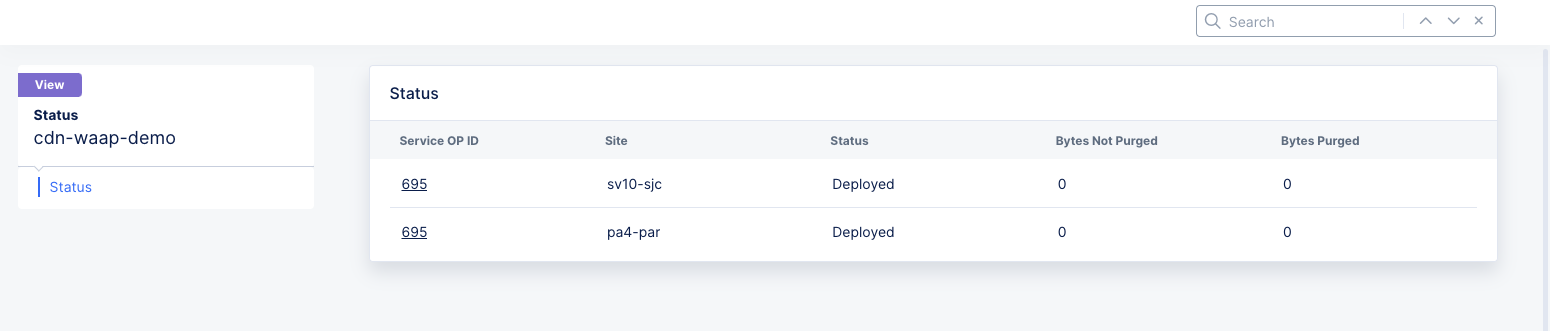
Figure: Distribution Cache Purge Status
This displays a table showing the sites that were purged and some overview information about each site's purge. For details on the site purge, click the ID in the Service OP ID column for the site.
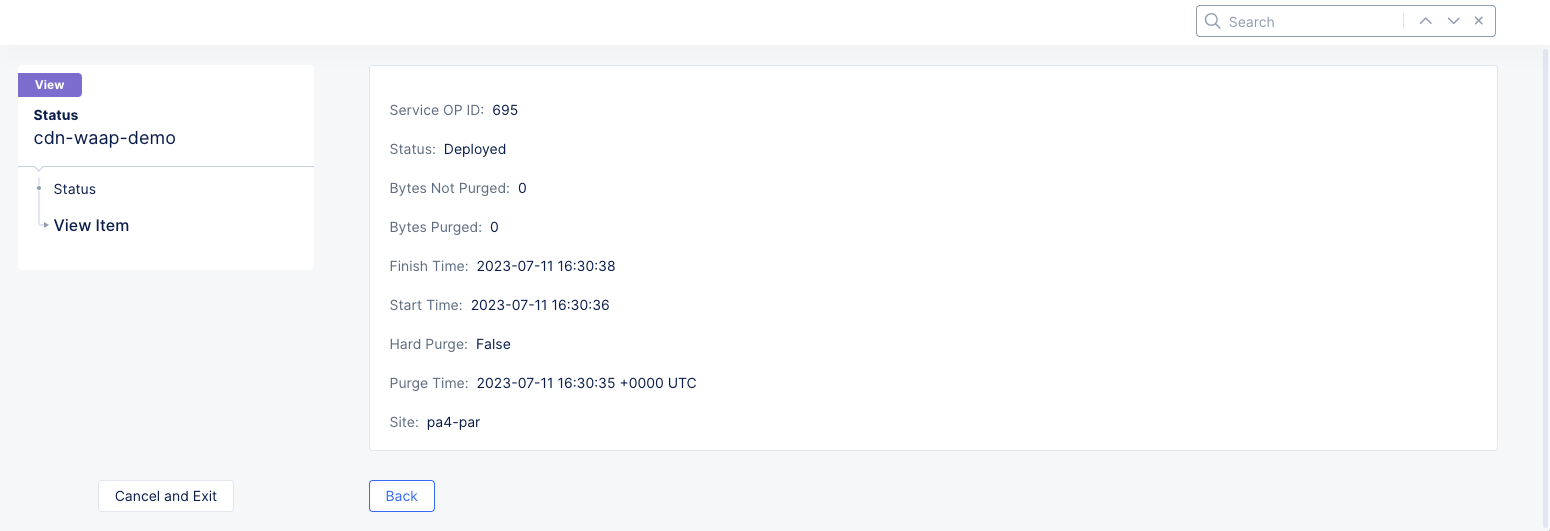
Figure: Distribution Cache Purge Site Details
Click Back to view more site purges or click Cancel and Exit to return to the Cache Purges page.
You can also deploy a cache purge from here by following these steps:
-
Click
Add Cache Purge.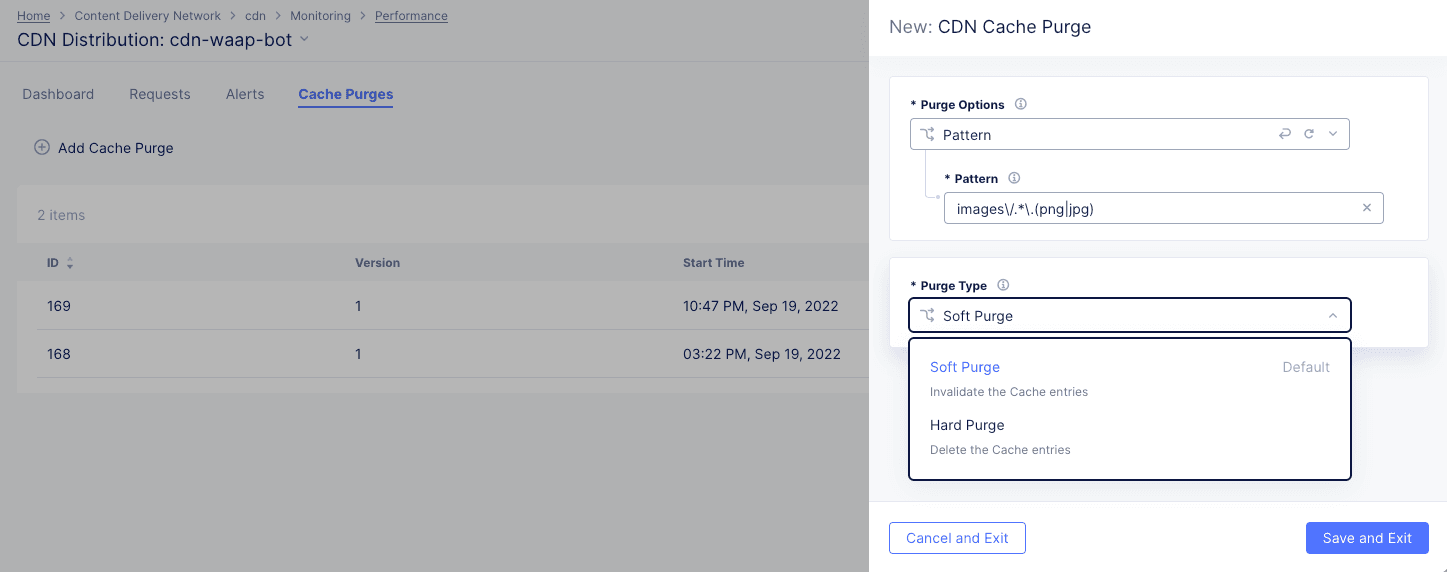
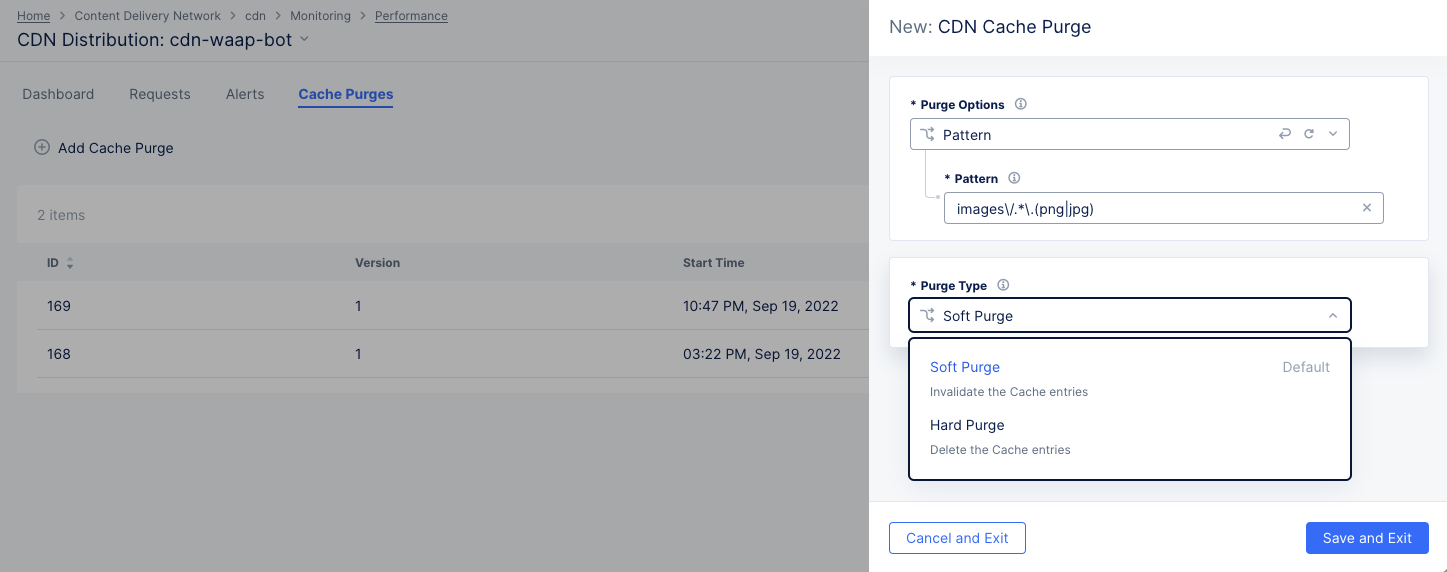
Figure: Distribution Cache Purge Request
-
Select what to purge from the
Purge Optionsdrop-down list.All: Your entire cache will be purged.URL: Purge that portion of your cache identified by the entered URL.Hostname: Purge all content for the entered hostname.Pattern: Purge all content that matches the entered pattern. The string should be entered in Regex form. For example, "images/.*.(png|jpg)" will match PNG and JPEG files in the images directory.
-
Select an option from the
Purge Typedrop-down menu to specify how the purge is to operate.Soft Purgeinvalidates the cache entries, which means the content will be replaced on the next request if the content is stale.Hard Purgeremoves the content from the distribution and forcing the next request to retrieve the content from the origin server.
-
Click
Save and Exitto deploy the purge.
This will create a new entry in the Cache Purges table providing information on your purge.
Note: You can also deploy a purge from the
Distributionspage. See Purge Content in Cache above.
Monitor Cacheable Content in HTTP Load Balancer
The Performance dashboard for a HTTP Load Balancer includes the Cacheable Content widget that displays the percentage of cacheable and non-cacheable requests, along with reasons for requests being considered non-cacheable. This data helps identify which Load Balancers can benefit from enabling CDN caching to improve the application performance.
To monitor performance statistics for a specific load balancer, follow these steps:
-
Select the Multi-Cloud App Connect workspace.
-
Select your namespace from the drop-down list of namespaces.
-
Select Overview > Performance on the configuration menu to view the Performance dashboard.
-
Click the name of the load balancer you want to monitor.
The Dashboard tab is displayed, by default. Scroll down to the Cacheable Content section to view details about the number of requests and data transfers that are eligible for caching.

Figure: Cacheable content - Requests
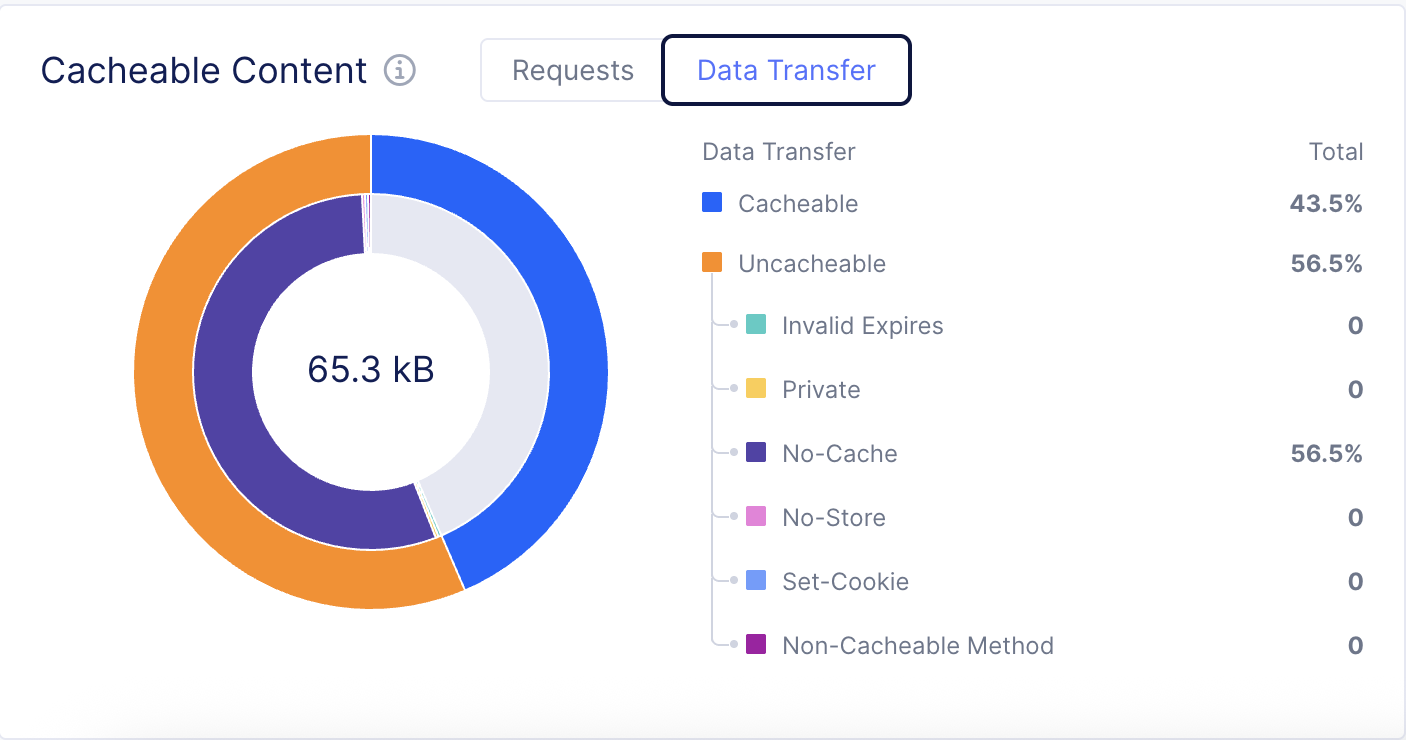
Figure: Cacheable content - Data Transfer
The cacheable content section also displays details about requests that are not eligible for caching with the reason for the requests being considered non-cacheable as follows:
| Category | Description |
|---|---|
| Expires | These responses cannot be cached because there is an Expires header with the value as Zero/Negative. |
| Private | These responses cannot be cached because there is a Cache-Control header with the value as Private. |
| No-Cache | These responses cannot be cached because there is a Cache-Control header with the value as No-Cache. |
| No-Store | These responses cannot be cached because there is a Cache-Control header with the value as No-Store. |
| Set-Cookie | These responses cannot be cached because there is a Set-Cookie header in the response from the origin. |
| Non-cacheable Method | These responses cannot be cached because the requested method is not supported for caching. |
| Cacheable | Cacheable content. |