Troubleshooting Guide for Customer Edge Deployments
Objective
The purpose of this guide is to provide troubleshooting guidelines for App Stack Site and Secure Mesh Site customer edge (CE) sites in various areas. This includes starting with the provisioning phase, data plane, services, and Layer 7 (L7) user traffic.
F5 Distributed Cloud Services Components and Architecture
This section introduces the main components of a CE and the interactions between them. It will help you understand how particular components work along with their dependencies.
Components
Volterra Platform Manager (VPM) is an agent on the node providing configuration of services (for example, Kubernetes and Distributed Cloud Services) and the operating system (OS). VPM is a Docker image that, at first start of the node, configures and activates all services for the node role. After deployment, the VPM is responsible for life-cycle management of the OS, F5 Distributed Cloud Services which include ves-system, kube-system, webhook, and monitoring namespace workloads.
Note the following information for the namespaces:
- kube-system namespace: Kubernetes components responsible for managing the K8s cluster.
- ves-system namespace: Distributed Cloud Services components responsible for CE work.
- Webhook namespace: Webhook pod control for K8s object creation.
Prerequisites
The following prerequisites apply:
- A Distributed Cloud Services Account. If you do not have an account, see Getting Started with Console.
Troubleshooting Tools
There are several tools you can use to troubleshoot your CE site.
UI Tools
In the Console UI, the main place for CE troubleshooting tools is the Dashboard, which is under the Tools tab.
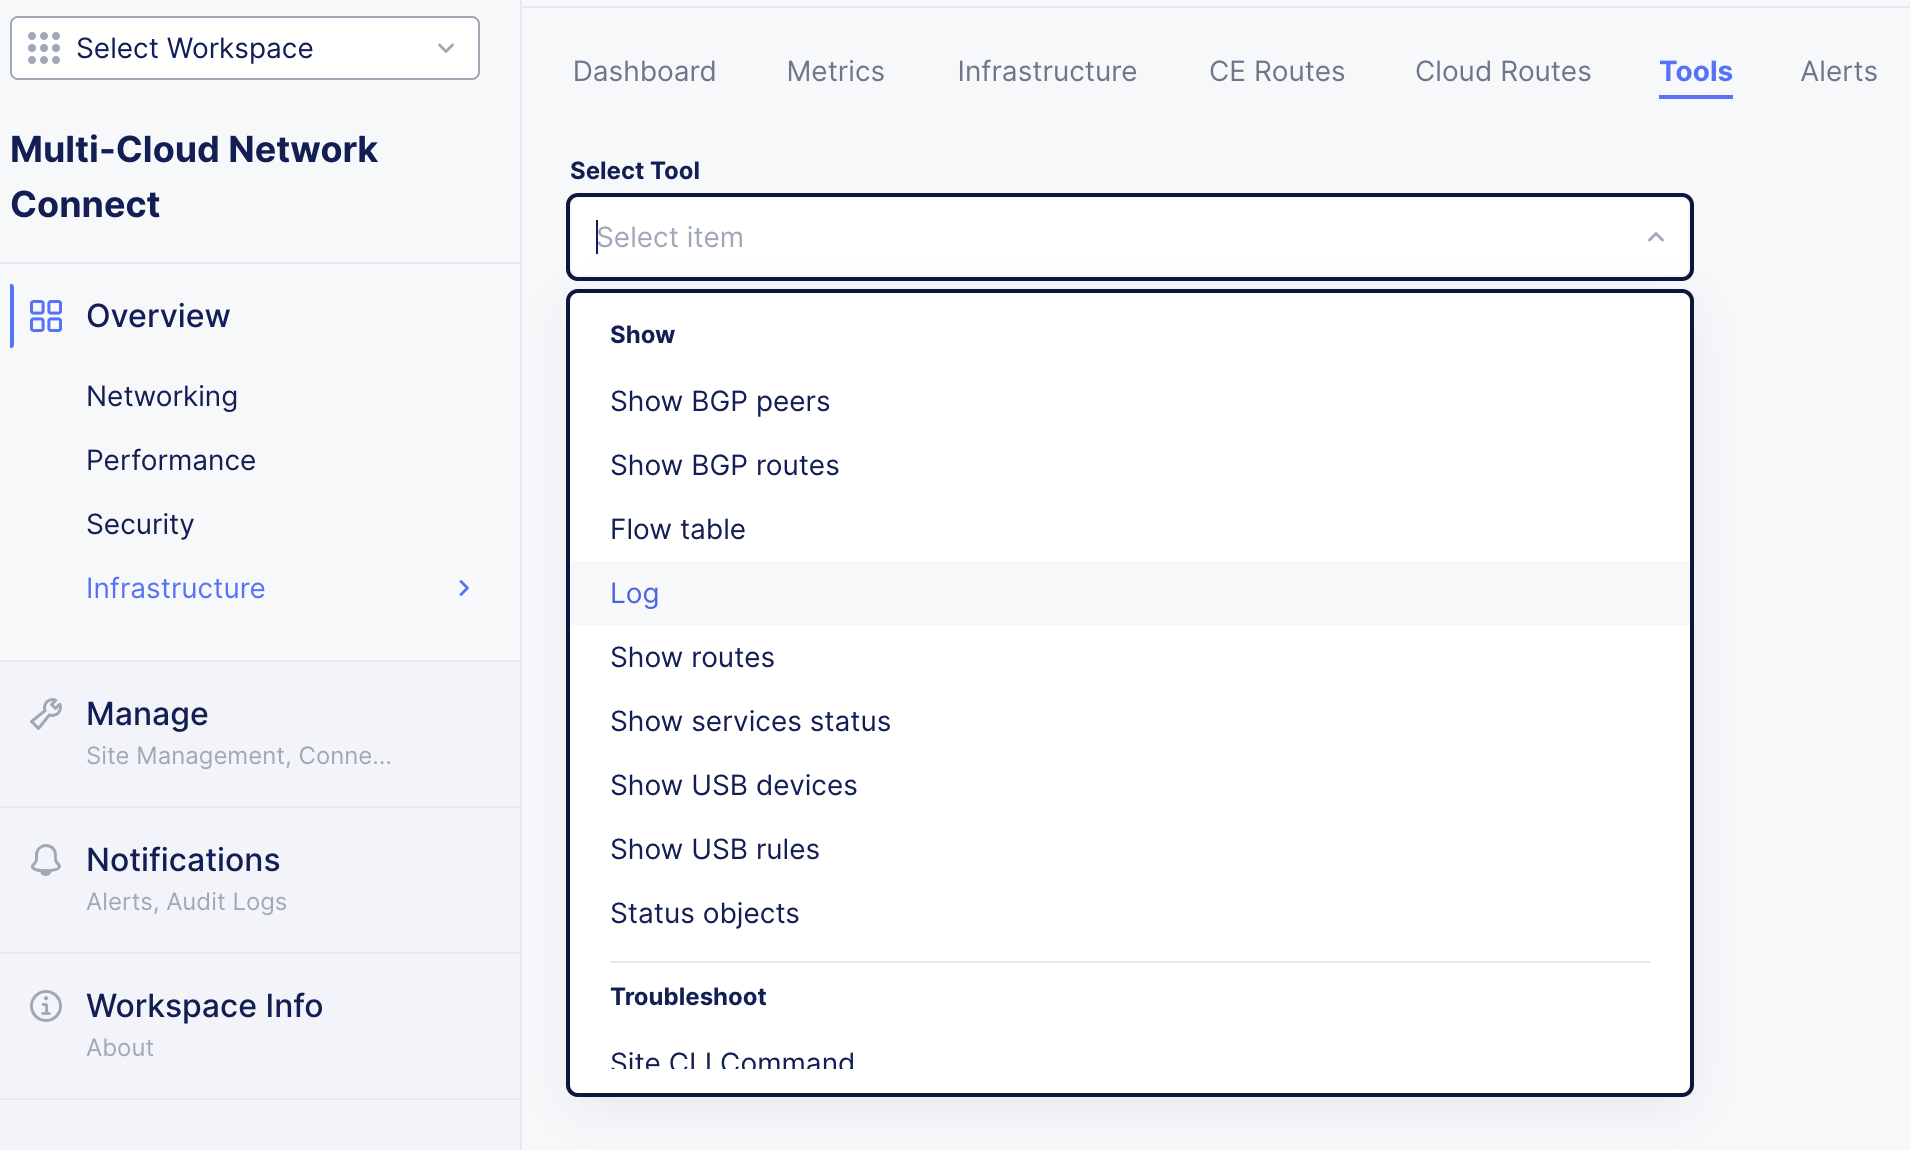
Figure: UI Tools
SiteCLI
SiteCLI is a command-line interface (CLI) tool, where you log in using SSH or a terminal with username admin with the default password of Volterra123 (which you must change after you log in for the first time).
Note that for public cloud CE sites, you must use the cloud-user account username with your private key after registration is completed.
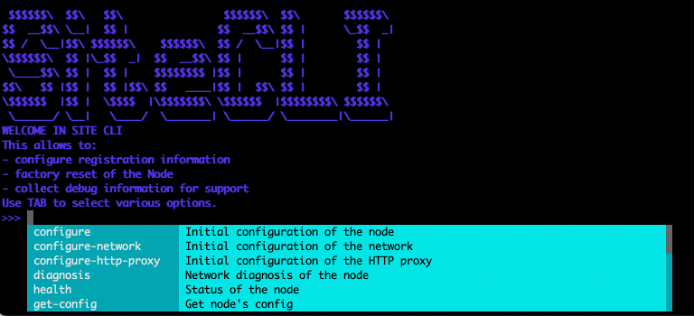
Figure: SiteCLI Tools
Much of the CLI tools are also available via the Console UI. Select Site CLI Command. You can execute commands for each node or view the history of past executed commands. For more information on these commands, see the Early Access Node SiteCLI Reference documentation.
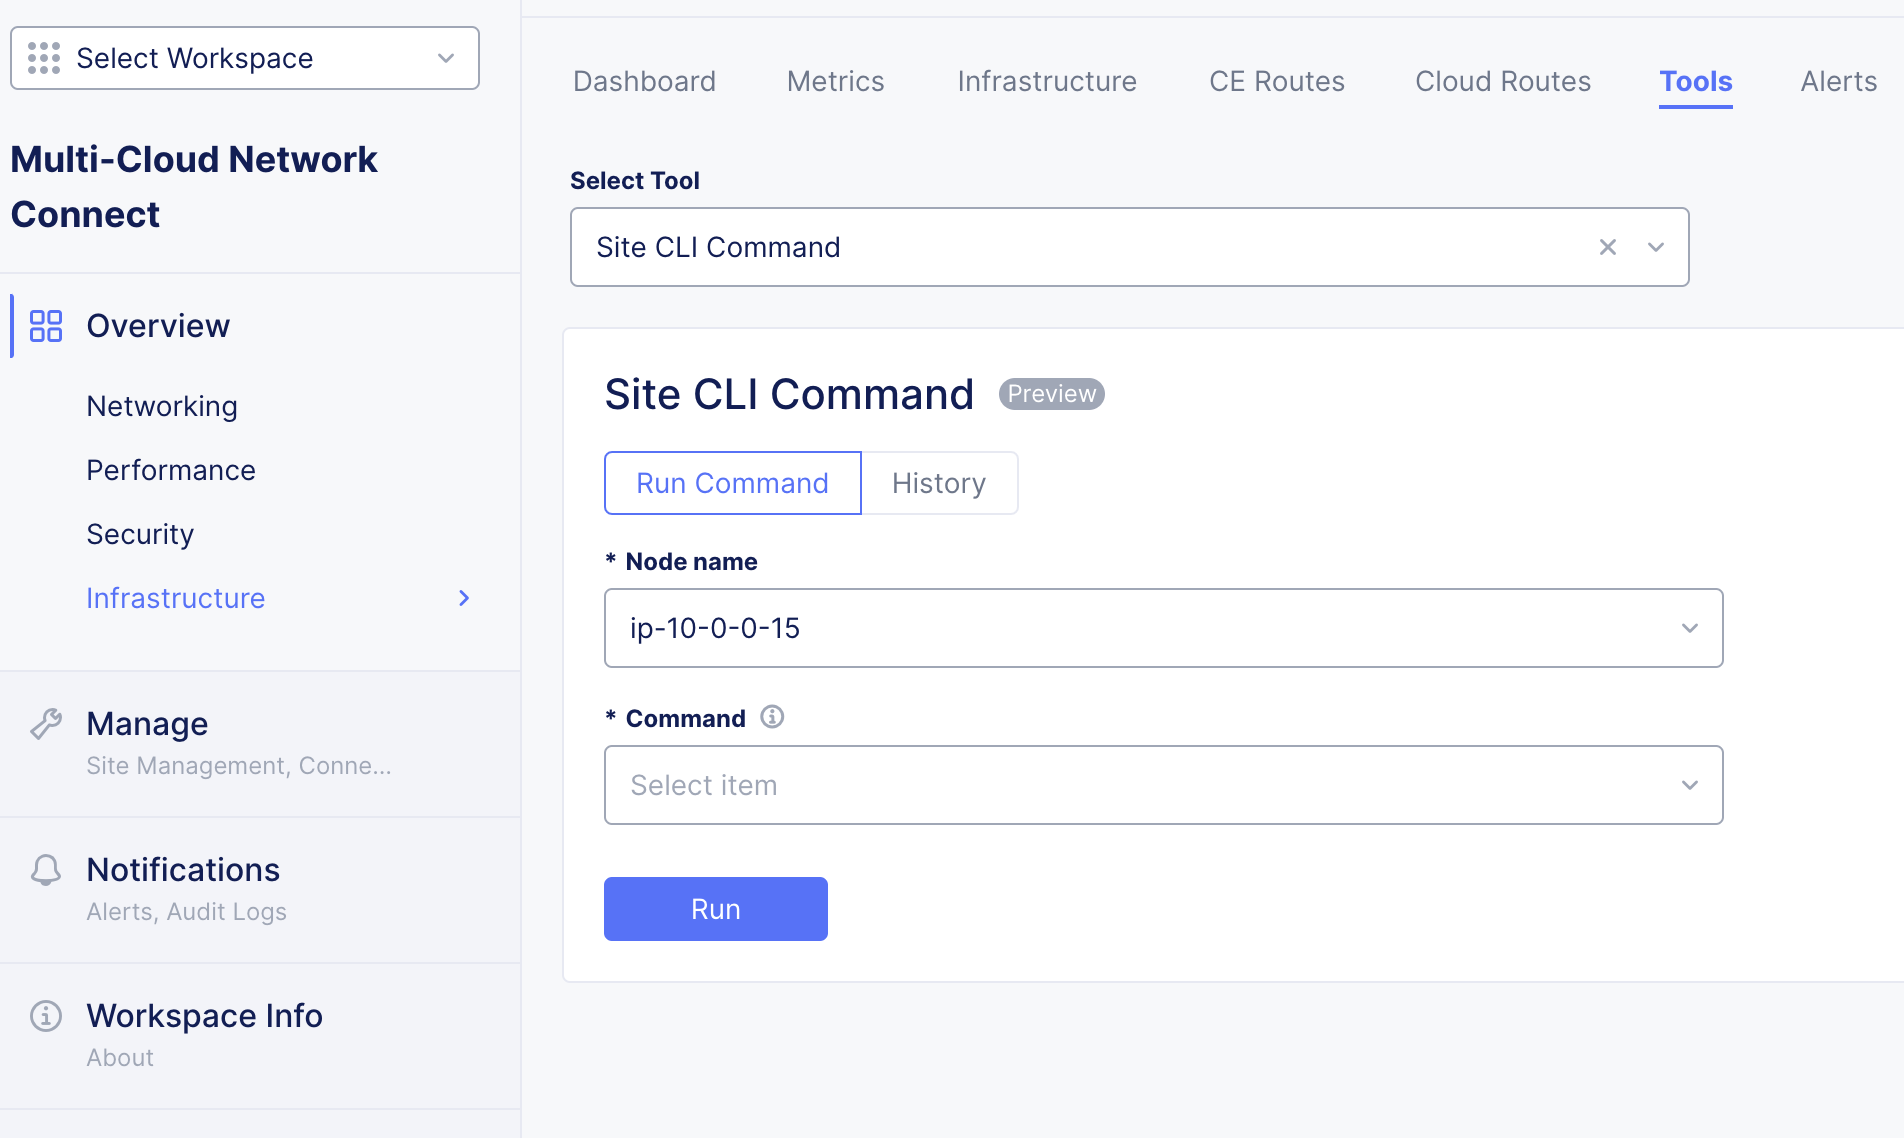
Figure: SiteCLI Tools in Console UI
Note: The SiteCLI commands via the Console UI are only available if the nodes have connectivity to the Regional Edges (RE). In cases where connectivity is unavailable, SiteCLI commands need to be executed locally via SSH.
Site Web UI
You can directly access each node via a web browser by navigating to https://[node IP address]:65500. For example, https://172.16.100.205:65500. For more information, see the Access Site Local User Interface guide.
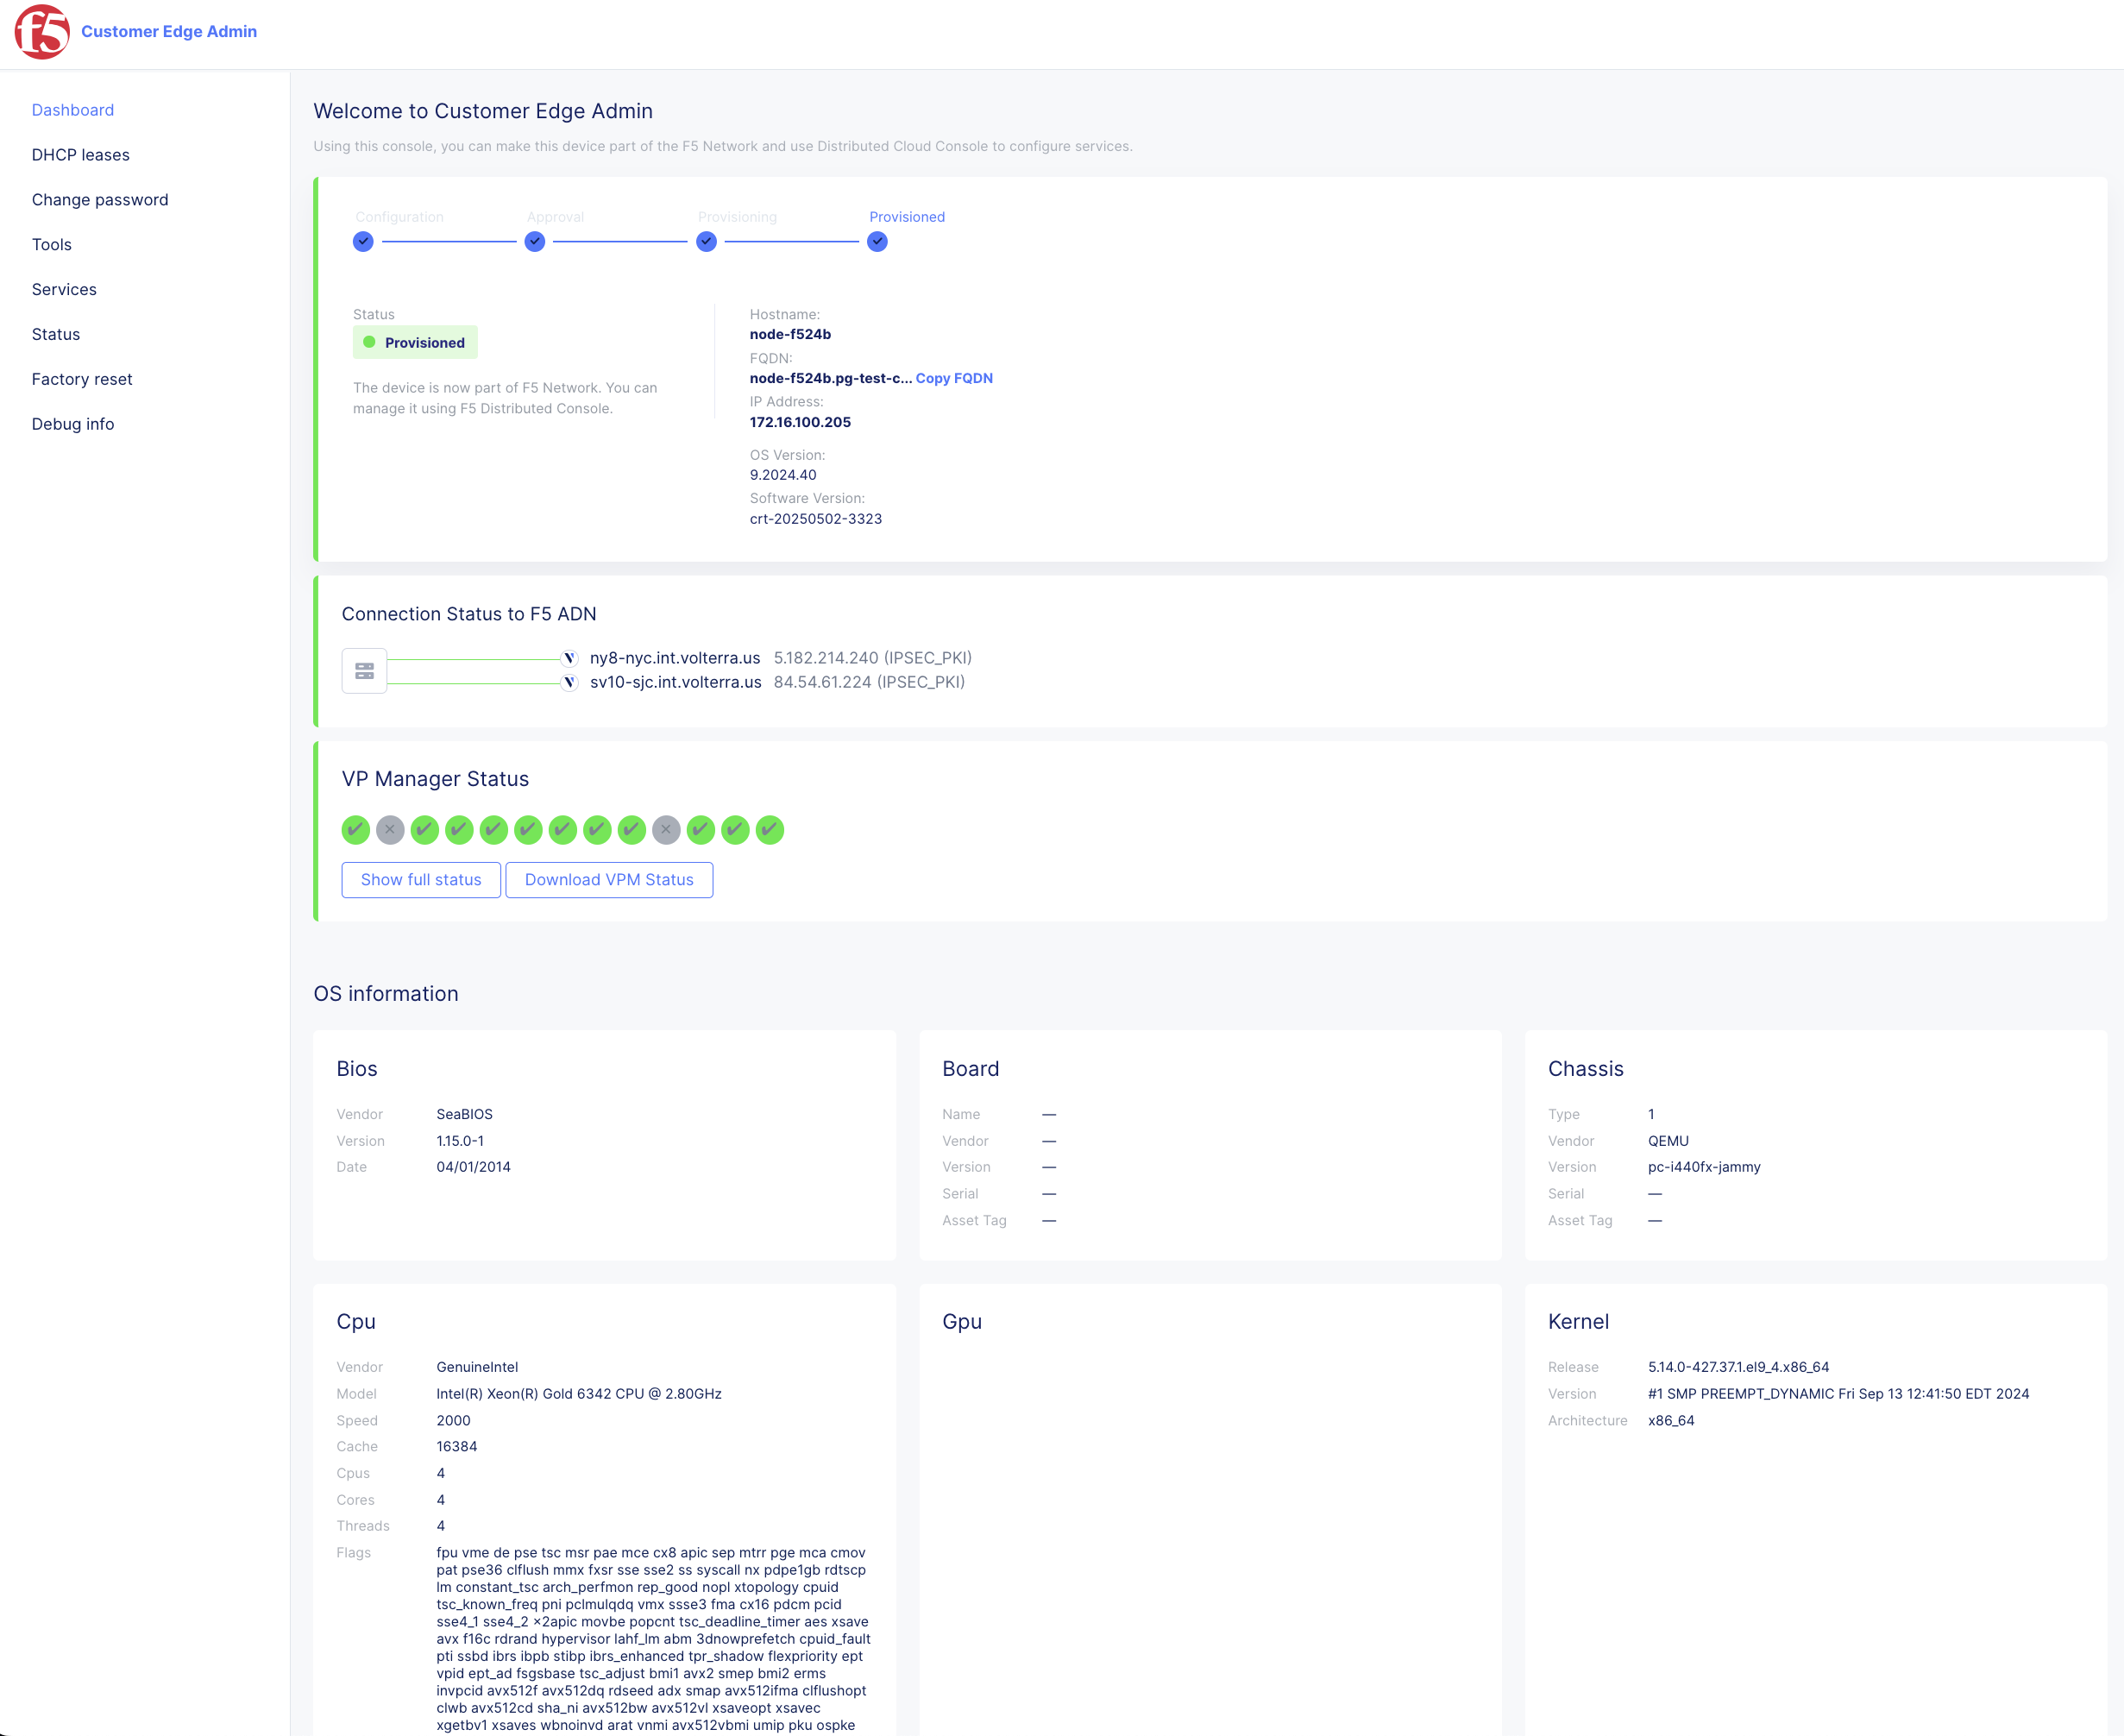
Figure: Site Web UI Tools
Collect Diagnostic Information
The Distributed Cloud Support Team can request diagnostic information for feature debugging.
-
Directly access using a web browser at https://[node IP address]:65500.
-
Navigate to the Debug info page and click Collect Debug Info.
-
After some time, download the debugging information file locally to analyze or share with the Distributed Cloud Support Team. To download, click Browse debugging info files.
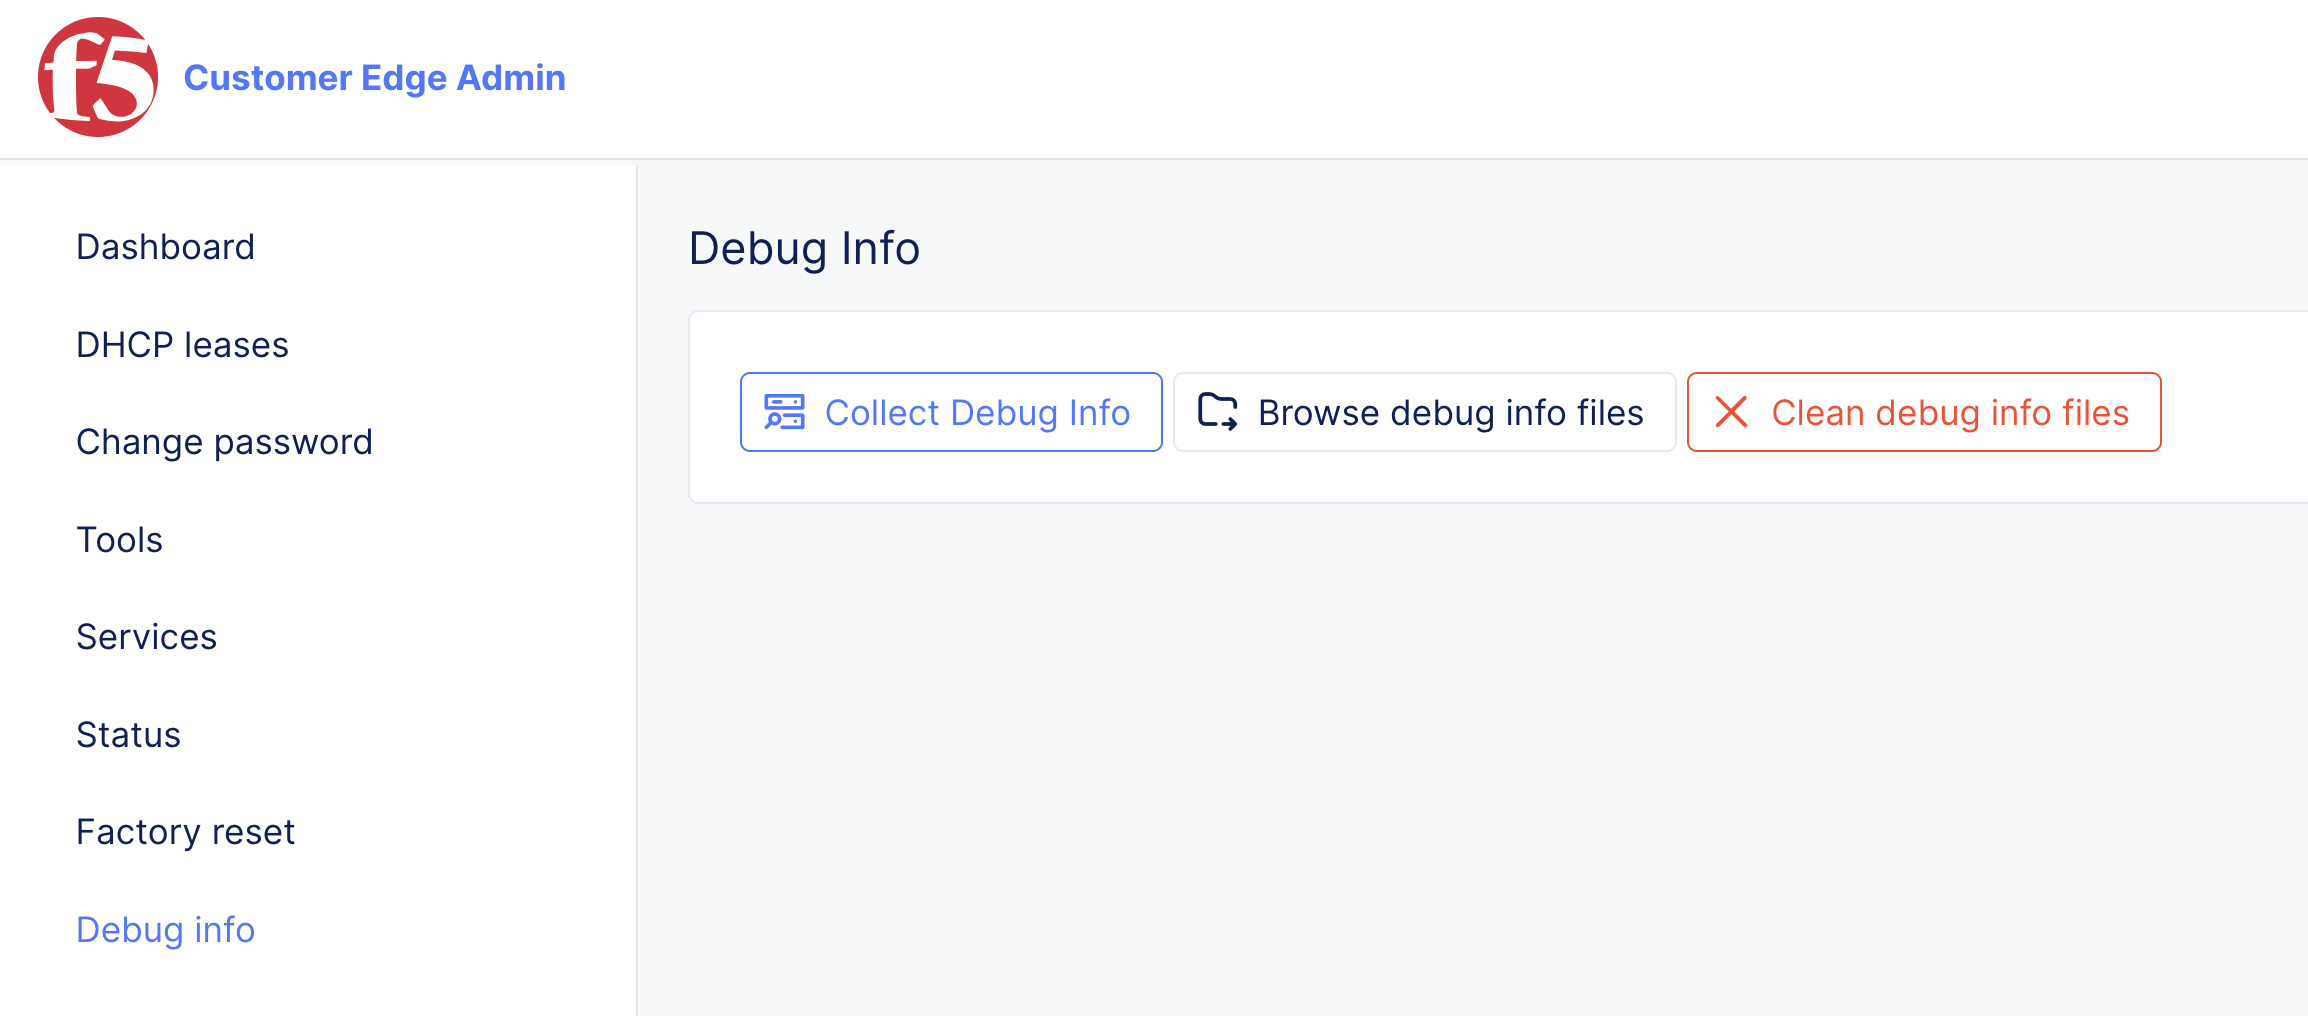
Figure: Diagnostic Information Tools
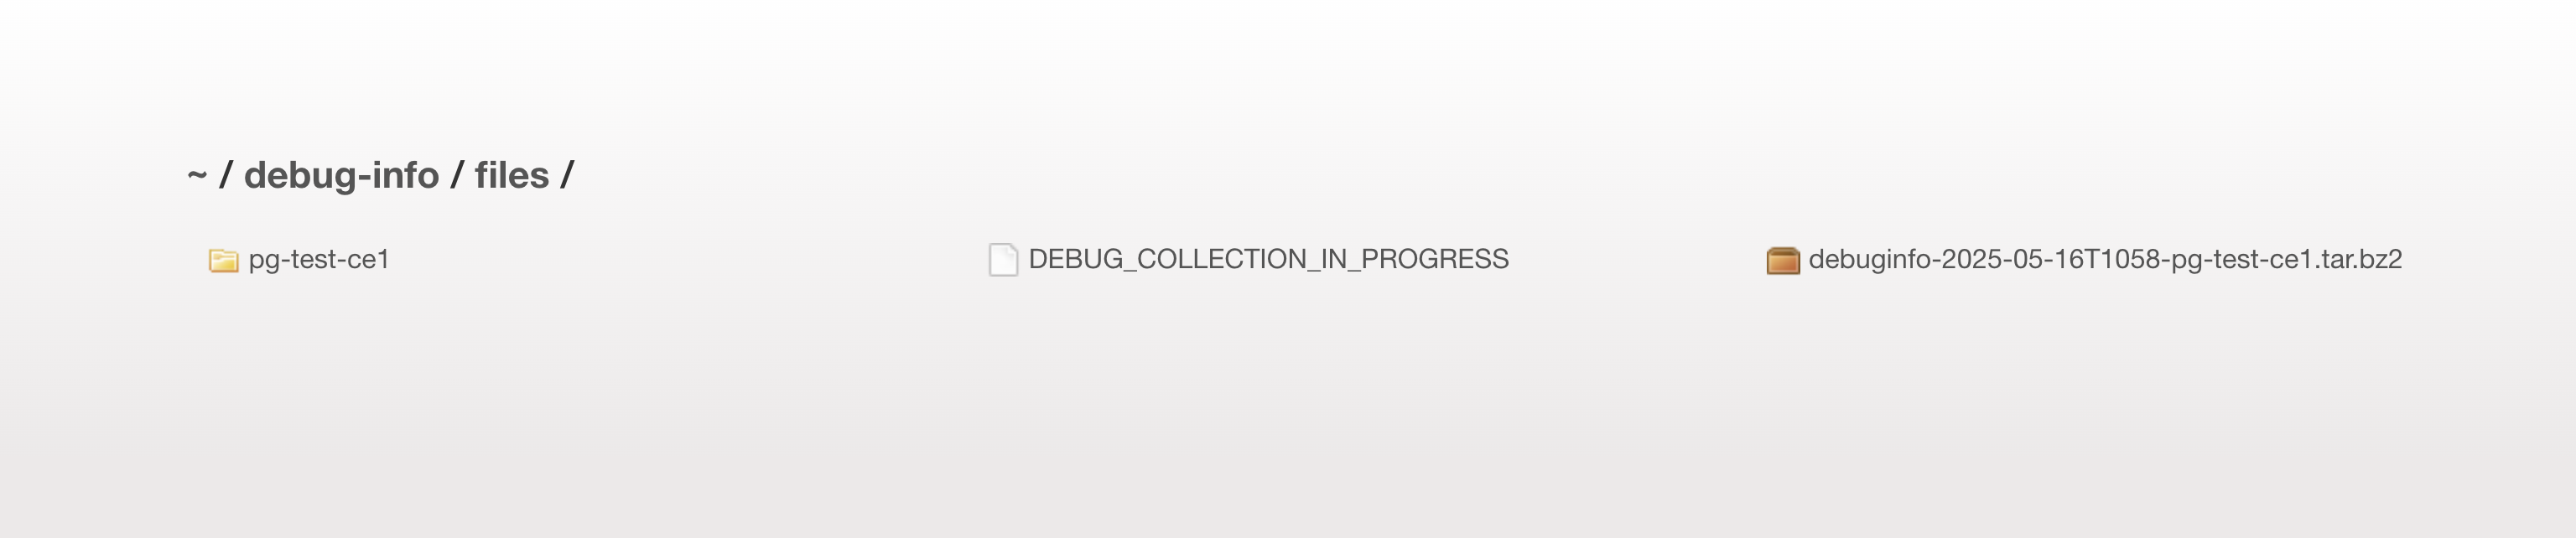
Figure: Browse to Debug File
- Alternatively, you can collect diagnostic information using the Console UI. Navigate to Tools > Collect log bundle.
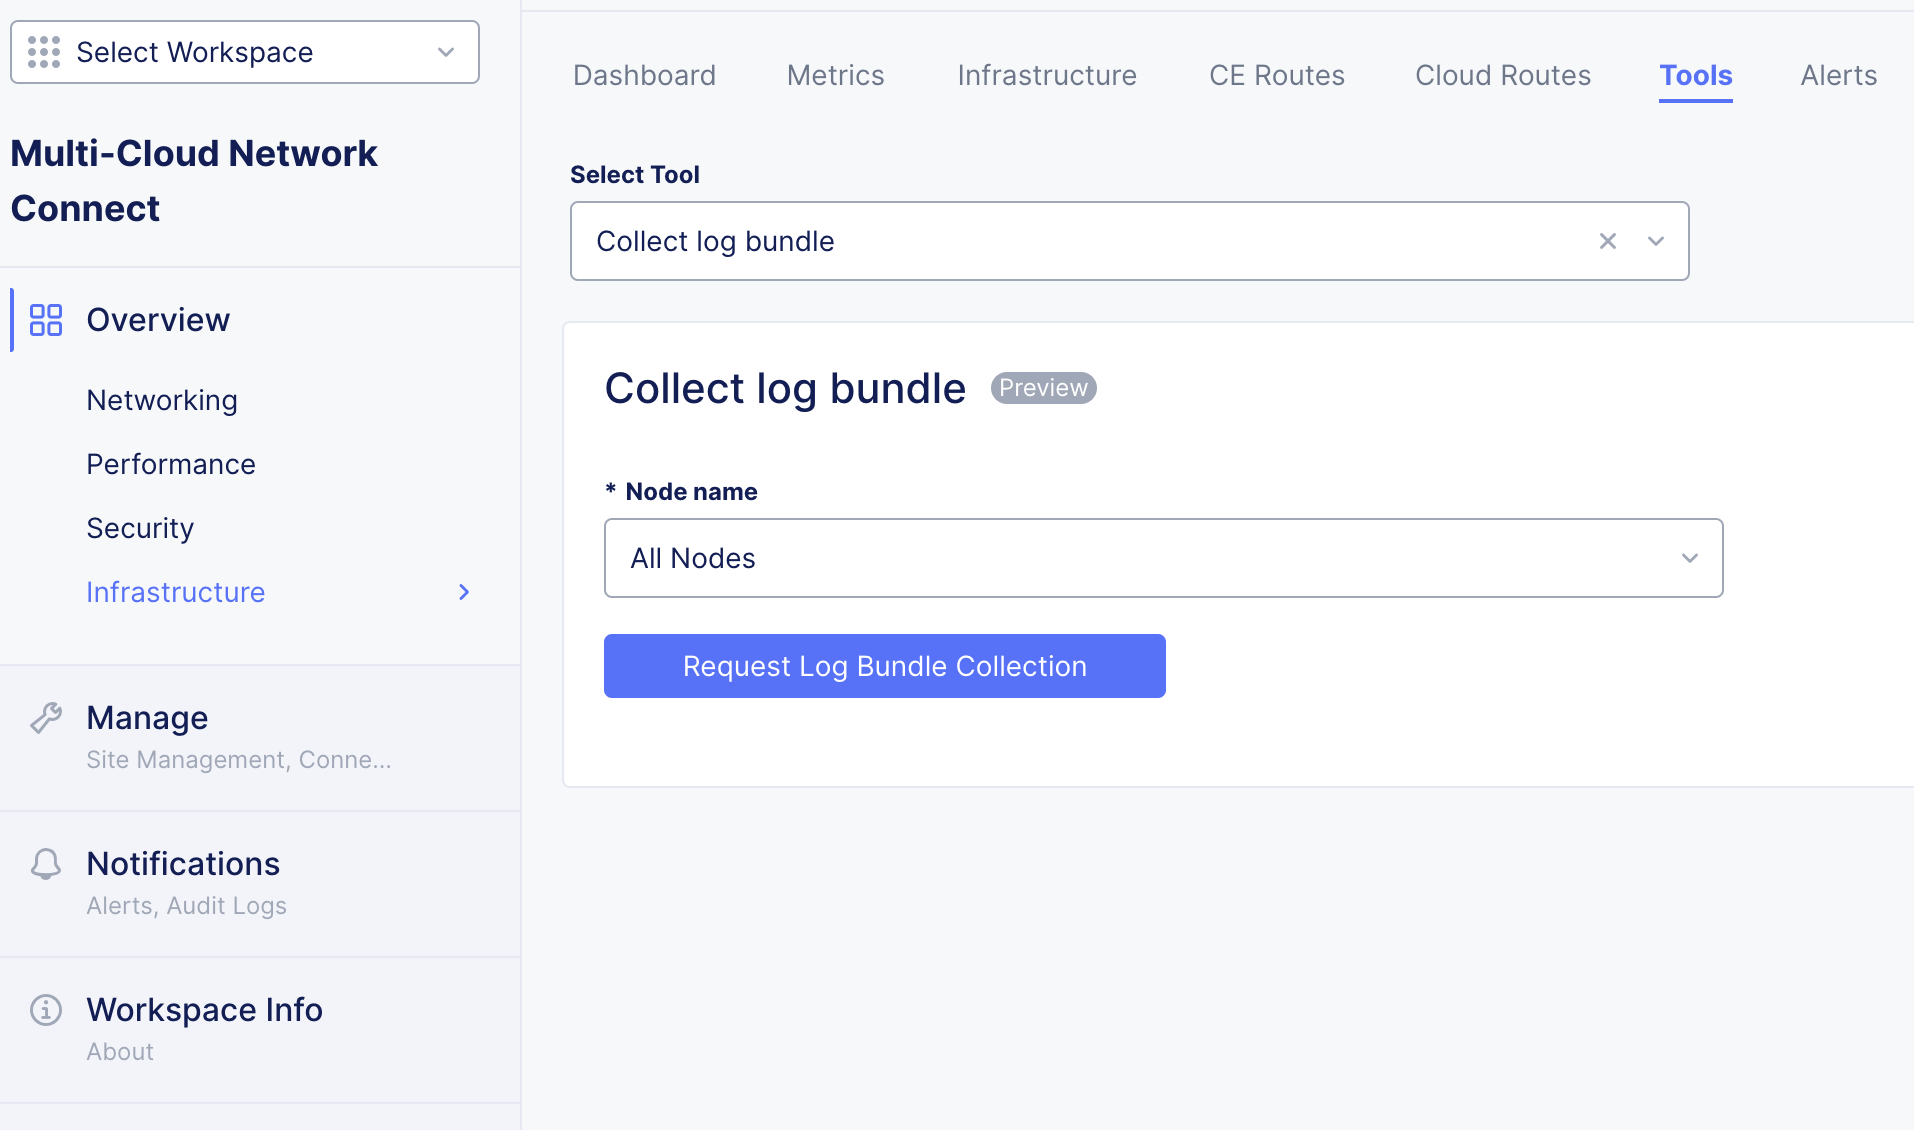
Figure: Diagnostic Information in Console UI
Note: Collecting debug information via the Console UI is only possible if the nodes have connectivity to the Regional Edges (RE). In cases where connectivity is unavailable, debug information must be collected directly from the node.
Troubleshoot Provisioning States
This section provides the right starting point during the provisioning of CE sites based on node state:
Pre-Registration
- Symptom: No pending registration seen on Console for a new CE site.
- Action: Check CE connectivity and VPM logs.
Post-Registration
- Symptom: Pending registration available on Console, but either accepting it fails or CE site never reaches online state and likely can no longer be reached via network.
- Action: Check CE connectivity, VPM logs, and cluster health if formed.
Online
- Symptom: CE site is online, but some L3 to L7 services do not work as expected.
- Action: Check cluster health and control plane described in next sections.
Registration Process Workflow
The diagram below shows how VPM interacts with Global Controllers during installation.
Note: Maurice and Charmander are Global controller components responsible for CE configuration management.
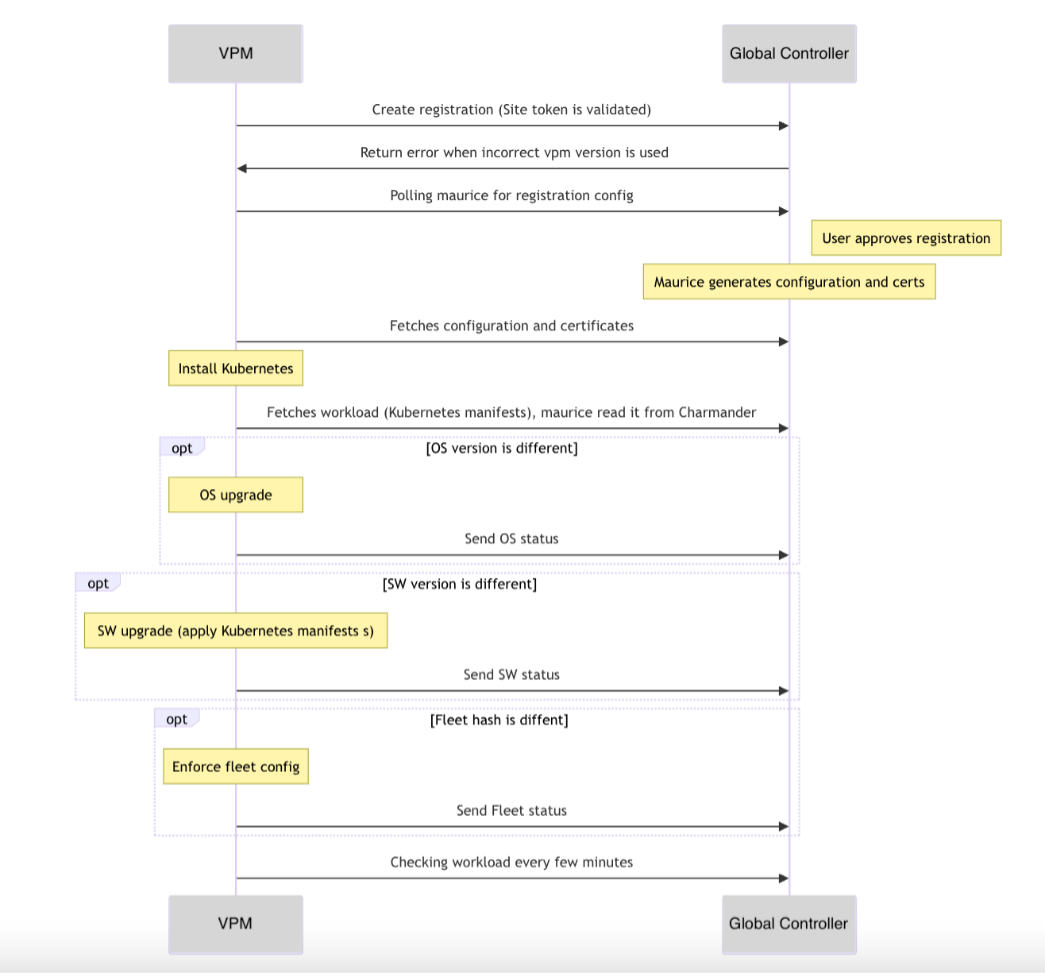
Figure: Registration Process Workflow
Troubleshoot VPM
Volterra Platform Manager (VPM) is an agent on the node providing configuration of services (like Kubernetes and services) and the operating system. As the main tool responsible for node provisioning, log output analysis is critical to identify the root cause of an issue.
VPM Status Check
- Directly access using a web browser at https://[node IP address]:65500.
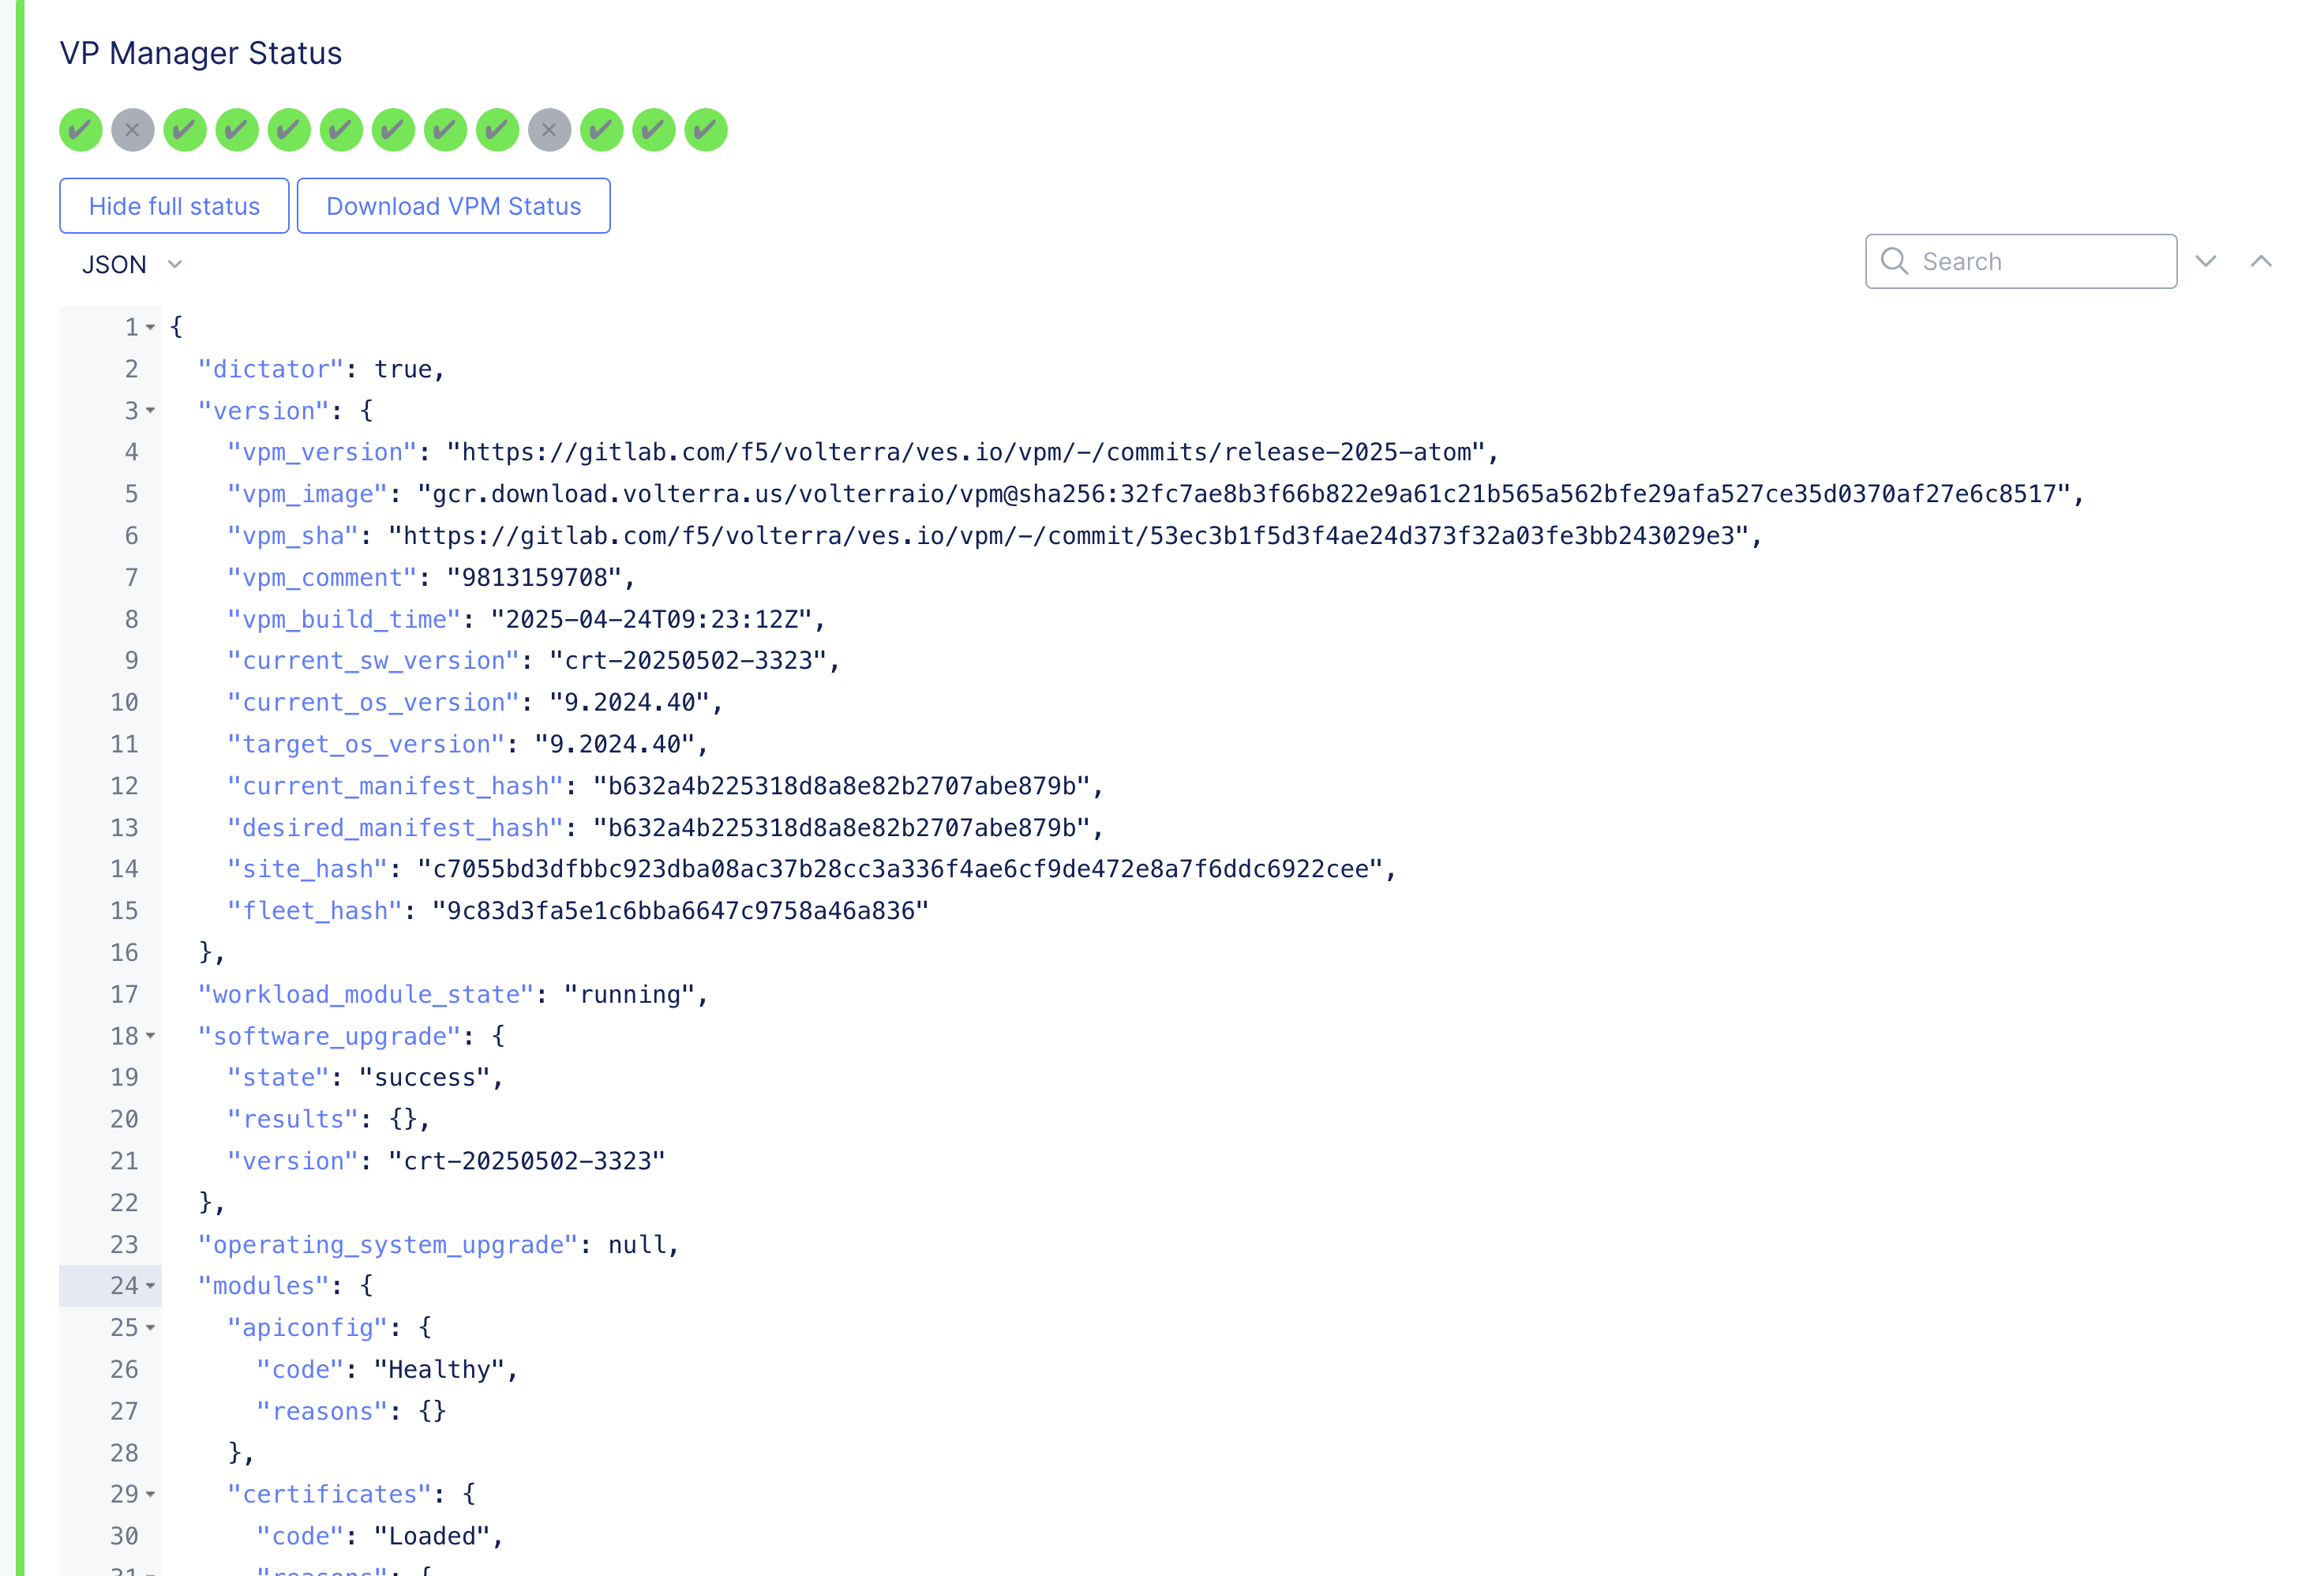
Figure: VPM Status Check
- For SiteCLI, enter the following: execcli systemctl-status-vpm.
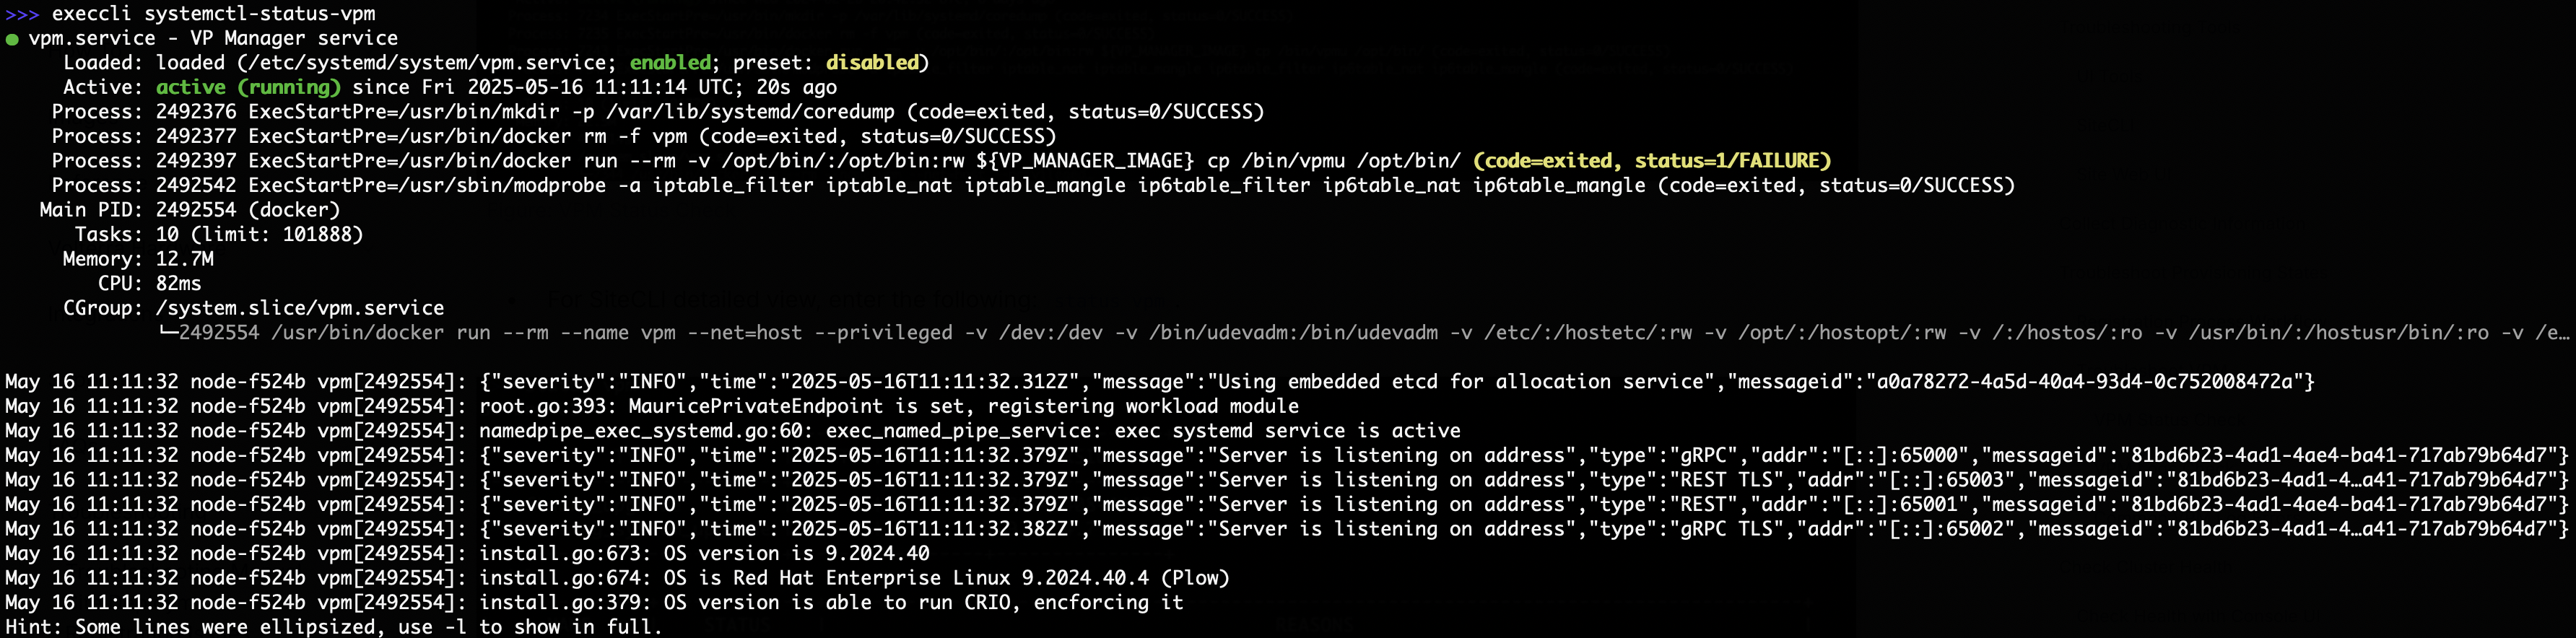
Figure: VPM Status Check
- For SiteCLI detailed view, enter the following: status vpm.
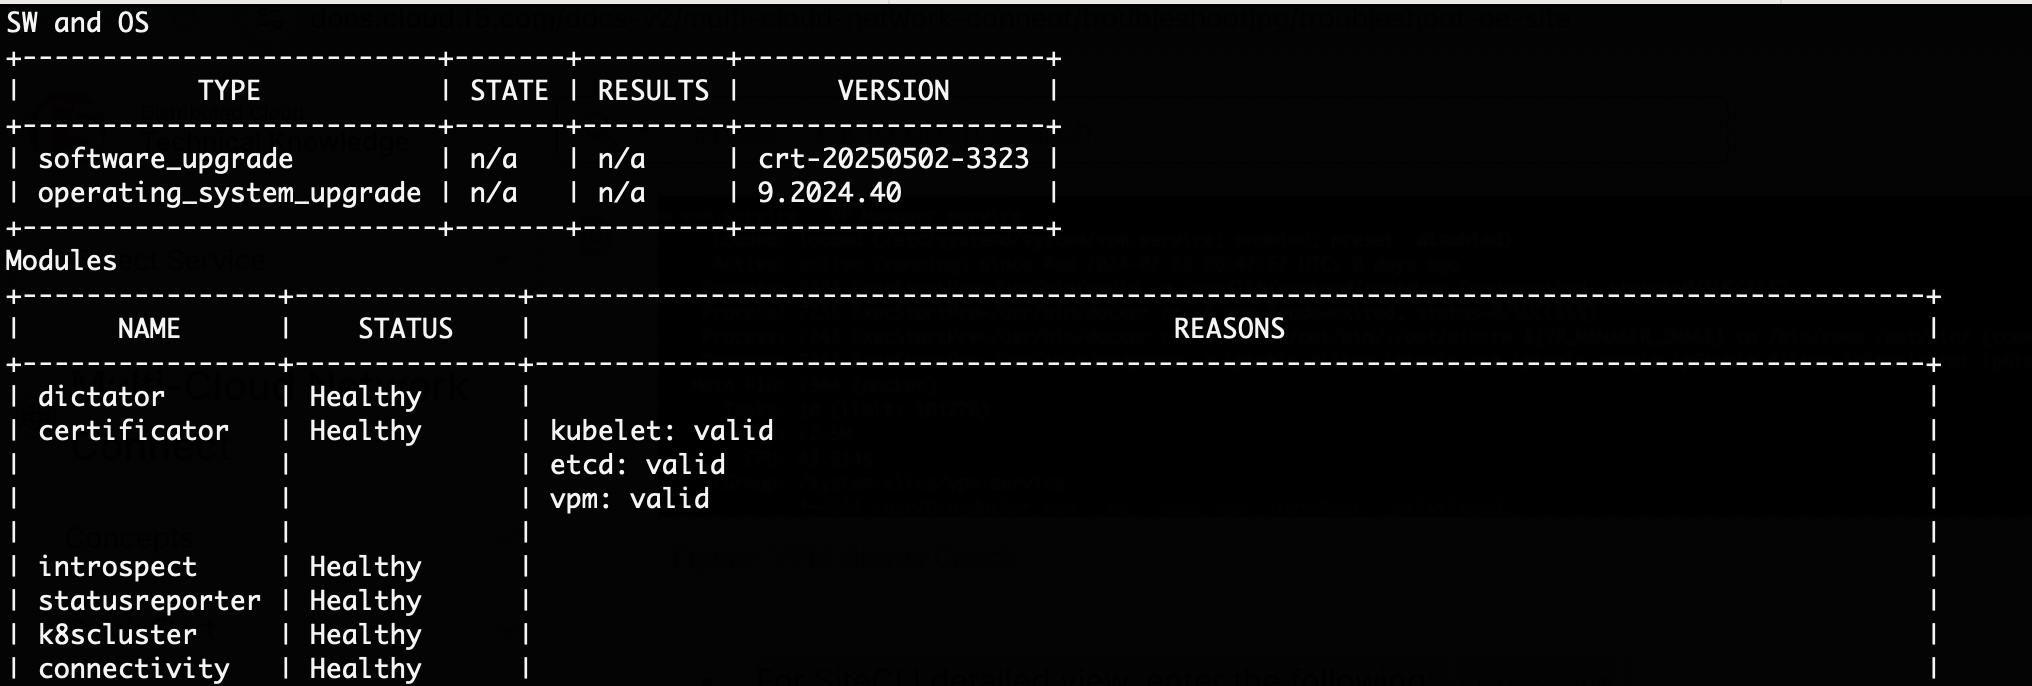
Figure: VPM Status Check
The status vpm command provides:
- Software upgrade and OS upgrade status and current version.
- Registry connectivity status.
- K8 cluster status.
- Service responsible for certificates management status.
- Node certificate validation.
- Installation logs and status.
- All node ves-system pod statuses (all remaining Distributed Cloud Services software managed by Kubernetes).
Restart VPM
Restart VPM using the execcli systemctl-restart-vpm command.
VPM Logs Check
As the VPM is responsible for provisioning of the node/cluster, the first place to start debugging are the VPM logs. Before getting logs, confirm that the VPM works by using the following command: execcli systemctl-status-vpm.
You can access the logs using any of the three methods.
- Using the SiteCLI method: execcli journalctl -fu vpm.
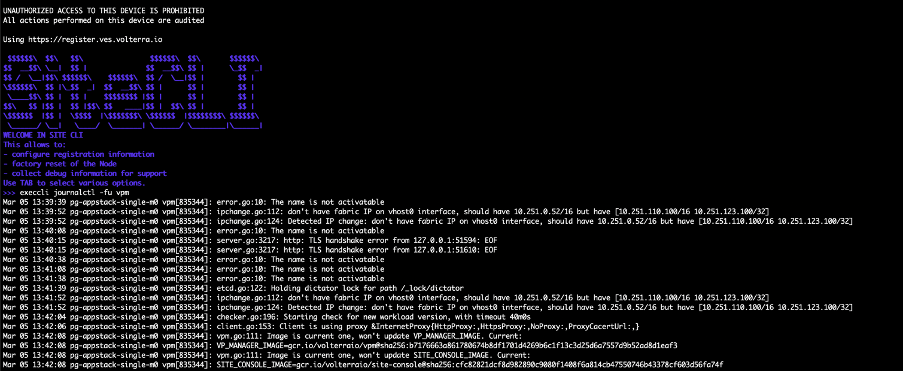
Figure: VPM Logs Check
- Using the Console method: navigate to your site's dashboard and then click the Tools tab. From the Select tool menu, select Log.
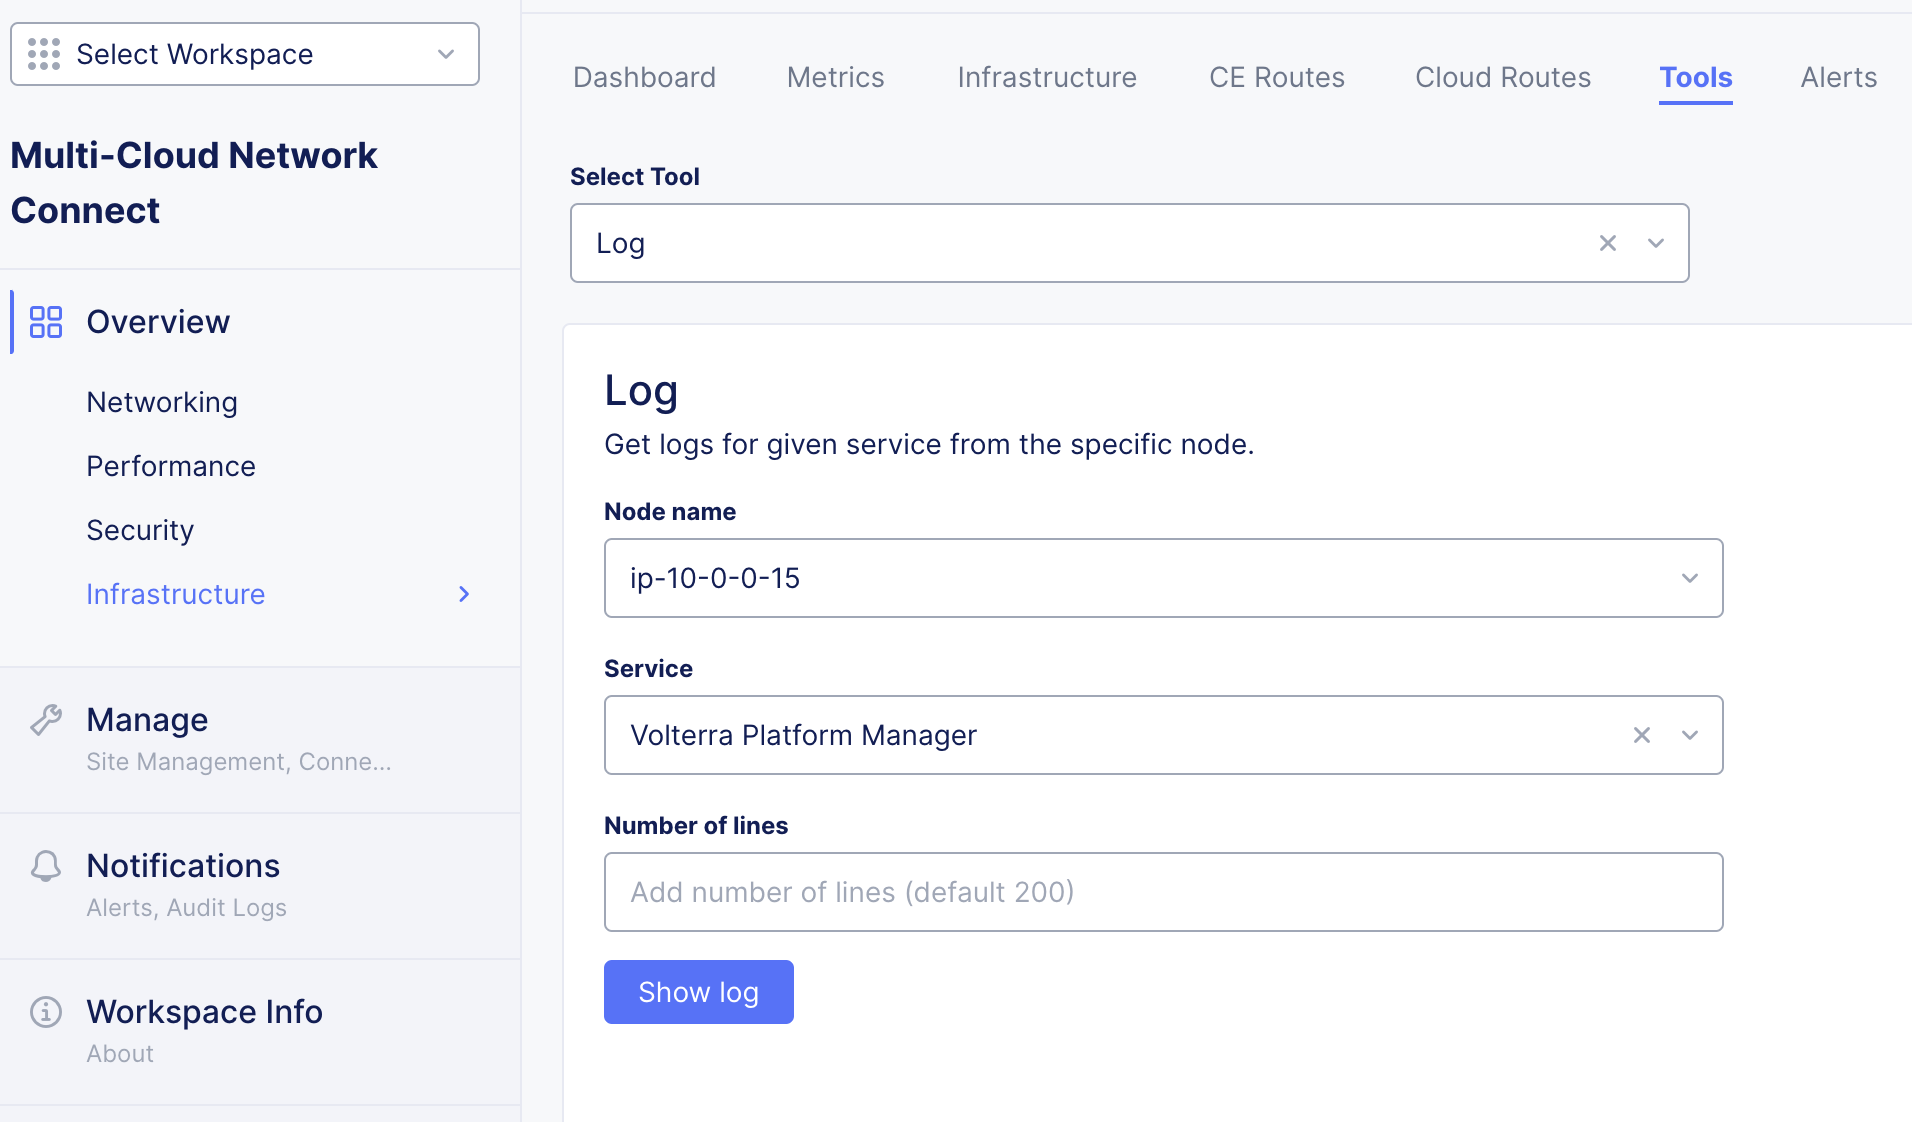
Figure: VPM Logs Check
- Directly on the node. Navigate to https://[node IP address]:65500. Select Tools. From the Select tool menu, select Show Log.
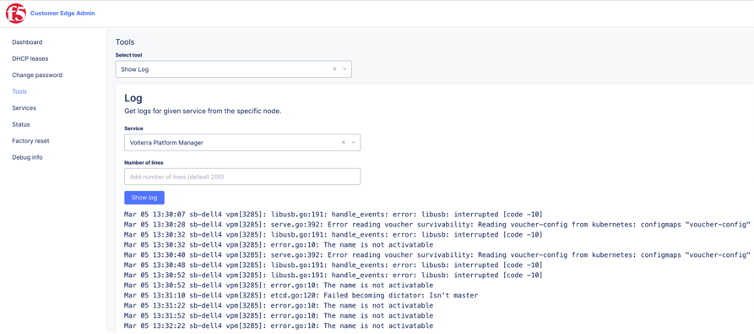
Figure: VPM Logs Check
Common VPM Log Errors
Common error log messages for the VPM during site deployment. For more information, refer to the Troubleshooting Guide for Secure Mesh Site v2 Deployment guide.
In this section, some common log messages and corresponding actions for Secure Mesh Sites (SMSv1) are presented.
…PENDING…
A node is ready to be admitted pending registration.
Current state: PENDING, registration c6d2a9a6-b834-466c-87ff-fc9d1e02c0e0 must be manually APPROVED and then automatically ADMITTED.
Lack of it before registration can indicate some issues. For more information, see the next log message description for Can’t reach the state to accept registration.
Action: Accept registration, if it is a multi-node cluster. Be sure that in the registration form, number of nodes equals three (3). During the acceptance of registration, you can provide a specific version of F5 Distributed Cloud Services software (CRT) and operating system (OS) version.
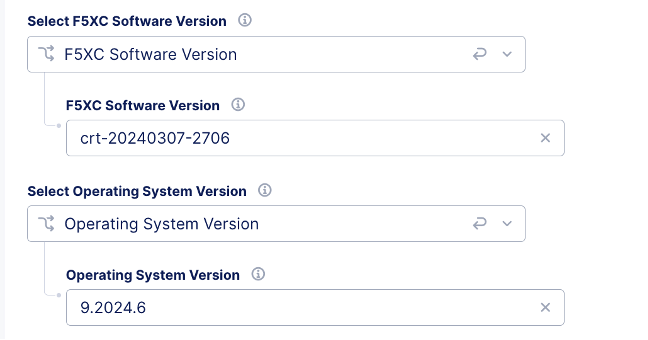
Figure: Pending State
Can’t reach the state to accept registration
There is no …PENDING… log during provisioning and node not seen as pending registration in Console: Multi-Cloud Network Connect > Manage > Site Management > Registrations.
Action: Check communication of the node via execcli command. Check IP address and ping using execcli ip address and execcli ping google.com.
The SiteCLI diagnostic command provides more complex connectivity tests but cannot be provided as it requires k8s already deployed to be available after deployment diagnosis.
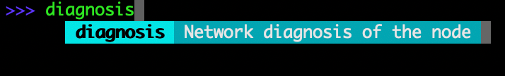
Figure: Cannot Reach State
If communication works, check that the provided cluster and node names match the configuration provided in the UI.
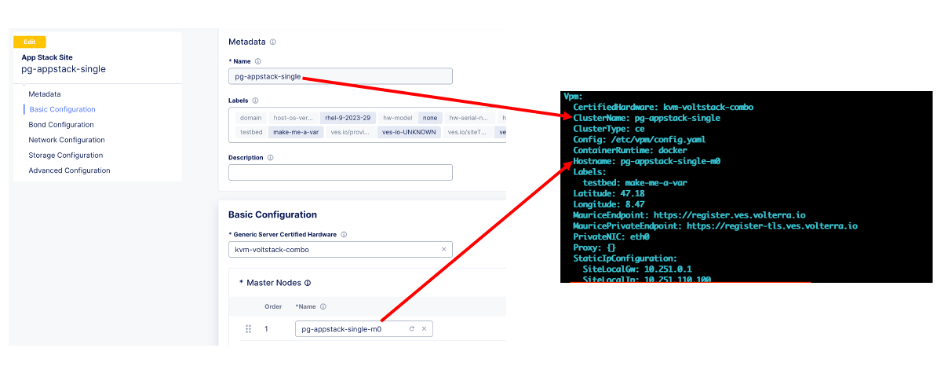
Figure: Matching Names
Invalid token
Invalid token provided; the node never reaches the state to be ready for registration.
Registration failed: Registration request: Request Register failed: Response with non-OK status code: 500, content: "Unknown token: Token doesn't exist.
Alternatively, the wrong API endpoint is provided. If you use F5 Distributed Cloud Services dedicated Global Controllers infrastructure, the correct API endpoint should be provided.
Registration failed: Registration request: Request Register failed: Request error: Post "https://[URL] /registerBootstrap": Internal Server Error.
Action: Check the token value using the SiteCLI get-config command to print VPM configuration.
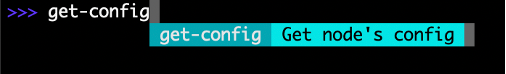
Figure: get-config Command
In the Vpm: section: look for the Token value and compare with the token generated for this tenant.
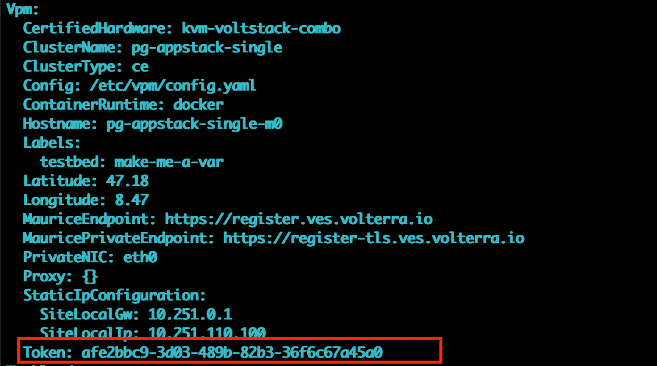
Figure: Check Token Value
If the token is invalid, provide a valid one. Be careful with copy/paste actions as not to provide any whitespace characters. To generate a new token, follow the instructions at Create Site Token.
If the token is valid, it can be at the wrong registration API endpoint. Check if the registration URL is correct. The default is https://register.ves.volterra.io. Look for the VPM section for MauriceEndpoint.
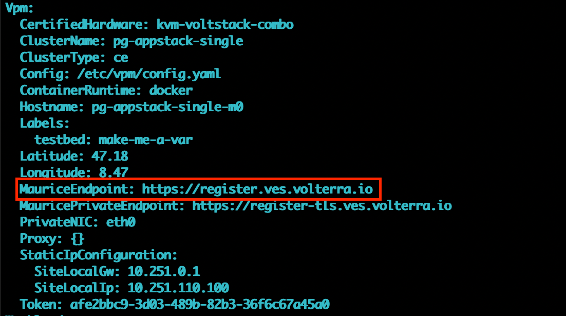
Figure: Check API Endpoint
If during provisioning registration the API URL was wrongly provided, the only way to fix it is start to from initial configuration via SiteCLI again (after a factory reset operation is performed).
Missing token
Upgrade of the node or redeployment of one of the cluster nodes fails due lack of token.
In the VPM logs following error can be seen: register.go:805: Config request #6 failed with: Request Config failed: Response with non-OK status code: 500, content: 0Can't find tenant for token: Token doesn't exist;2024-03-14 19:07:54.173328263 +0000 UTC m=+129052.531390838,, waiting 16.233694717s before next try.
Action: Re-deploy cluster or contact the Distributed Cloud Support Team.
Important: If token is deleted from the Distributed Cloud Console after installation, the upgrade of the node and update certificates for the node will fail. Be sure that the token exists before upgrading. Good practice is not deleting any tokens used for deployment at all.
Wrong certified hardware profile
In the process of registration acceptance, the certified hardware mismatch error occurs.
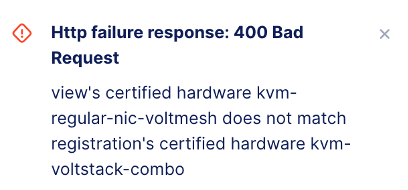
Figure: Check Certified Hardware
Action: Check if the provided certified hardware matches the criteria for the given deployment. In the UI, which represents the Global Controller view, the configuration must match to the profile provided during node configuration with SiteCLI. Check the certified hardware profile using the SiteCLI get-config command to print VPM configuration.
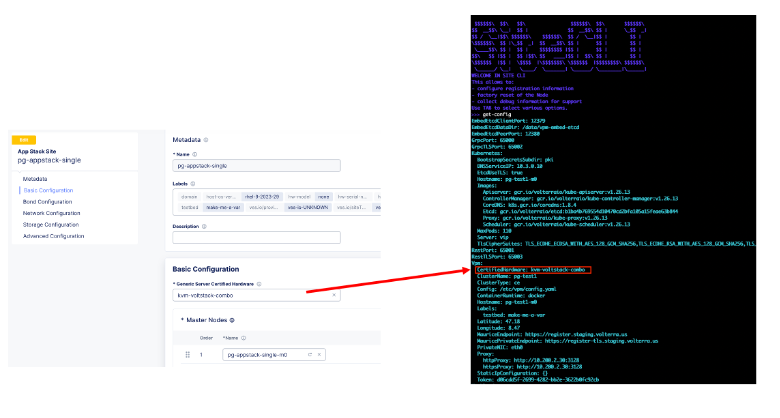
Figure: Check Certified Hardware Menu
To check a list of available hardware profiles for a tenant, navigate to Multi-Cloud Network Connect > Manage > Site Management > Certified Hardware. Each detailed specification can be checked.
If the profile is wrong, as in wrong name or interface list, the node must be reset to factory settings using the SiteCLI and provisioned again. To execute factory reset, run command: factory-reset.
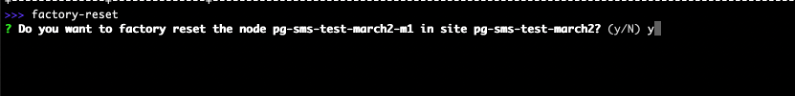
Figure: Factory Reset Command
Note: The factory reset operation only works on bare metal/KVM cases. If you are faced with resetting configuration, redeployment is an alternate method to move forward.
Certified hardware profiles editing
In some cases, you can find dedicated per-customer-certified hardware profiles that are not presented on the ISO. These profiles require manual edit in the ISO before registration.
To edit the certified hardware profile, run command: execcli edit-certified-hardware.
active: [name of the profile] # this profile will be used for provisioningoutsideNic: - name of NIC that be used as outsideprimaryOutsideNic: in majority of cases the same interface as outsideNICVpm:PrivateNIC: eth0. – NIC name used by VPM to communicate outside of CE, e.g. download images etc.Example of full certified hardware profile:
active: hp-proliant-dl360-voltstackprimaryOutsideNic: ens2f0certifiedHardware: hp-proliant-dl360-voltstack: Vpm: PrivateNIC: ens2f0 outsideNic: - ens2f0To locate the full list of Certified Hardware available for a tenant, navigate to Multi-Cloud Network Connect > Site Management > Certified Hardware.
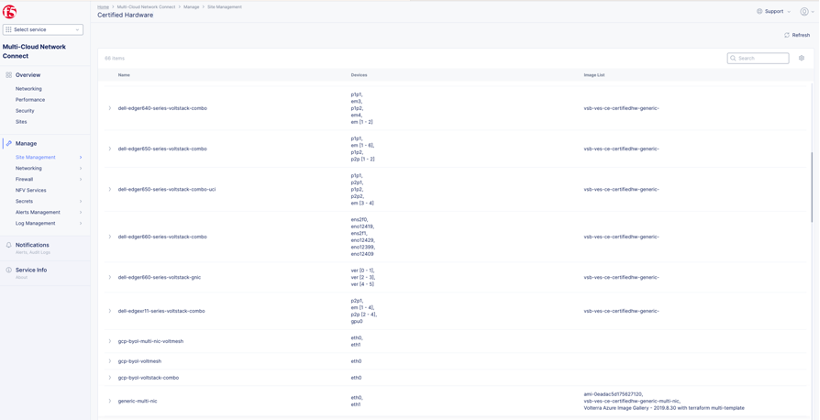
Figure: Full List of Certified Hardware
In the list, the most important details are the profile name, interface allocation, and naming. Profile naming conventions include the following:
- voltstack: Dedicated for App Stack Site
- voltmesh: Dedicated for Secure Mesh Site
- kvm: Kernel-based Virtual Machine
- gcp: Google Cloud Provider
- aws: Amazon Web Services
Duplicated key
Re-using the same name for new sites can cause issues, and during node deployment, no pending registration notice appears in UI. In VPM logs, the following error occurs:
register.go:707: Registration failed: Registration request: Request Register failed: Response with non-OK status code: 409, content: 'Create: Adding with usage transaction: STM ErrorValue playground-wtppvaog/pg-test1..../pg-test1-m0, Key: 1198fad4-0c8c-4c88-b334-4b03b82dc23f, Duplicate Keys: 854cffb5-f316-4ab5-89e3-3b340f931e429Action: Check if the node in the cluster is already created or if some failed deployment with the same name exist. If yes, delete them and start a new node deployment. Alternatively, you can change the name of the cluster for a new deployment to avoid conflicts. If there is no configured cluster with the same name, create a support ticket to fix the issue.
Check Cluster Health
This section provides guidance on how to check cluster health on a different level. Clusters have a minimum of three control nodes, to make sure that all components are running. Each component requires a number of instances/PODs. Typically, it is three for control nodes (etcd) and equal to number of nodes for others.
For this guidance, a three-node CE site (pg-sms-1) will be used with the following nodes: pg-sms-1-m0, pg-sms-1-m1, and pg-sms-1-m2. All SiteCLI commands are executed on node pg-sms-1-m0.
Check Health with Console UI
For each site, navigate to its general view dashboard. The important metrics for health of a cluster are sections: System Metrics (expected 100%) and Connectivity (expected two REs connected).
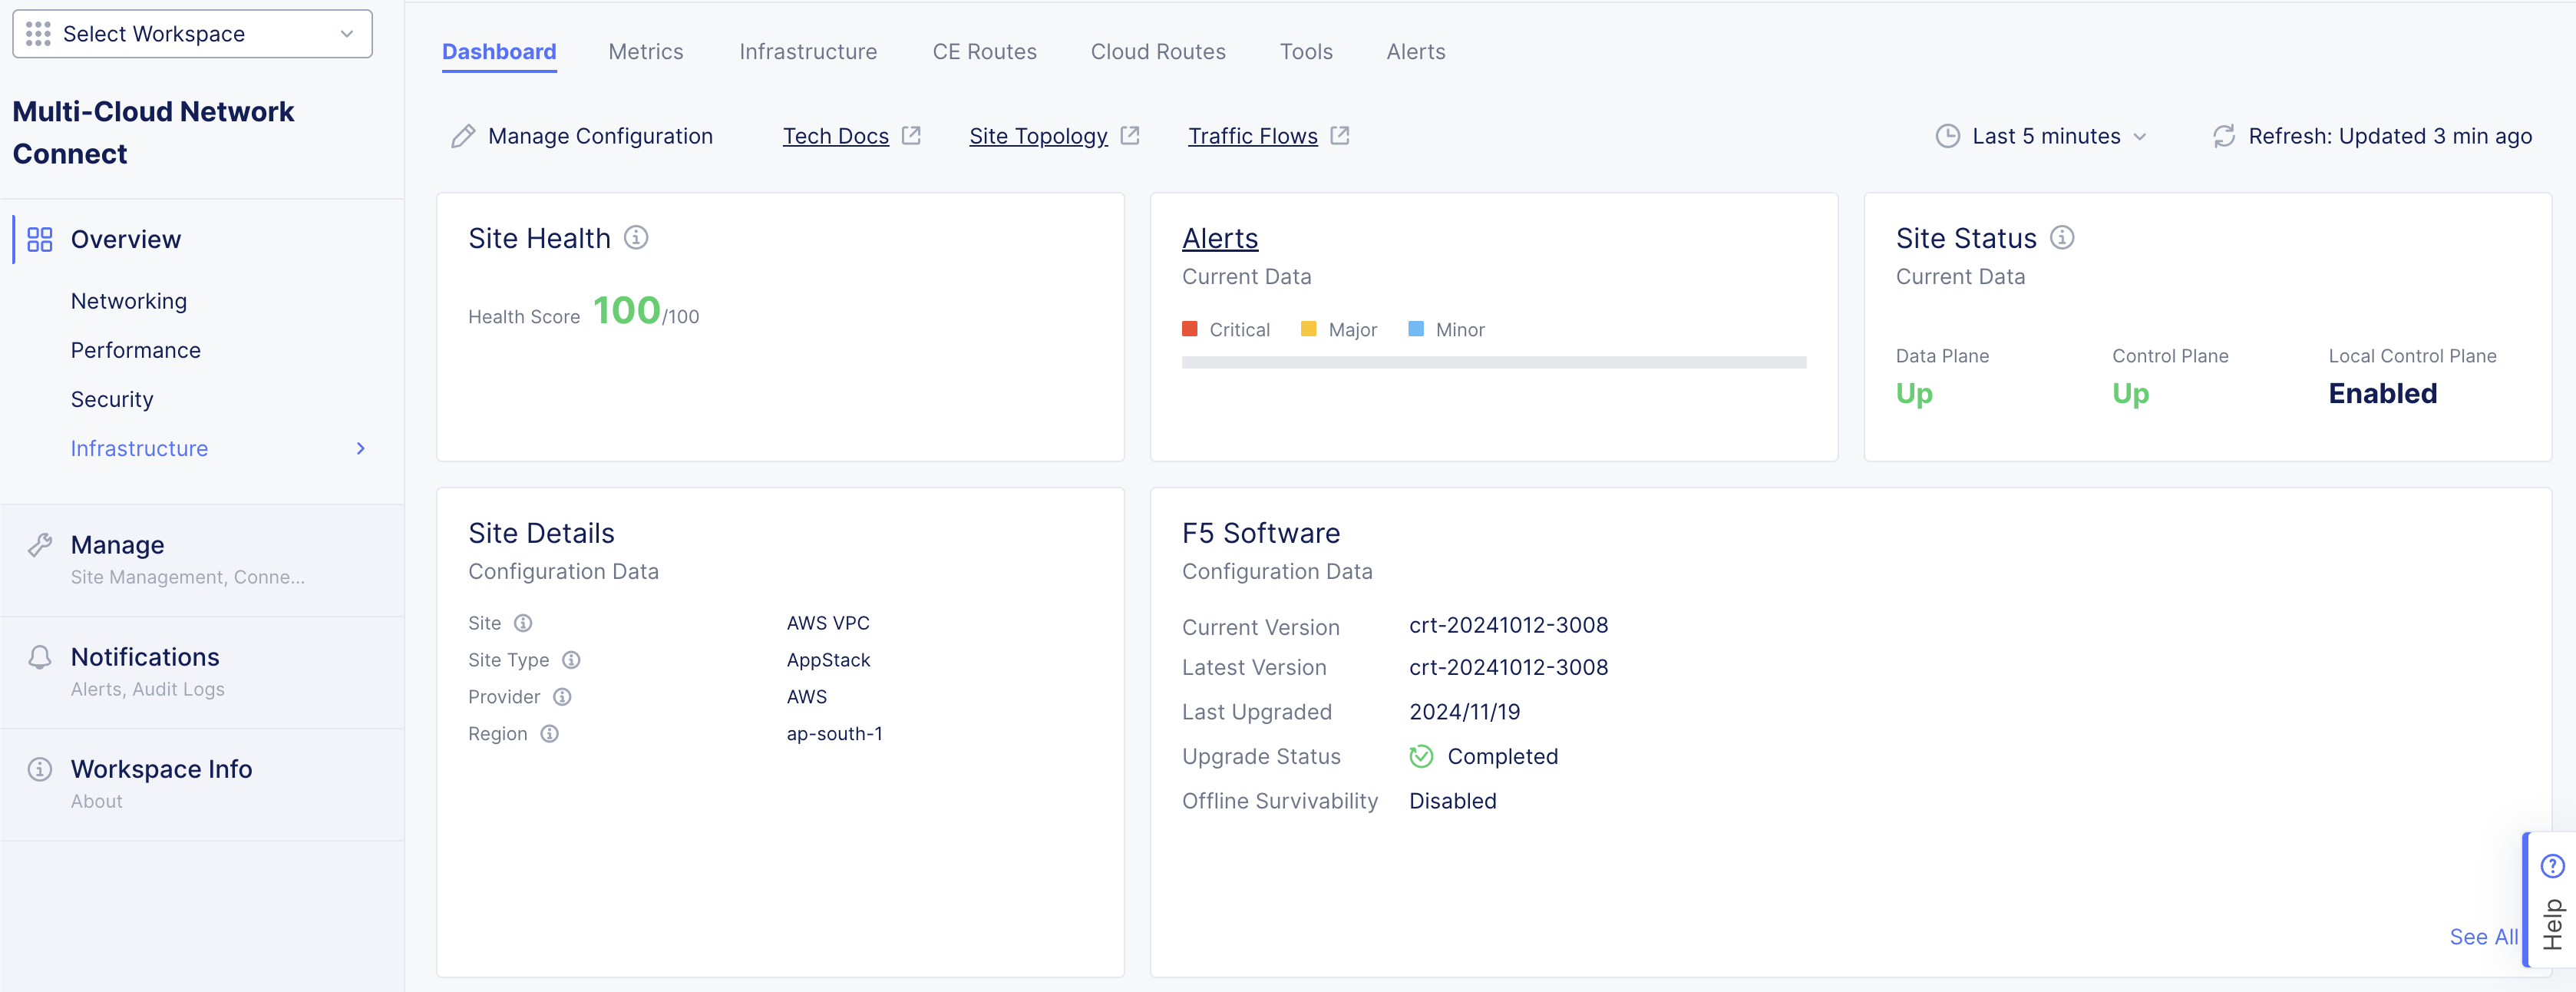
Figure: Site Dashboard
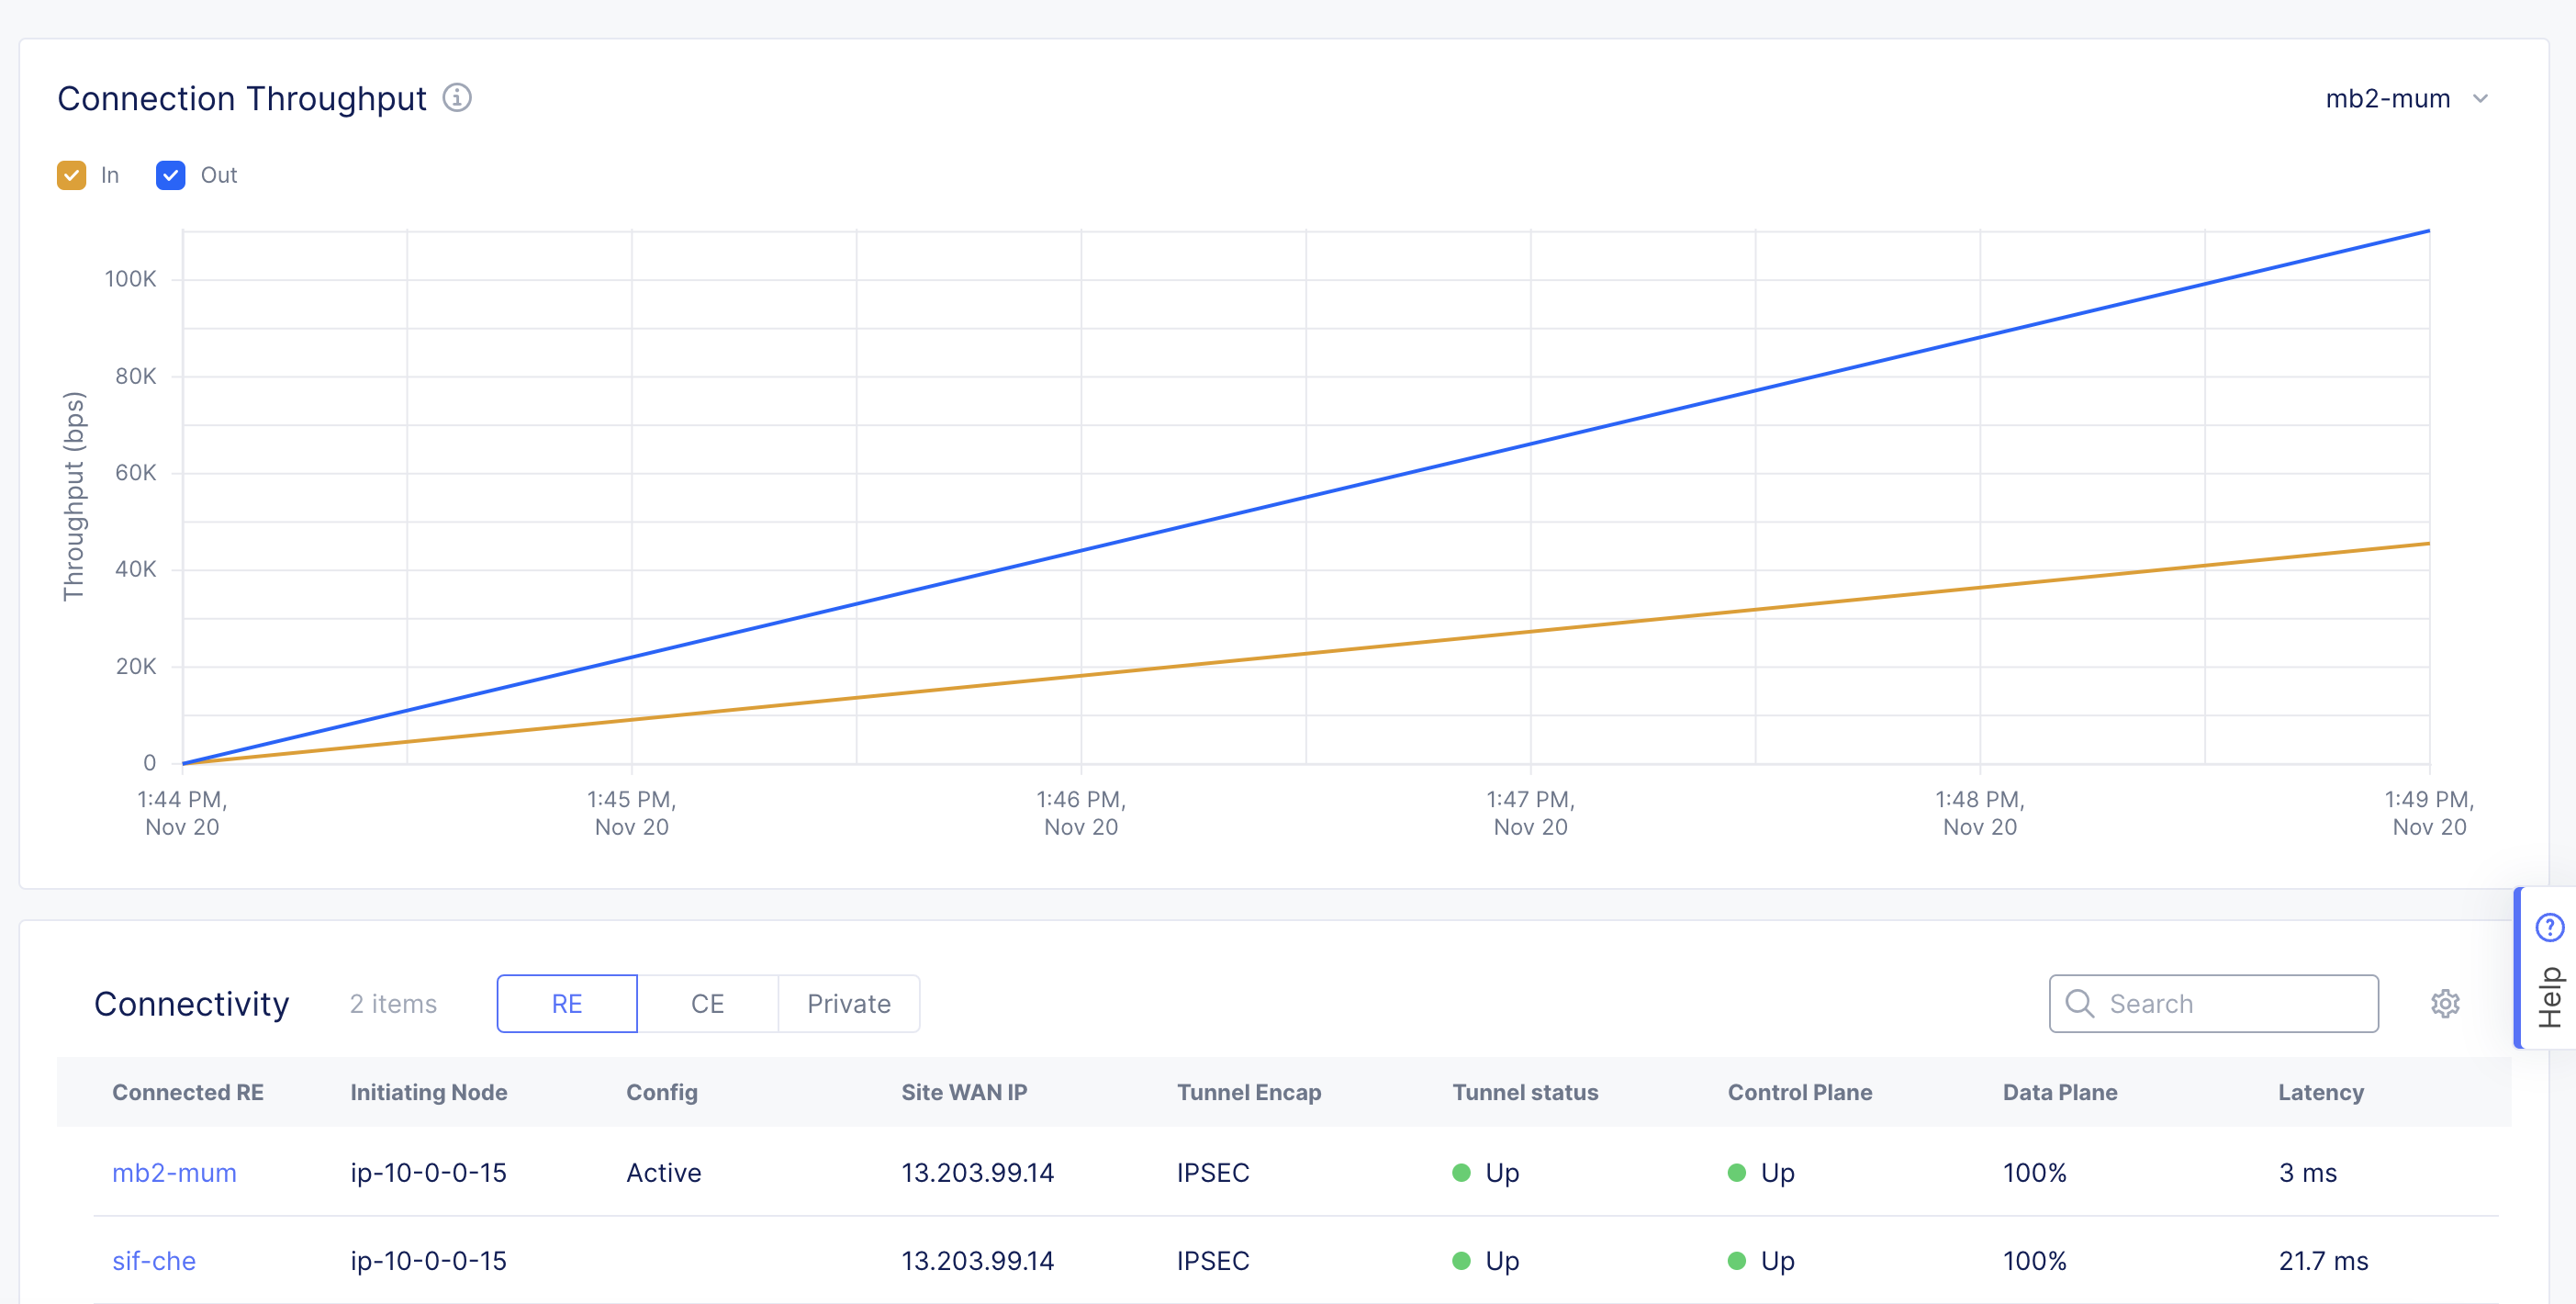
Figure: Site Dashboard
The system health percentage score is calculated using System Health = (tunnel_status * reachability * ares_status * % of nodes that are UP) * multiplier:
- tunnel_status: This is the average of a site's tunnel status to both REs.
- ares_status: This is the average of a site's ares' connectivity status.
- The multiplier depends on RE connectivity status. If both are up, multiplier is 1. If only 1 is up and 1 is down, then multiplier is 0.75. If both are down, multiplier is 0.
Check Health with SiteCLI
There several methods available to check the cluster's health using SiteCLI. One method is to use the health command.
The health command provides cluster-related information (and many others):
- Provisioning state, public IP address, software version, and OS version
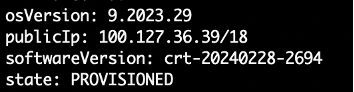
Figure: Cluster Health
- Kubernetes (k8s) cluster state
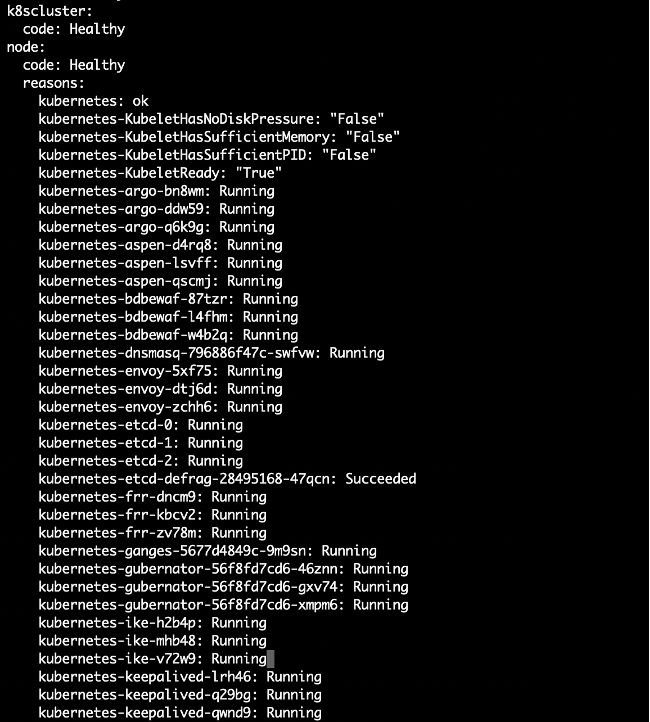
Figure: Cluster Health
- General workload (ves-system) PODs health
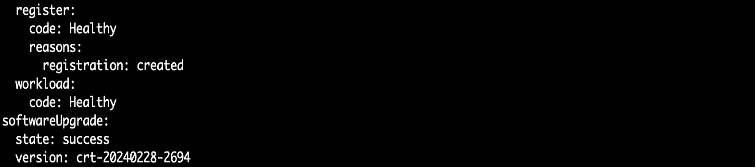
Figure: Cluster Health
To check connectivity to external systems or interface IP addresses, the diagnosis command is a general tool for networking communication validation. This command only works on a deployed CE site (healthy or almost healthy node). The command will not work before a node is properly deployed or for a seriously broken cluster state.
The diagnosis command checks the following information per node:
- External URL service connectivity (repositories, APIs, and more).
- RE registration for each node
- ARP table status
- DNS query to certain domains
- ifconfig command output
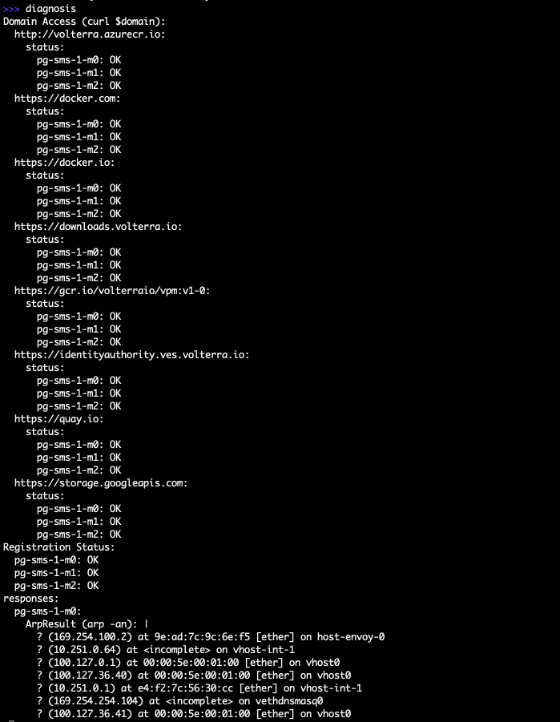
Figure: Cluster Health with Diagnosis Command
Use the volterra-status command to check all PODs/components and their health state. This command prints the PODs status on each node across a cluster. If something is wrong with the POD, it will display a short message. For more information, the POD logs need to be collected. The column name indicates the POD name and can be used to get logs from the POD directly.
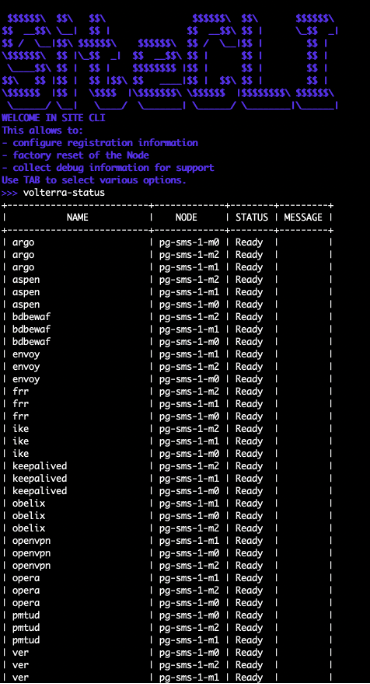
Figure: Cluster Health with volterra-status Command
Use the execcli crictl-ps command to check the POD logs. From the list displayed, find the container ID and then use it to check specific logs. For example, execcli crictl-logs 09c12bb1a5d9a.

Figure: Cluster Health with execcli crictl-ps Command
For App Stack sites, use the kubectl command to check directly cluster health. For this command, you can mainly check the ves-system namespace. To check general node state, use the simple kubectl get nodes command.
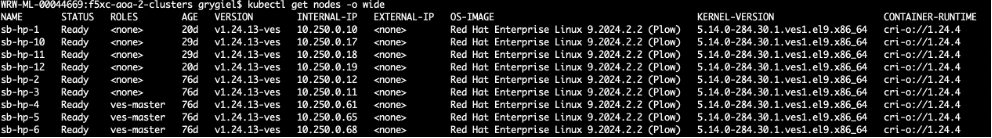
Figure: Cluster Health with kubectl Command
Major Distributed Cloud Services components are executed as daemon set PODs, so the quickest way to see cluster component states across nodes is to use command: kubectl get ds -n ves-system.
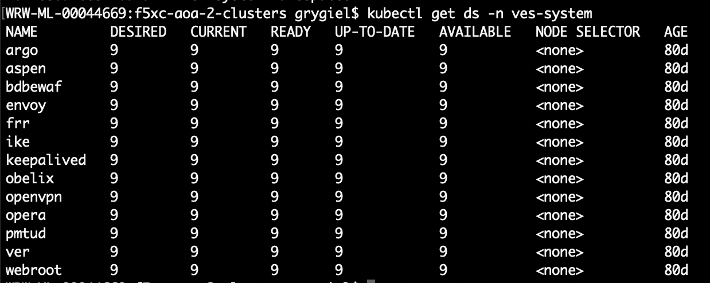
Figure: Cluster Health with kubectl Command
Troubleshoot Control Plane
Control plane issues are mainly caused by a lack of communication with the Global Controllers/REs or inconsistency of their states. Some symptoms of control plane issues include not configuring components (zero configuration) or lack of configuration updates (as in no new configuration applied).
The following sections describe tools to diagnose control plane issues.
Check Vega Objects
Vega (VER) is a control plane component of a CE. Using SiteCLI, you can list all Vega objects and detail values for them. It is raw data of the configuration and in most cases, valuable only for the F5 Distributed Cloud Support Team. Regular users can use this tool to verify if the configuration applied on the Global Controller programs the local CE correctly, and if the CE (etcd communication) works to store the configuration locally.
To list all Vega objects, use the following command: execcli vegactl-configuration-list.
To list all sites in a tenant, use the following command: execcli vegactl-configuration-list ves.io.vega.cfg.site.Object.
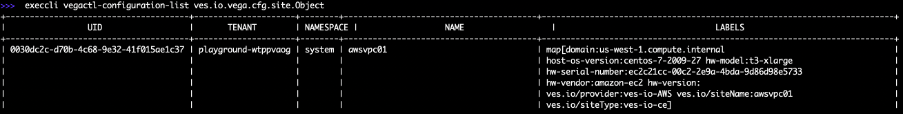
Figure: Check All Sites in Tenant
Use the site unique identifier (UID) to get the site configuration and other object references: execcli vegactl-introspect-get ves.io.vega.cfg.site.Object ff1f98f3-045e-4071-b46c-466675ba3b8c.
See sample output (only the configuration part):
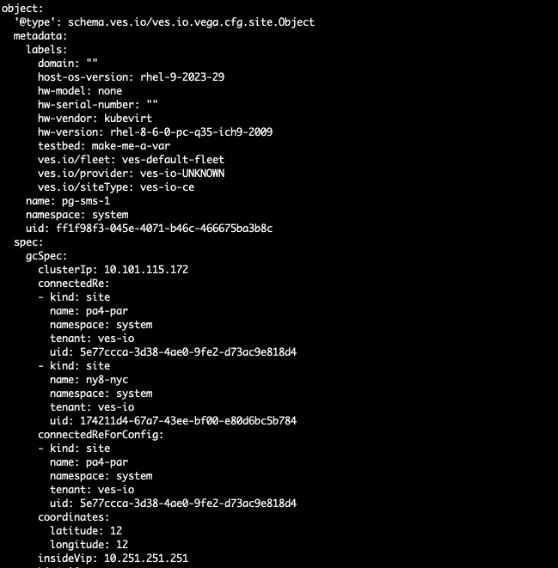
Figure: Check Site UID
Check Envoy Raw Configuration
You can print detailed and low-level configuration information for Envoy that is only usable for the F5 Distributed Cloud Support Team. Regular users can check if the configuration provided on the UI is applied via the Global Controller on the CE site.
To see very detailed configuration information for Envoy, including all internal components where among them there is user load balancer configuration, use command execcli envoy-config-dump. This command provides very large output, with all internal and user data.
To print information for load balancer listeners on a CE site, use command execcli envoy-listeners.
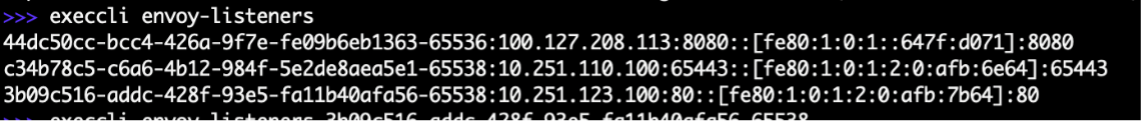
Figure: Check Load Balancer Listeners
To print information for load balancer health check for the CE site, use command execcli envoy-hc-config-dump.
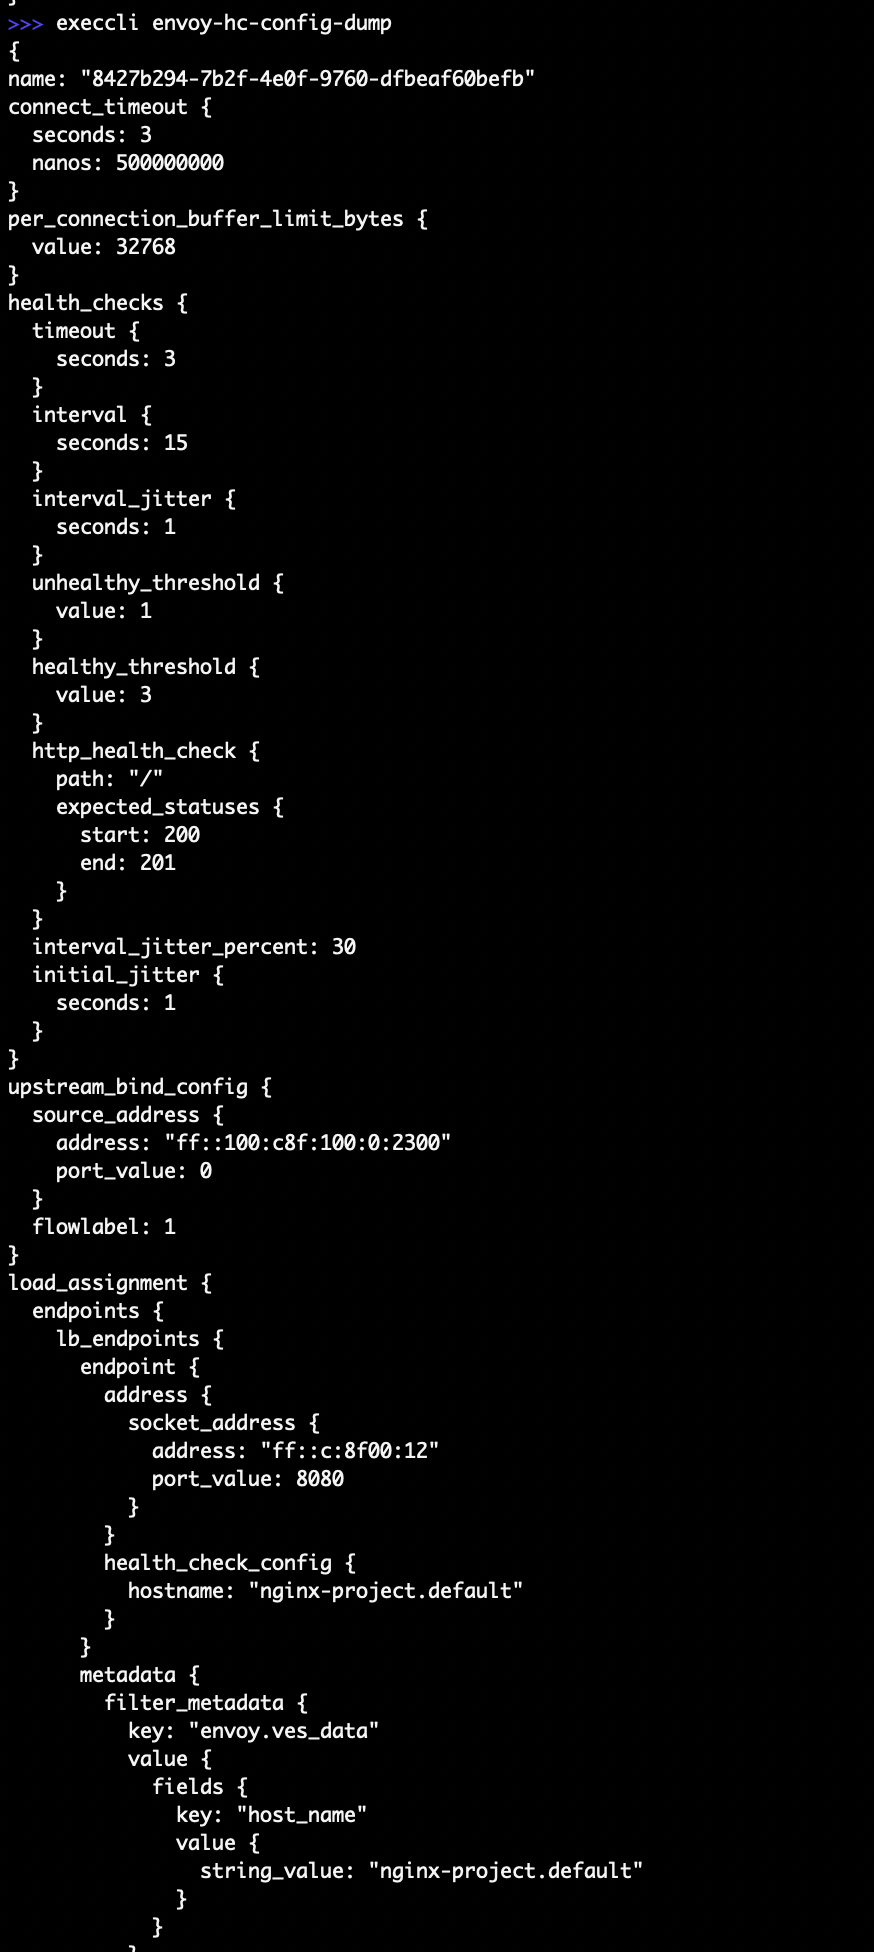
Figure: Raw Envoy Configuration
Check CE to RE Tunnel Status
Communication between a CE site and an RE site is critical due to it being a method to download configuration of the CE site from Global Controllers. The CE site (with one or three-node clusters) establishes two tunnels, where one tunnel is primary and marked as Active. RE tunnels are also used to expose services to the public Internet using load balancer virtual IP addresses (VIPs), to the public Internet on an RE. In the Console UI, tunnel status is well presented, including the load of tunnels.
- To check tunnel status in Console, navigate to your site dashboard and scroll down to the Connectivity section.
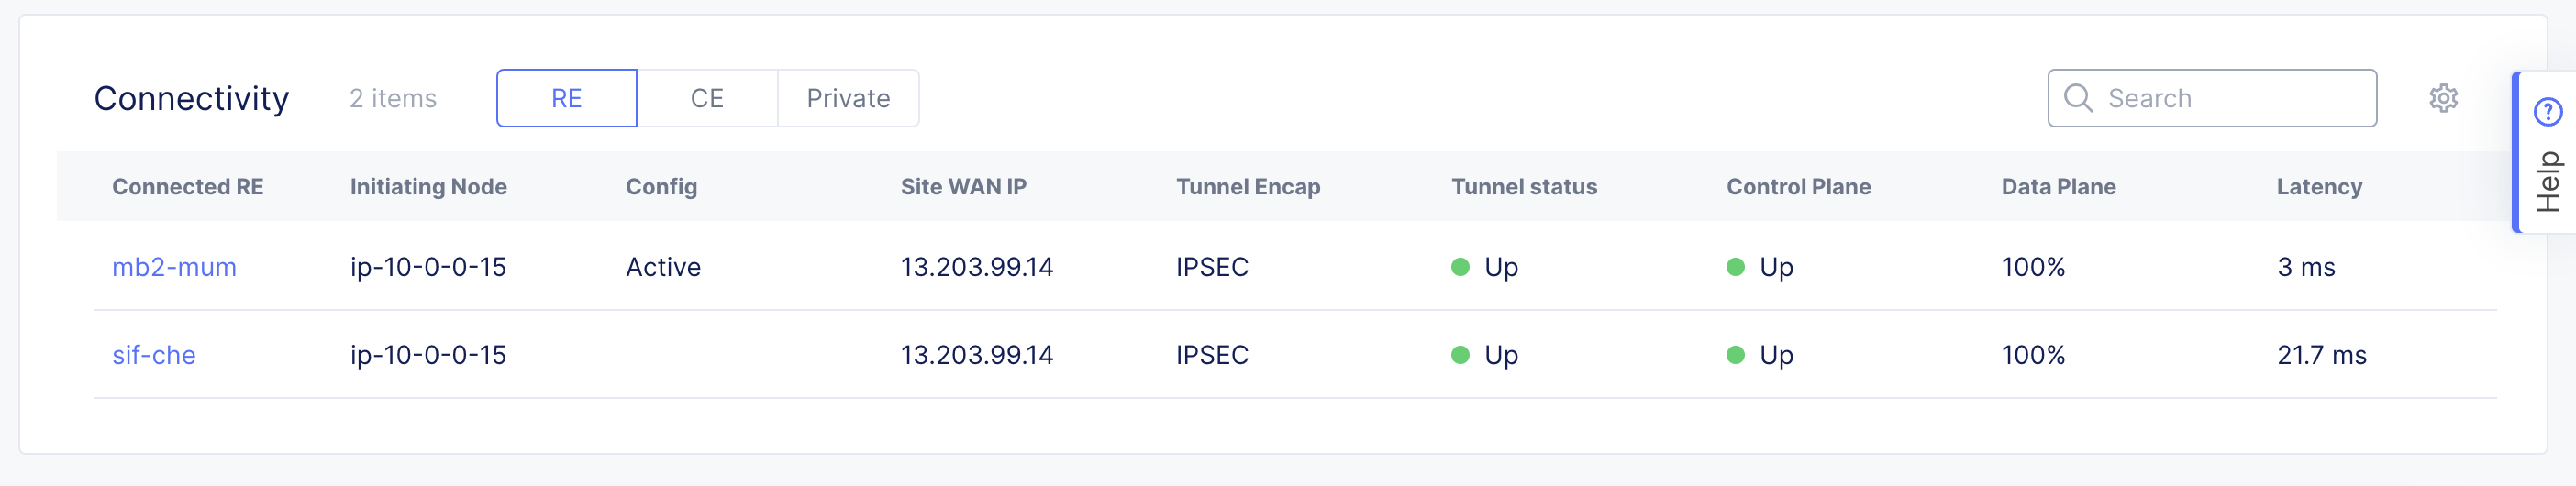
Figure: Check Site Tunnel Health
- To check CE connectivity status in Console, navigate to the site dashboard and select Site Topology. This is a view of CE connectivity to the RE for whole-tenant CEs. Using the filters given, the site can be displayed, including connectivity health, throughput, latency, control plane, and data plane status.
Note: The Console UI displays have some latency to present status and cannot be considered as a live view. To get a more accurate live status, use the SiteCLI terminal.
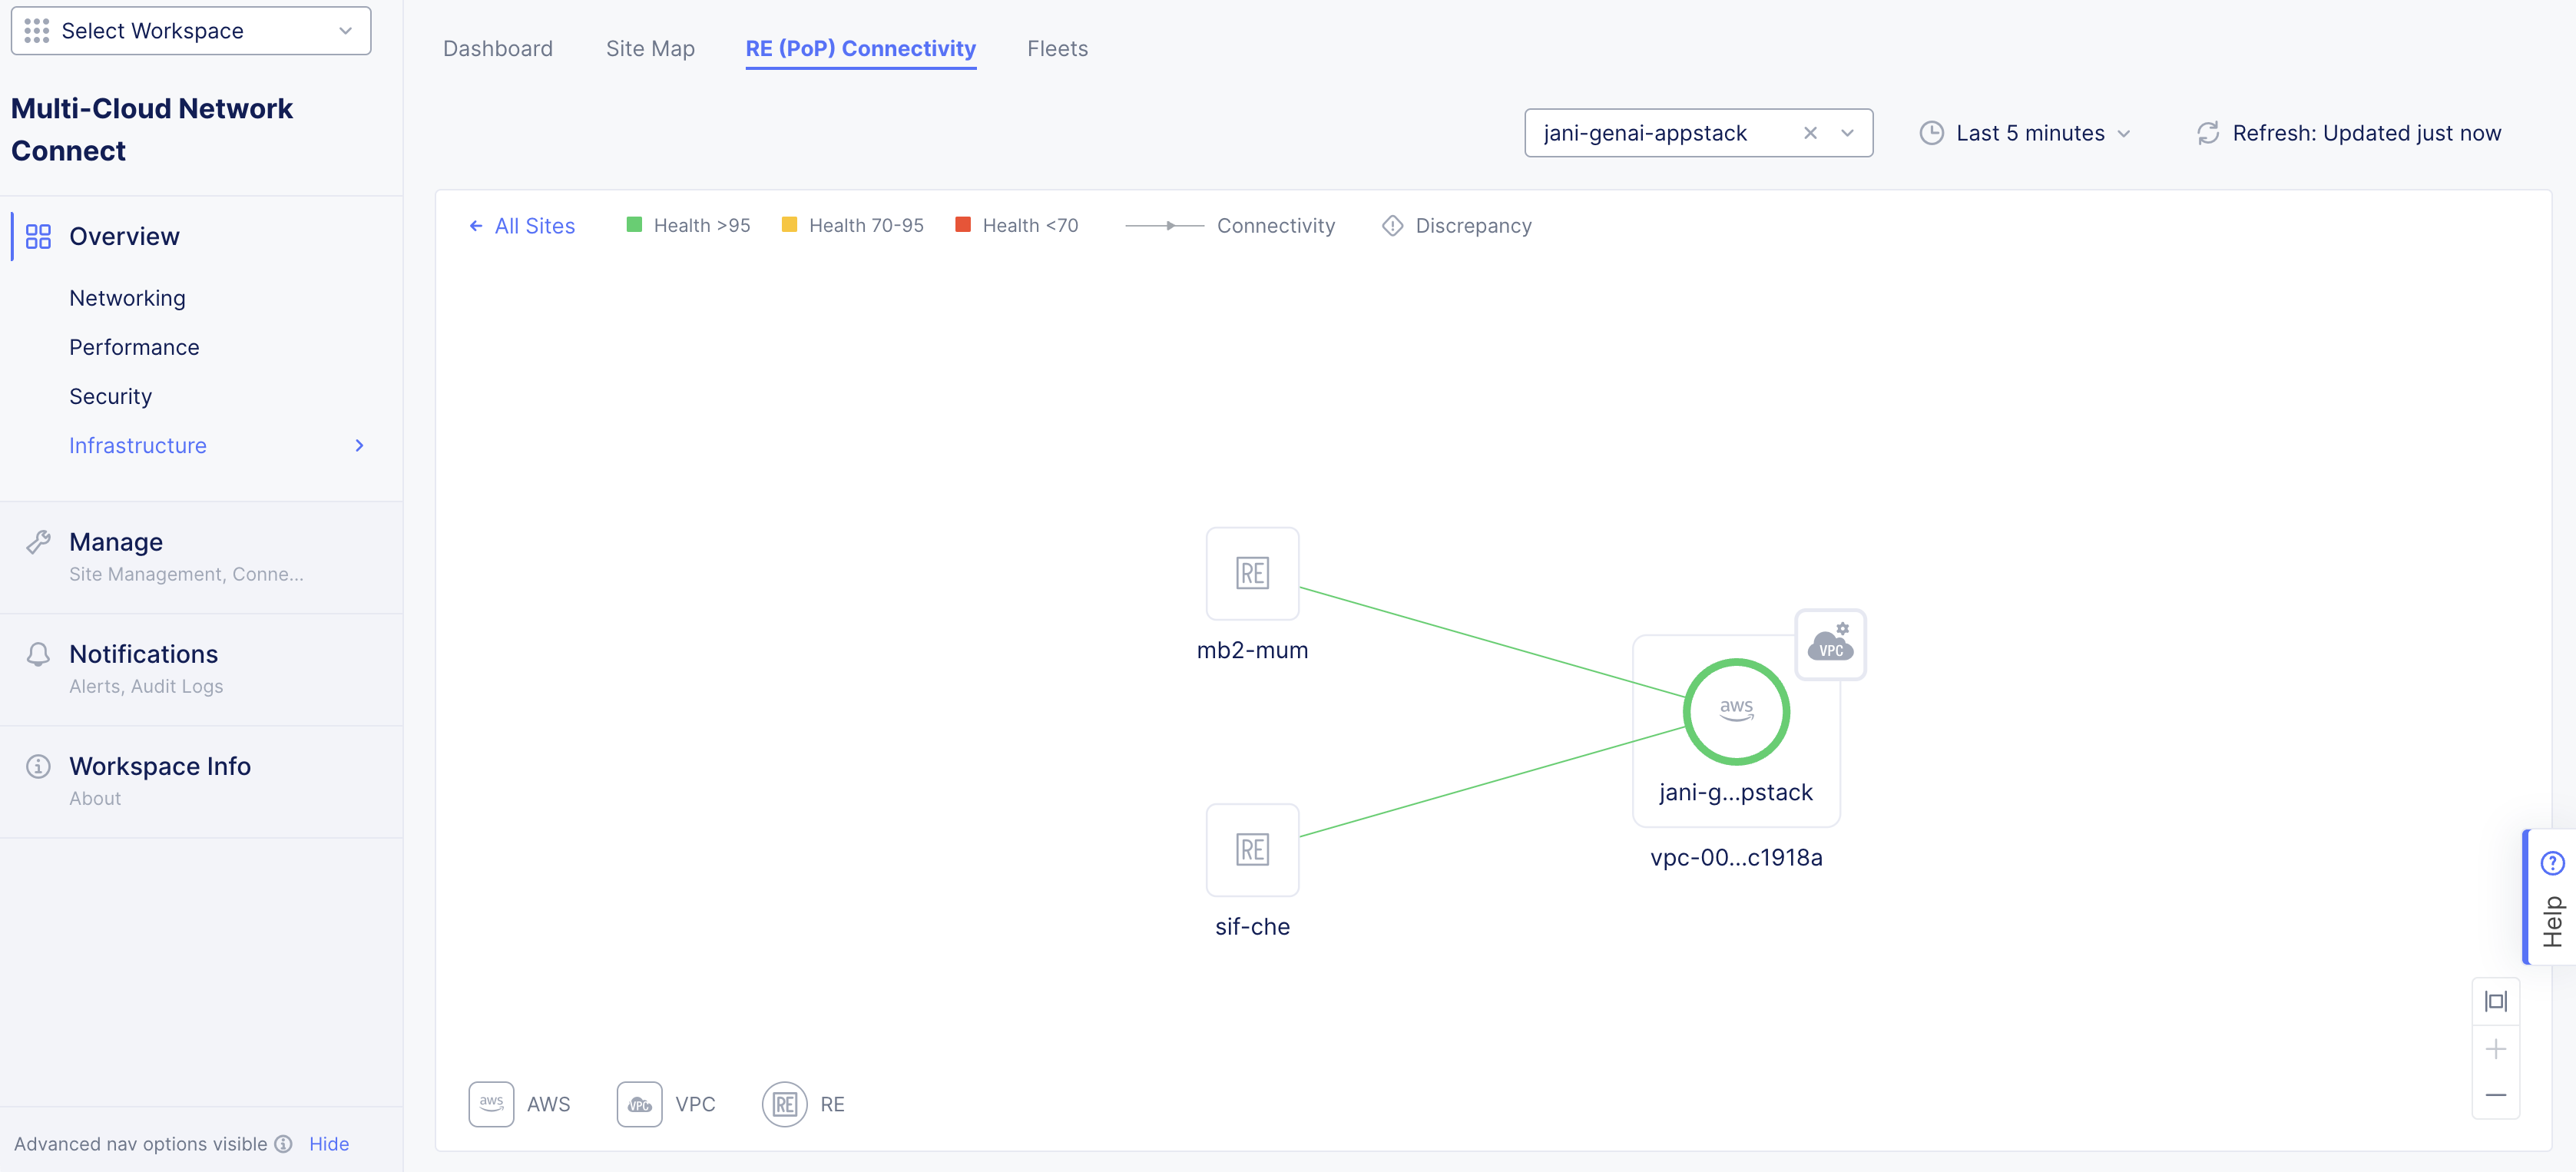
Figure: Check CE Connectivity Status
- To use SiteCLI to view the tunnel status, use command
status ver.
The example below shows that the RE tunnel is SSL to ny8-nyc RE (state: TUNNEL_UP and url:). To see both RE tunnels, check verStatus > siteTunnelStatus > state TUNNEL_UP. It shows two TUNNEL_UP states for ny8-nyc and pa4-par.
In addition, with role: you can observe what initiated the IKE session.
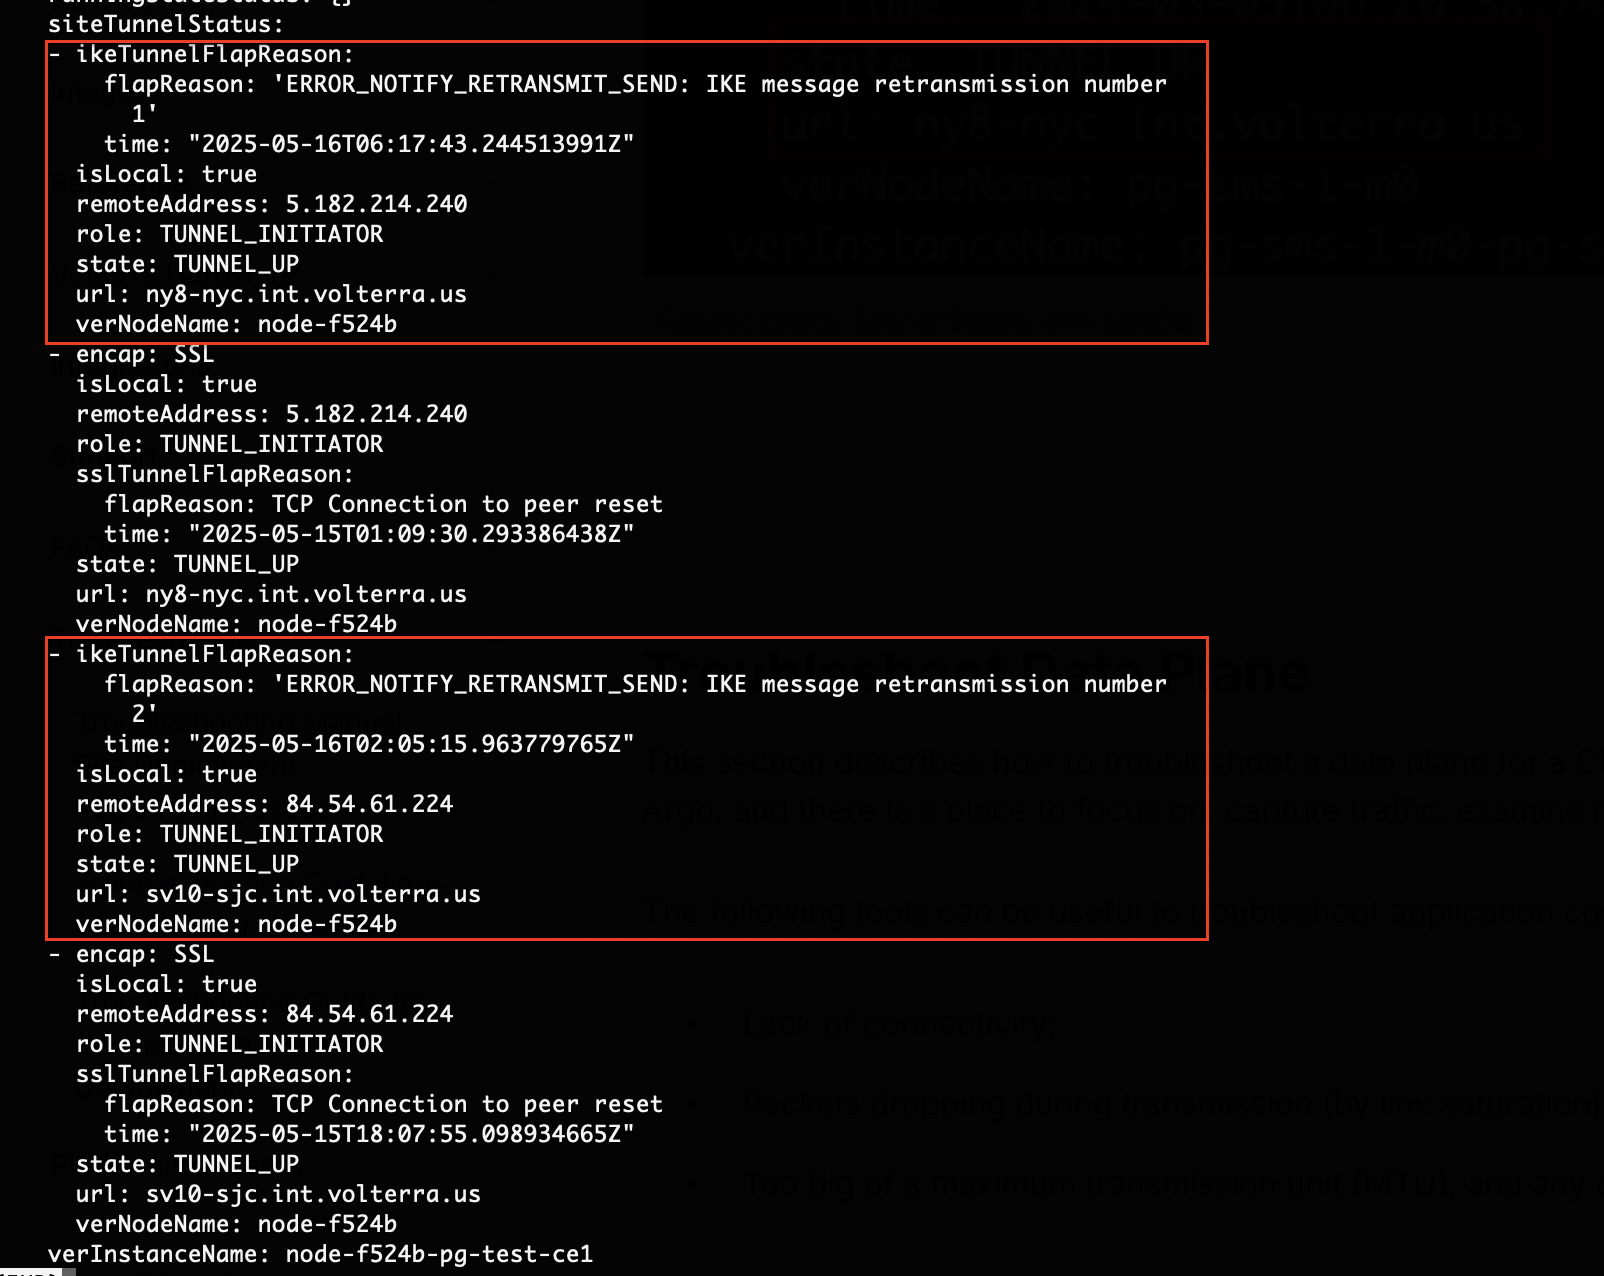
Figure: Check Tunnel Status with SiteCLI
To check the IPsec tunnel status (not SSL), use the execcli ipsec-status command:
 $$$$$$\  $$\   $$\                $$$$$$\  $$\       $$$$$$\$$  __$$\ \__|  $$ |              $$  __$$\ $$ |      \_$$  _|$$ /  \__|$$\ $$$$$$\    $$$$$$\  $$ /  \__|$$ |        $$ |\$$$$$$\  $$ |\_$$  _|  $$  __$$\ $$ |      $$ |        $$ | \____$$\ $$ |  $$ |    $$$$$$$$ |$$ |      $$ |        $$ |$$\   $$ |$$ |  $$ |$$\ $$   ____|$$ |  $$\ $$ |        $$ |\$$$$$$  |$$ |  \$$$$  |\$$$$$$$\ \$$$$$$  |$$$$$$$$\ $$$$$$\ \______/ \__|   \____/  \_______| \______/ \________|\______|WELCOME IN SITE CLIThis allows to:- configure registration information- factory reset of the Node- collect debug information for supportUse TAB to select various options.
>>>>>> execcli ipsec-statusSecurity Associations (2 up, 0 connecting):ver.sv10-sjc.ves-io.4b738a74-2a20-450e-b206-4c3ff48d130e.tenant.int.ves.io[796]: ESTABLISHED 2 hours ago, 172.16.100.205[ver.pg-test-ce1.playground-wtppvaog.939a63d9-ecdb-41f3-9b90-600ea6dc7194.tenant.int.ves.io]...84.54.61.208[ver.sv10-sjc.ves-io.4b738a74-2a20-450e-b206-4c3ff48d130e.tenant.int.ves.io]ver.sv10-sjc.ves-io.4b738a74-2a20-450e-b206-4c3ff48d130e.tenant.int.ves.io{107}:  INSTALLED, TUNNEL, reqid 65539, ESP in UDP SPIs: ffff99e0_i fffff0a0_over.sv10-sjc.ves-io.4b738a74-2a20-450e-b206-4c3ff48d130e.tenant.int.ves.io{107}:   172.16.100.205/32 === 84.54.61.208/32ver.ny8-nyc.ves-io.174211d4-67a7-43ee-bf00-e80d6bc5b784.tenant.int.ves.io[792]: ESTABLISHED 3 hours ago, 172.16.100.205[ver.pg-test-ce1.playground-wtppvaog.939a63d9-ecdb-41f3-9b90-600ea6dc7194.tenant.int.ves.io]...5.182.214.224[ver.ny8-nyc.ves-io.174211d4-67a7-43ee-bf00-e80d6bc5b784.tenant.int.ves.io]ver.ny8-nyc.ves-io.174211d4-67a7-43ee-bf00-e80d6bc5b784.tenant.int.ves.io{106}:  INSTALLED, TUNNEL, reqid 65540, ESP in UDP SPIs: ffffd550_i ffffed90_over.ny8-nyc.ves-io.174211d4-67a7-43ee-bf00-e80d6bc5b784.tenant.int.ves.io{106}:   172.16.100.205/32 === 5.182.214.224/32
Troubleshoot Data Plane
This section describes how to troubleshoot a data plane for a CE site. The main component of the data plane on the CE site is Argo, and there is a place to focus on: capture traffic, examine routing, and examine flow tables.
The following tools can be useful to troubleshoot application connection issues, including:
- Lack of connectivity;
- Packets dropping during transmission (by link saturation);
- Too big of a maximum transmission unit (MTU), and any other related issues.
Capture Packets from a POD (App Stack Site)
Make sure you identify the POD name and node name.
-
In the Console UI, navigate to the Distributed Apps service.
-
Click Managed K8s > Overview.
-
Select the managed K8s cluster, and then click the Pods tab.
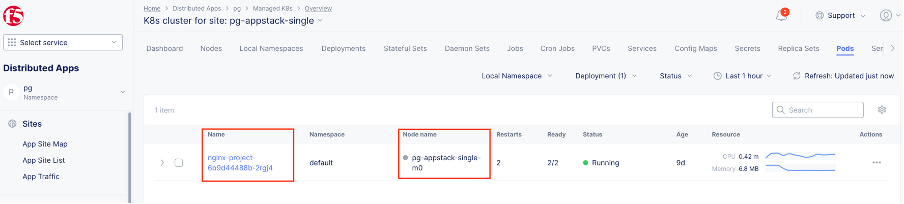
Figure: Get POD Name
- Use the kubectl get pods -n pg command:
NAME READY STATUS RESTARTS AGE IP NODE NOMINATED NODE READINESSnginx-project-6b9d44488b-2rgj4 2/2 Running 2 8d 100.127.0.14 pg-appstack-single-m0 <none> <none>-
To capture network packets in Console UI:
-
Navigate to the tools on your site dashboard by clicking Multi-Cloud Network Connect > Overview > Infrastructure > Sites.
-
Select your site, and the click the Tools tab.
-
Select the Tcpdump tool.
-
Click New tcpdump. A popup window appears.
-
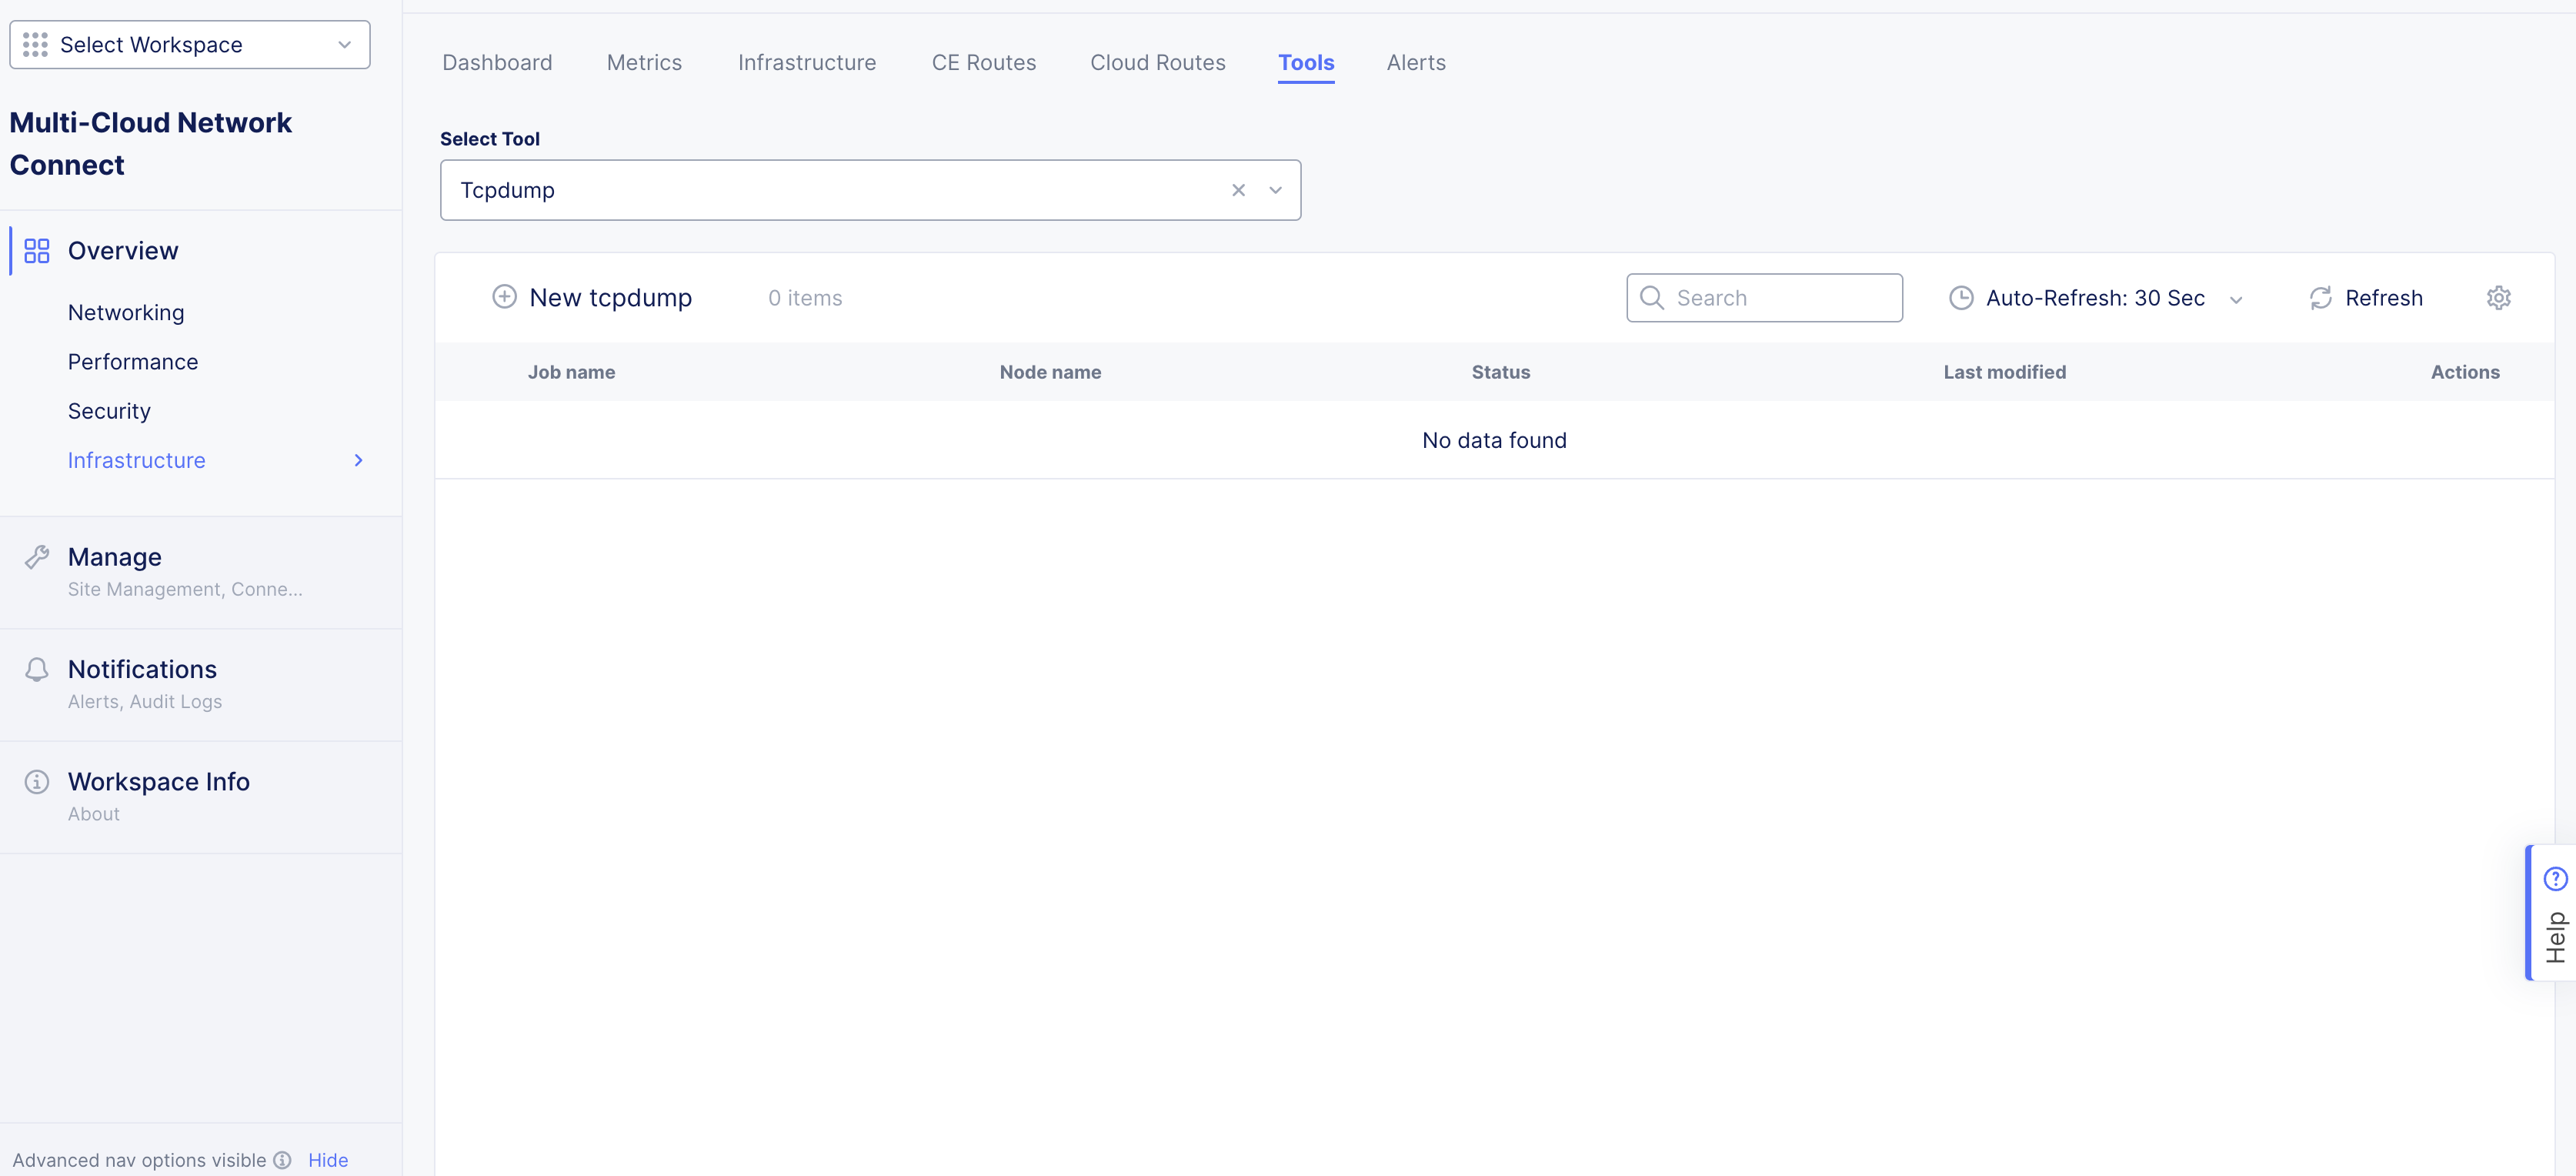
Figure: Tcpdump Tool
-
Select the node name.
-
Select the pod for the Target.
-
Select the pod.
-
Click Start tcpdump.
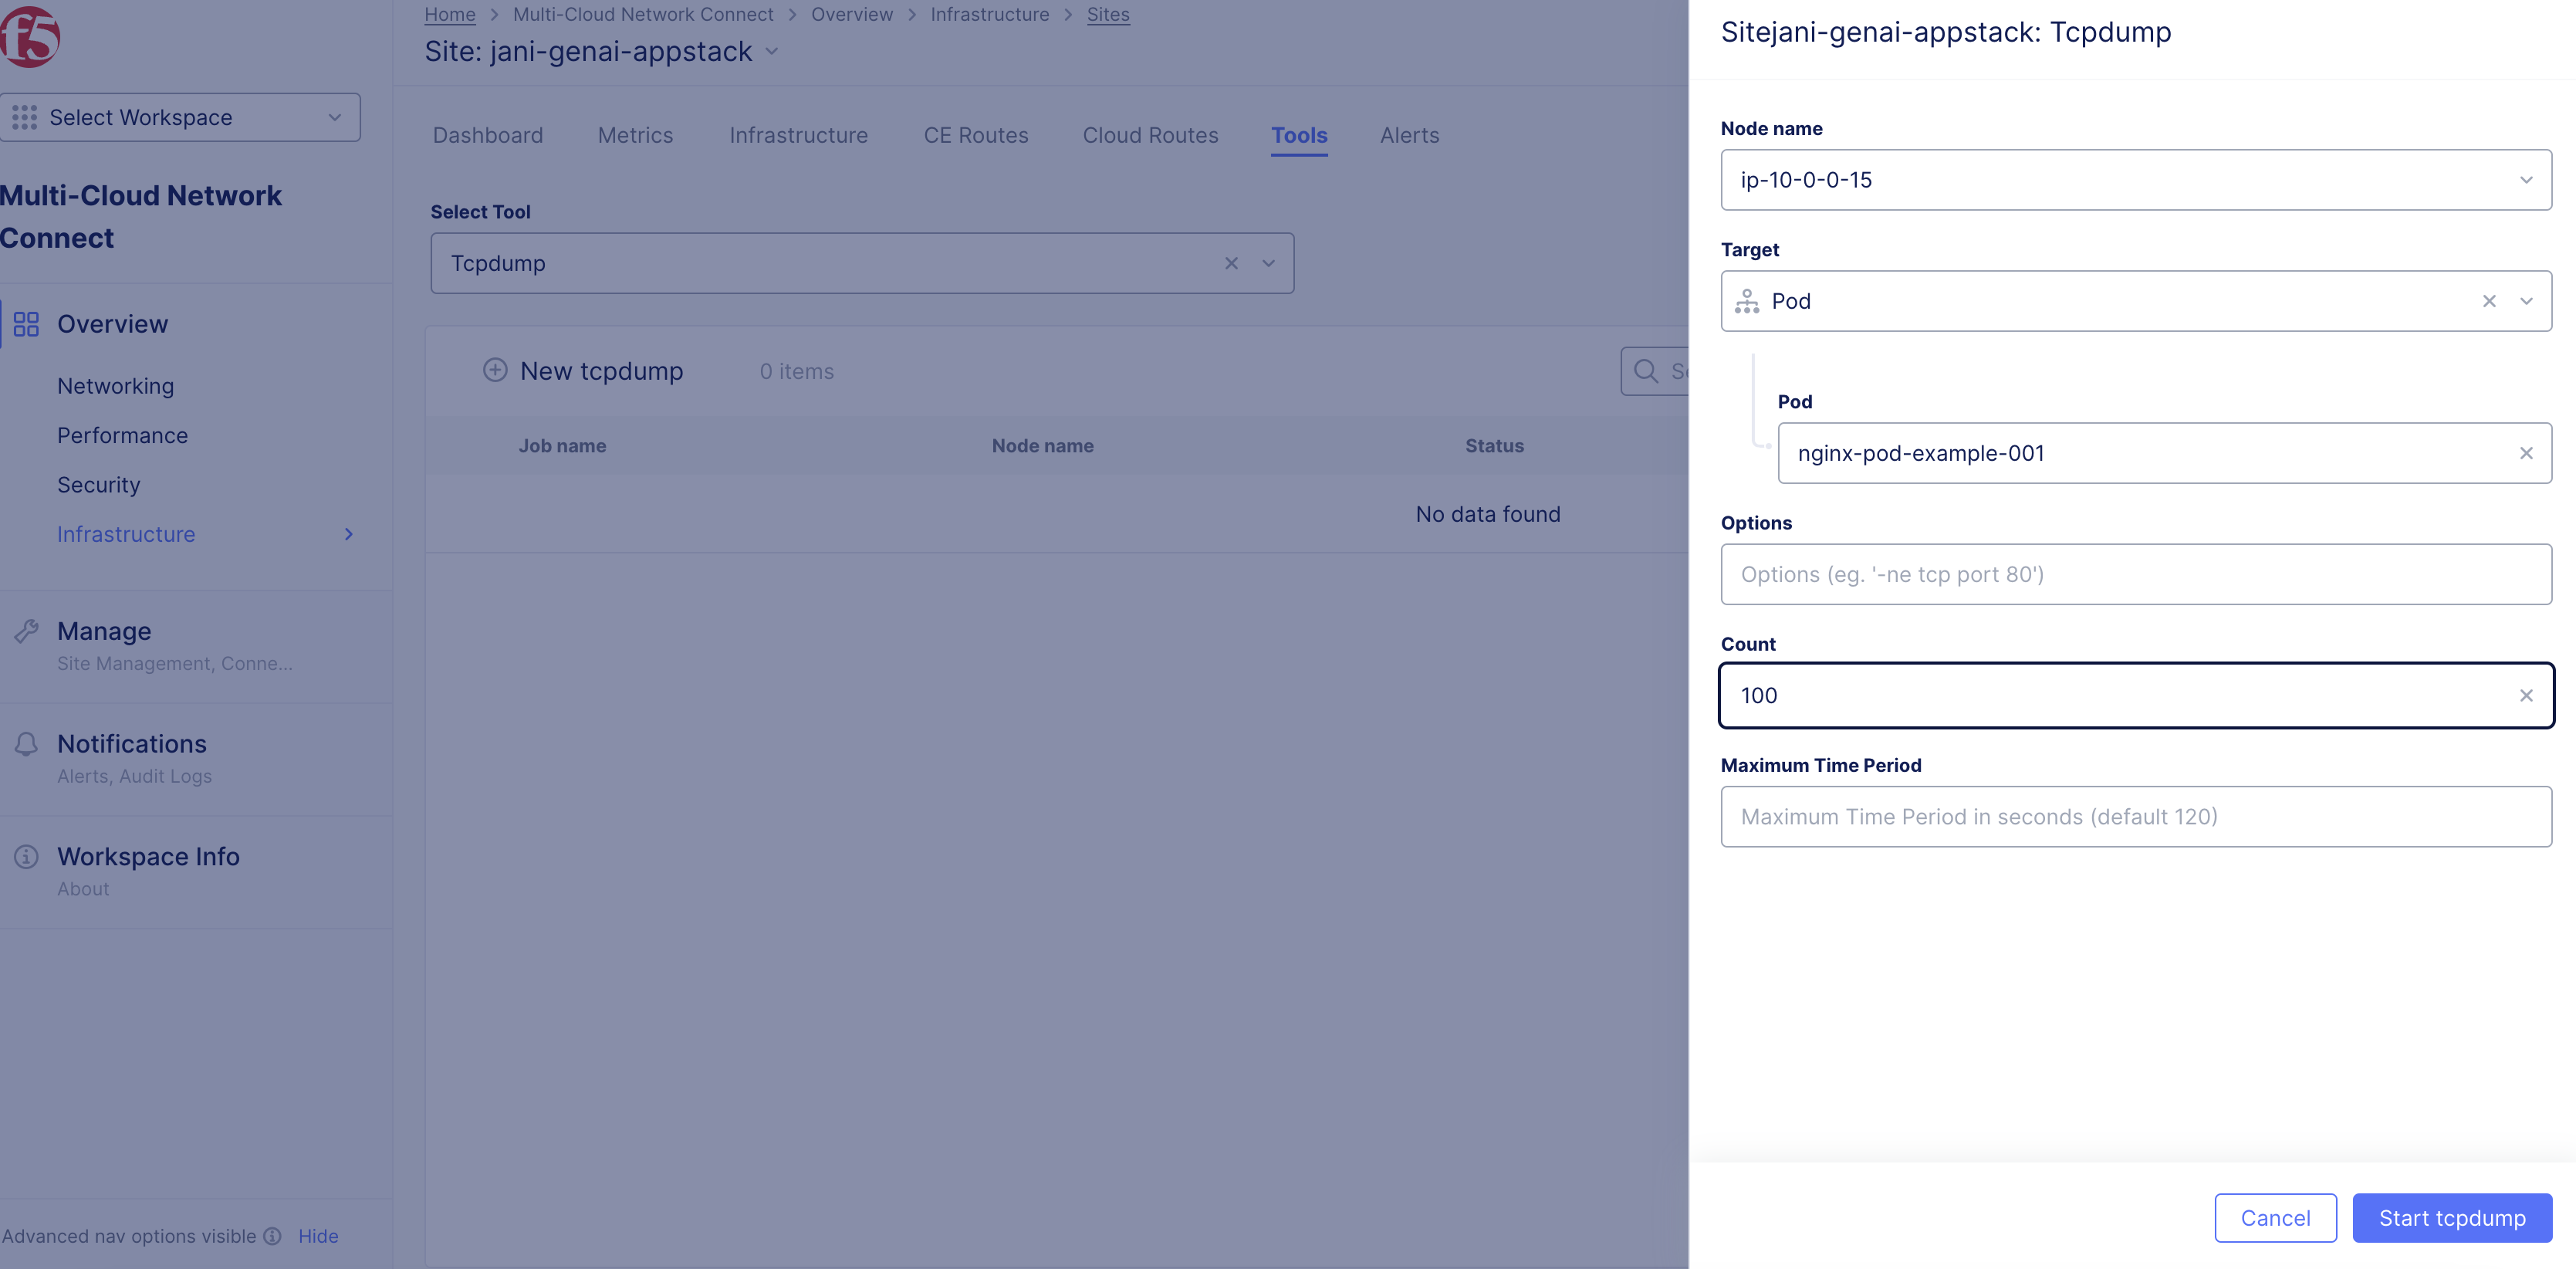
Figure: Tcpdump Tool
- After traffic is captured, download the file locally and open it using Wireshark.
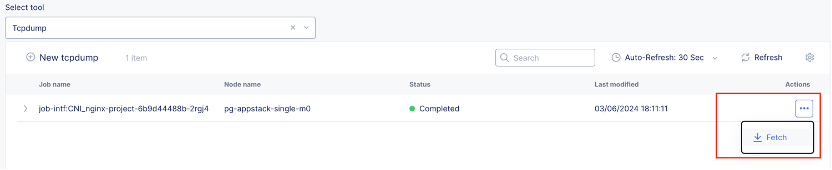
Figure: Download File
-
Use the SiteCLI execcli command for more options to gather information:
- Identify POD interface name by checking the CNI interface name in Vega configuration. As an example, use command execcli vegactl-introspect-dump-table ves.io.vega.cfg.cni.Object. In the output, search for the POD/container name. The next line will be the devName, indicating Argo virtual interface to the POD.
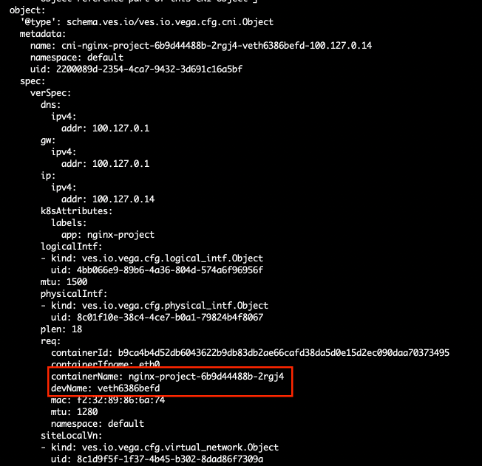
Figure: Identify POD Interface
- Use the interface name list virtual interfaces of Argo to find the interface ID. As an example, use command execcli vif -l. Note that you cannot use the grep command to filter output as it is not supported. Instead, use terminal search to find the interface name.
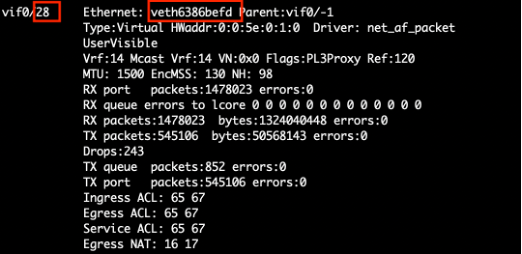
Figure: Identify POD Virtual Interface List
- Use the interface ID to capture packets by the vifdump command. As an example, use command execcli vifdump 28 -ne icmp.
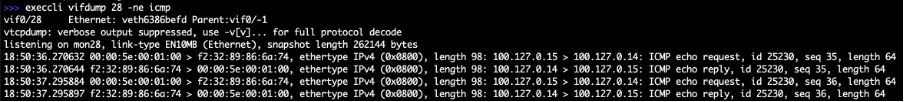
Figure: Interface ID to Capture Packets
Capture Packets from CE to Origin Server (Secure Mesh Site)
Use Case Overview
This scenario involves an application server hosted behind a CE site consisting of three nodes. The objective is to troubleshoot connectivity between the CE cluster and the origin server.
Network Details
- Origin Server (Application): IP address 192.168.200.139.
- Network Segment: The origin server resides in the 192.168.200.0/24 network, which is classified as the red segment.
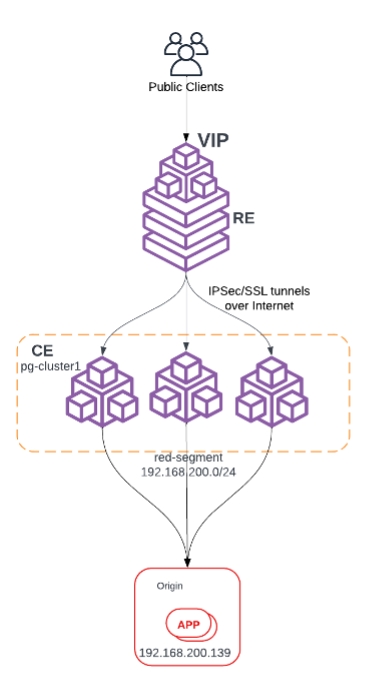
Figure: Use Case Topology
Step 1: Identify interface in the red segment using route table.
To troubleshoot connectivity effectively, it is crucial to first identify the interface associated with the red segment (192.168.200.0/24) on the CE cluster nodes. This can be achieved by verifying the routing table of each CE node.
- Log into the Console UI.
- Navigate to Multi-Cloud Network Connect service.
- From the left-hand menu, go to Overview > Infrastructure > Sites.
- Click Nodes > All nodes.
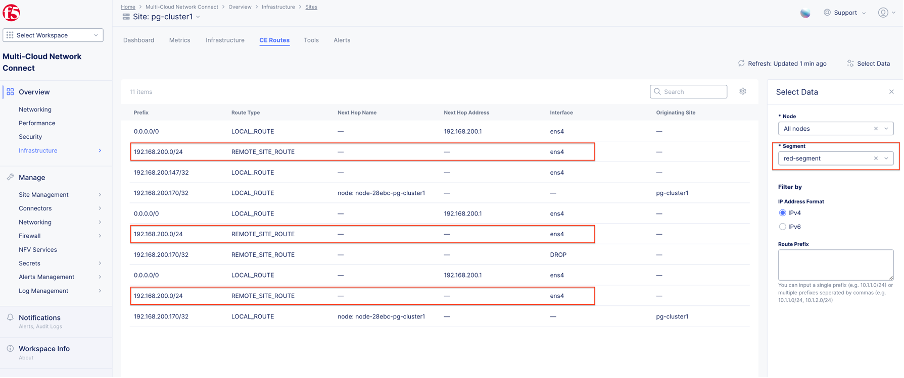
Figure: CE Routing Table
- Confirm the following key details:
- Confirm that the 192.168.200.0/24 network is listed in the routing table.
- Identify the corresponding interface and next hop details associated with the red segment.
- The 192.168.200.0/24 network is always reachable via interface ens4 (seen three times because of three-node cluster).
If you know the outgoing interface (ens4), you can proceed with further steps to troubleshoot, like using the tcpdump command (in the UI) to capture traffic.
Step 2: Capture packets with tcpdump.
-
In Console, navigate to the Multi-Cloud Network Connect service.
-
From the left-hand menu, go to Overview > Infrastructure > Sites.
-
Select your site.
-
Navigate to the Tools tab and, from the available tools, select Tcpdump.
-
Click New tcpdump.
-
Configure packet capture details:
- Node selection: Choose one of the CE nodes where packet capture is to be performed.
- Interface selection: Input the interface identified from the CE routes output. For example, ens4.
- Options (not mandatory): Specify filters to target traffic of interest, such as packets to/from the application server (192.168.200.139) or specific ports used by the application.
- Count (default 512 packets): Number of packets.
- Maximum Time Period: Default is 120 seconds.
-
Click Start tcpdump.
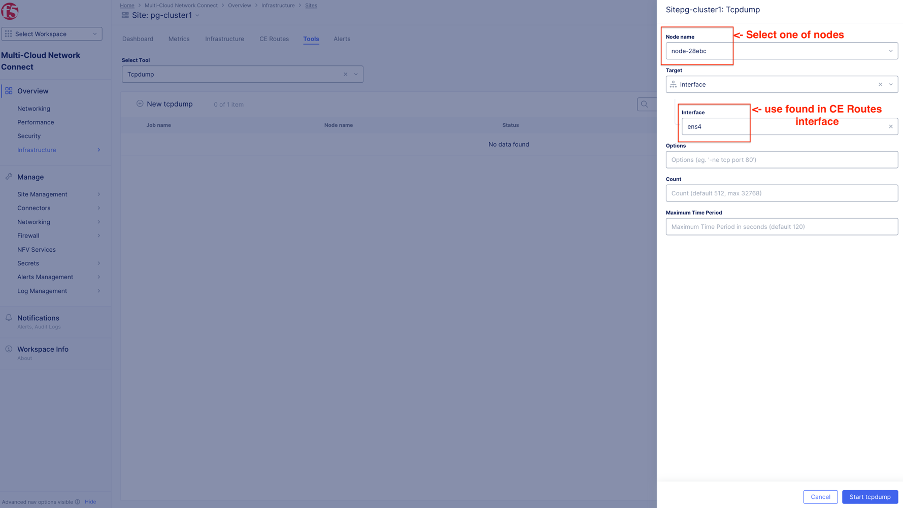
Figure: Configure Command
- After the process completes, download the output file.
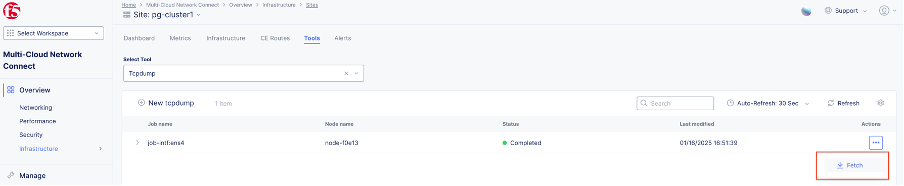
Figure: Download Output of Command
Step 3: Open file in Wireshark.
Use the Wireshark application to open the downloaded output file.
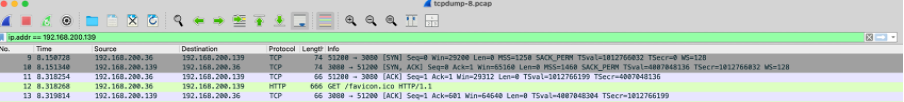
Figure: Wireshark
As the origin server performs SNAT in the output traffic with CE interface in red segment, it will be seen as source (192.168.200.36) and origin server as destination (192.168.200.139).
On this page:
- Objective
- F5 Distributed Cloud Services Components and Architecture
- Components
- Prerequisites
- Troubleshooting Tools
- UI Tools
- SiteCLI
- Site Web UI
- Collect Diagnostic Information
- Troubleshoot Provisioning States
- Registration Process Workflow
- Troubleshoot VPM
- VPM Status Check
- Restart VPM
- VPM Logs Check
- Common VPM Log Errors
- Check Cluster Health
- Check Health with Console UI
- Check Health with SiteCLI
- Troubleshoot Control Plane
- Check Vega Objects
- Check Envoy Raw Configuration
- Check CE to RE Tunnel Status
- Troubleshoot Data Plane
- Capture Packets from a POD (App Stack Site)
- Capture Packets from CE to Origin Server (Secure Mesh Site)