Early Access Node Site CLI Reference
Objective
Specific Customer Edge (CE) serviceability tools, like the debug log bundle and Site CLI Commands, will be available as Early Access within the site's Tools tab (Multi-Cloud Network Connect > Overview > Infrastructure > Sites) with the September 24, 2024, release.
Prerequisites
-
Ensure that the CE Site is running the September 24, 2024, release or higher.
-
Ensure that the user is part of the following API groups:
| User Role | Requirement |
|---|---|
| F5xc-site-management-standard-user | Read-only Site CLI commands. |
| F5xc-site-management-monitor-user | Debug log bundle |
| F5xc-site-management-standard-admin | Read/write Site CLI commands. |
Debug log bundle
The Debug log bundle command includes all the diagnostic information to help F5 Technical Support investigate the root cause of an issue. Before this early access, this debug log bundle was only available to collect on a node-by-node basis. Customers had to identify the node in question and then navigate to the UI or SSH to the node to collect this information. With the Debug log bundle early access, customers can now collect a support bundle collection across all the nodes, or select nodes in a site directly from the Console without the need to identify the node IP addresses and connect to them on a node-by-node basis.

Figure: Debug log bundle
Site CLI Commands
Site CLI Commands allow you to debug and troubleshoot network issues, view forward state of the CE nodes, view BGP route information exchanged with external BGP endpoints, and run familiar Linux utility tools (like ip and netstat) directly from the Site Console to improve CE Site serviceability.
This functionality is available on a per-node basis as mode serviceability commands. You must log in to each node individually to run the commands. With this feature, a select set of commands are now directly available from Distributed Cloud Services Console, simplifying CE serviceability needs.
As part of Early Access, a select few commands are made available for you, with a plan to expose a broader set of commands for General Availability (GA) in the future.
Here is a list of commands that are now available as part of the Early Access that you can run directly from the Distributed Cloud Services Console by selecting a node from a site:
Network Troubleshooting Commands
IPsec Tunnel
- Tunnel status commands: These commands can be executed to collect detailed status of the IPsec tunnels established between a Customer Edge and Regional Edges.
ipsec-statusipsec-statusall
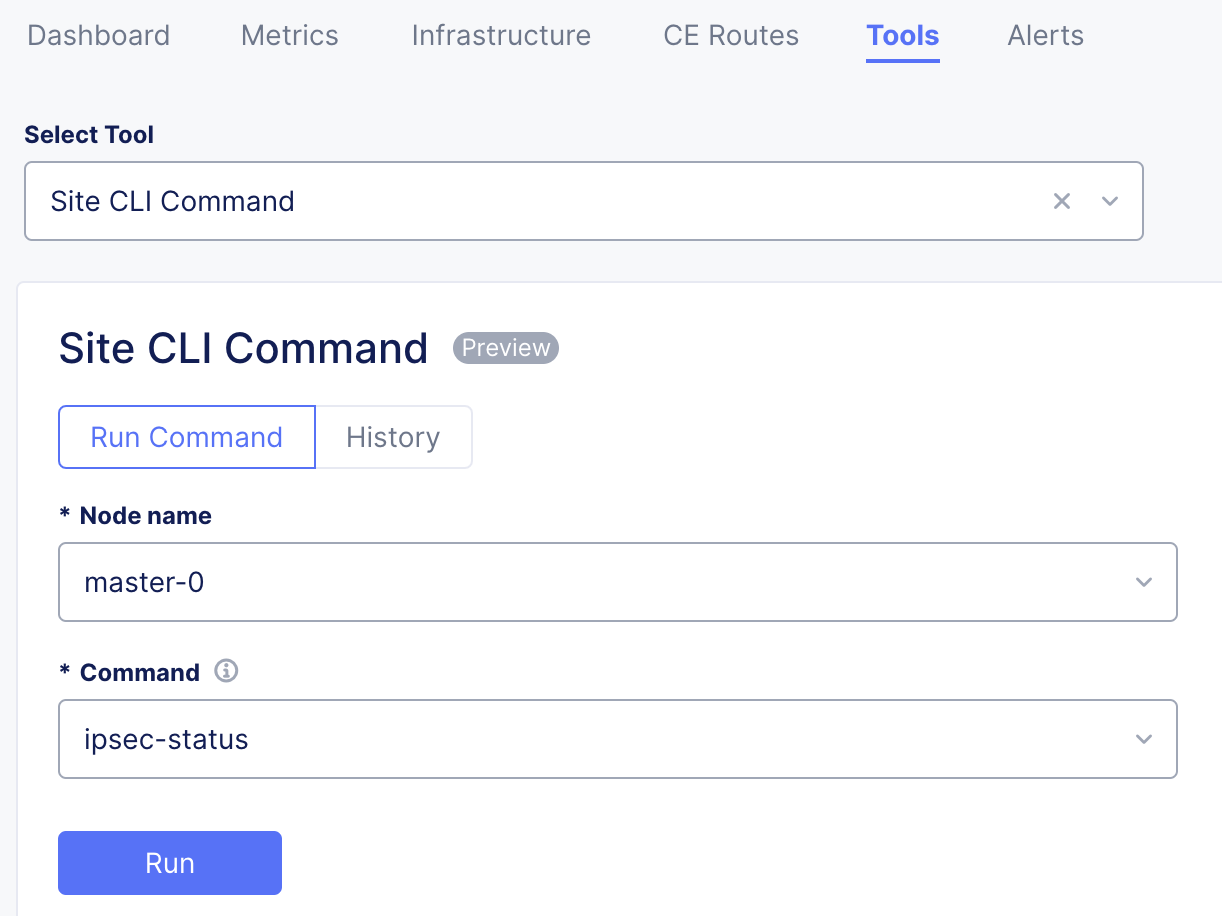
Figure: Command
Sample output:

Figure: Command Output
Output interpretation:
For a given node, ipsec-status and ipsec-statusall list out all IPsec tunnel associations and endpoints.
NTP Sources
-
Network connectivity commands: Standard Linux
ipandnetstatutility commands can check L2/L3 network state and connections of CE interfaces. -
chronyc-sources: Displays the status of all NTP time sources.
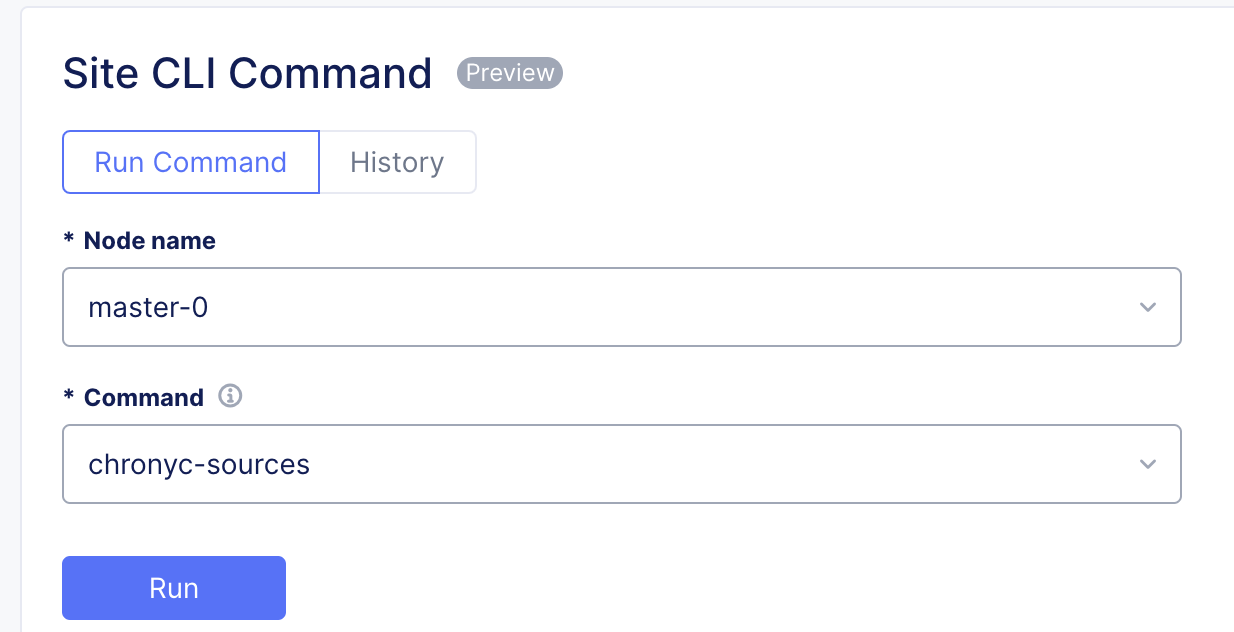
Figure: Command
Sample output:

Figure: Command Output
Output interpretation:
For a given node, chronyc-sources lists out all NTP sources and time synchronization status.
Network Statistics
netstat: Information about network connections.

Figure: Command
Sample output:

Figure: Command Output
Output interpretation:
The output is similar to the netstat Linux utility. For a given CE node, the output lists all the active TCP/UDP connections, among other things.
IP Addresses and Links
ipcommand options include:<link>: Information about network interfaces.addr: Information about network interfaces.route: Node route information.neighbor: IP neighbor information.ip-link-show: Information about all the virtual interfaces of the node forwarding state.

Figure: Command
Sample output:

Figure: Command Output
Output interpretation:
The output is similar to the Linux ip utility. The ip link command output includes all the ip link layer information for all IP links for a given node.
Curl
CE site reachability to external F5 cloud endpoints: These commands can be used from the node (host) or from a system container, like Vega, to check reachability and domain resolution. This is especially useful as you check reachability to F5 published public domains needed for healthy CE Site operation:
curl-host: Command options include-v <host-name>. For example, gcr.io or cloud.f5.com.curl-vega: Command options include-v <host-name>. For example, gcr.io or cloud.f5.com.

Figure: Command
Sample output:

Figure: Command Output
Output interpretation:
The command outputs the status of the curl response from the node/host perspective, while the curl-vega command outputs the same from the CE system software standpoint. These reachability checks help ensure DNS resolution and verify HTTP connectivity to domains of interest.
Network connections from the CE Site nodes can be verified by running the familiar netstat utility against any of the nodes in a site.
Forward State
Forward state commands: The CE Site node's forwarding state, such as active flows (flow-l), route (rt), next hop (nh) information, and drops statistics (dropstats) can provide a plethora of information to help troubleshoot connectivity issues in a self-service manner.
See below for details of each of the commands in sequence and how to interpret the output to help aid with the troubleshooting as well as feed the next command inputs based on the previous command output.
flow-l: Dumps the entire flow table for all flows seen by the node across all interfaces and route tables.

Figure: Command
Sample output:

Figure: Command Output
Output interpretation:
Above is a snipped output of the flow-l command output showing a flow with a source IP port of 10.1.20.10:3503 with destination IP port of 10.1.20.4:18093. Additionally, Proto(V) indicates that this is a TCP flow (protocol 6), and it belongs to VRF 9. Armed with VRF information, you can get additional information about the next hop for a given route using rt commands.
flow-l-match: Dumps the exact match flow entry from the CE node's forwarding state.

Figure: Command
Sample output:

Figure: Command Output
Output interpretation:
For a given IP and port combination, as an input from the user, the matching flow information is provided as a response and the corresponding information, such as VRF, flow index, and more.
Route
rt: Route commands:<--dump> <VRF>: Dumps the entire route table for a given VRF for IPv4 (inet) family.<--dump> <VRF> <--family inet6>: Dumps the entire route table for a given VRF for IPv6 (inet6) family.<--get> <route> <--family inet> <--vrf> <vrf-id>

Figure: Command
Sample output:

Figure: Command Output
Output interpretation:
The output above is a snipped output of rt command output showing a flow with a source IP port of 10.1.20.10:3503 with destination IP port of 10.1.20.4:18093. Additionally, Proto(V) indicates that this is a TCP flow (protocol 6), and it belongs to VRF 9. Armed with VRF information, you can get additional information about the next hop for a given route.
Next Hop
nh: Next Hop (NH) commands:< --list>: Lists all the next hops programmed on the nodes.<--get> <nh-id>

Figure: Command
Sample output:
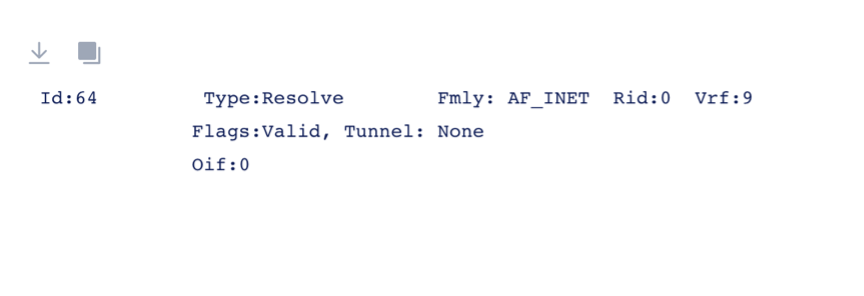
Figure: Command Output
Output interpretation:
The command output above indicates that it is a "resolve" type next hop, and the outgoing interface ID is indicated where the traffic will egress.
Virtual Interface
vifcommands:<--list>: List all virtual interfaces (VIF) on the node part of the SDN routing stack.

Figure: Command
Sample output:
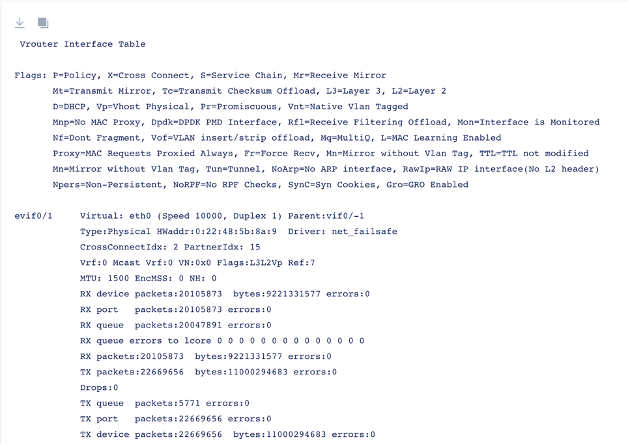
Figure: Command Output
Output interpretation:
The command above lists out all the virtual interfaces on the node part of the SDN routing stack. Each of the interfaces has information around L2 address information and statistics. As seen in the sample output above, there is information about the parent interface, TX and RX statistics, and VRF this VIF belongs to.
Dropped Packet Statistics
dropstats-non-zero: List of all non-zero counter stats key of the forwarding state.
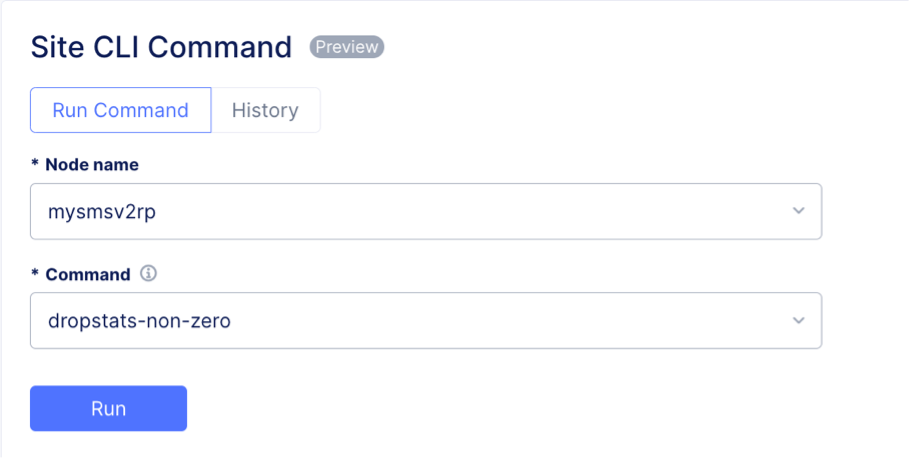
Figure: Command
Sample output:

Figure: Command Output
Output interpretation:
The non-zero counter statistics show dropped packet statistics and the counter against which the packets were dropped.
dropstats: List of all counter statistics key of the forwarding state.

Figure: Command
Sample output:

Figure: Command Output
Output interpretation:
Output represents packet forwarding state packet drop statistics against each of the categories. The output is similar to dropstats-non-zero, except that it presents all counters (both zero and non-zero).
BGP
BGP Commands: CE Site nodes establish BGP sessions toward external BGP speakers for L3 reachability toward external destinations, origins, and more. The following commands can be run to check BGP state information:
show-ip-bgpshow-ip-bgp-neighborsshow-ip-bgp-advertised-routeshow-ip-bgp-summary
System Troubleshooting Commands
F5 Distributed Cloud Services Customer Edge (CE) is a Kubernetes-based integrated software stack, which is managed centrally via the SaaS Console and can be instantiated in any of the customer environments – public clouds, on-premises data centers, remote branches, or even at the edge. Customer Edge software running on the CE nodes can run self-diagnosis on the overall system health, reachability to endpoints for health operations, and more. System Troubleshooting commands allow customers to review the system’s self-diagnosis information using health and diagnosis commands.
Customer Edge software running on the CE nodes can be invoked to run a self-diagnosis of the system. This can be done by running health or diagnosis Site CLI commands.
Health
health: No command options available.

Figure: Command
Sample output:

Figure: Command Output
Output interpretation:
The health command provides an overall summary of the Customer Edge site registration state with F5 SaaS platform, an inventory of discovered resource information, like CPU, memory, network, and more.
Diagnosis
diagnosis: No command options available.
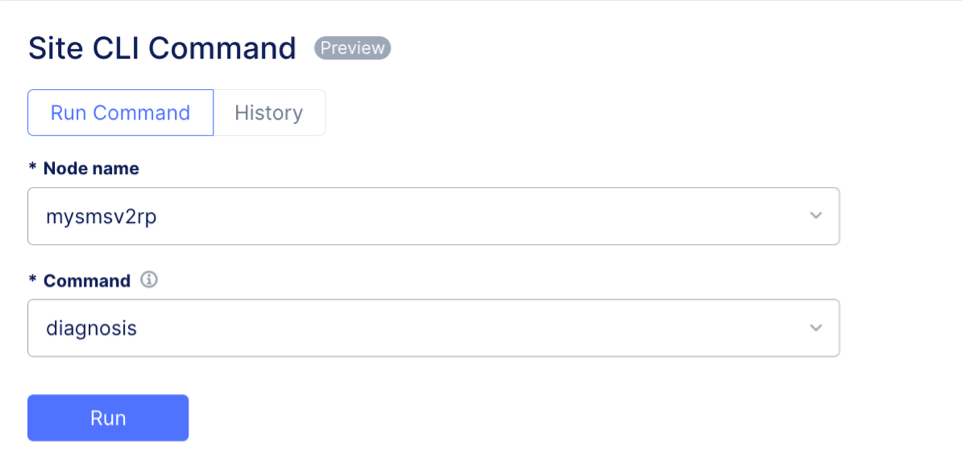
Figure: Command
Sample output:

Figure: Command Output
Output interpretation:
The diagnosis command collects detailed health checks on the overall system state, health state of all the services in the system, reachability and domain resolution checks for public endpoints that are needed for healthy operation of customer edges.
System Services Health
F5 Distributed Cloud Services Customer Edge (CE) is a Kubernetes-based integrated software services stack. The following commands can be run to fetch detailed information about the container images for the container runtime, specific resource (for example, pod, container, or image), and list of all containers managed by the container runtime or container logs.
These are advanced pieces of information that F5 support teams may ask customers to collect in certain scenarios.
crictl-images: No command options available.docker-images: No command options available.

Figure: Command
Sample output:

Figure: Command Output
Output interpretation:
The command output provides detailed information about a specific resource (for example, a pod, container, or image) managed by the container runtime.
crictl-ps: No command options available.crictl-ps-a: No command options available.docker-ps: No command options available.docker-ps-a: No command options available.

Figure: Command
Sample output:

Figure: Command Output
Output interpretation:
The ps outputs all running containers, while the ps-a command lists all containers running and stopped or exited containers. Capture the container ID from the output to inspect details of the container using either crictl-inspect or docker-inspect.
crictl-inspect: The option<container-id>provides information about a specific container ID.docker-inspect: The option<container-id>provides information about a specific container ID.

Figure: Command
Sample output:

Figure: Command Output
Output interpretation:
Outputs detailed information about a specific resource (for example, pod, container, or image) in JSON format.
crictl-logs: The option<container-id>provides information about a specific container ID for which logs need to be retrieved.docker-logs: The option<container-id>provides information about a specific container ID for which logs need to be retrieved.

Figure: Command
Sample output:

Figure: Command Output
Output interpretation:
Given a container ID, this command retrieves logs from a specific container managed by the container runtime.
journalctl: The command option includes <-u> <service-name> <-n> <number-of-lines>.

Figure: Command
Sample output:

Figure: Command Output
Output interpretation:
For a given service, the log information is printed with specified number lines to aid in troubleshooting system service-related errors.
Known Caveats
Debug log bundle collection is not supported for CE sites running as pos(s) on k8s sites.
On this page:
- Objective
- Prerequisites
- Debug log bundle
- Site CLI Commands
- Network Troubleshooting Commands
- IPsec Tunnel
- NTP Sources
- Network Statistics
- IP Addresses and Links
- Curl
- Forward State
- Route
- Next Hop
- Virtual Interface
- Dropped Packet Statistics
- BGP
- System Troubleshooting Commands
- Health
- Diagnosis
- System Services Health
- Known Caveats