Monitor Cloud Connects
Objective
This document provides instructions on how to monitor your Cloud Connects. Cloud Connect is a cloud-neutral approach to enable you to attach your private cloud network onto F5 Distributed Cloud Platform's cloud customer edge (CE) sites.
Using the instructions provided in this document, you will be able to observe your Cloud Connects in various ways, such as how many you have, their statuses, any alerts against them, and various measures of data transfer through them.
Prerequisites
- An F5 Distributed Cloud Account. If you do not have an account, see Getting Started with Console.
- One or more applications deployed on F5 Distributed Cloud sites or network. If you do not have applications deployed, see vK8s Deployment.
- An HTTP load balancer with one or more security features enabled. If you do not have an HTTP load balancer, see Create HTTP Load Balancer. See App Security and Advanced Security for information on enabling various security features.
Monitor All Cloud Connects
In the Multi-Cloud Network Connect workspace, select Overview > Infrastructure > Cloud Connects to get started. This page defaults to the Dashboard, which provides a global view of your Cloud Connects. Alternatively, you can view a map of your Customer Edges (CEs) on the Customer Edge Map tab, or you can select the VPC Inventory tab to discover VPCs and onboard them to a Cloud Connect. For details on how to create Cloud Connects, see Create Cloud Connect.
Cloud Connect Dashboard
The Cloud Connects dashboard looks at all of your Cloud Connects in aggregate and provides an overview of your inventory, statuses, and alerts as well as various data transfer statistics. At the bottom is a list of all your Cloud Connects.
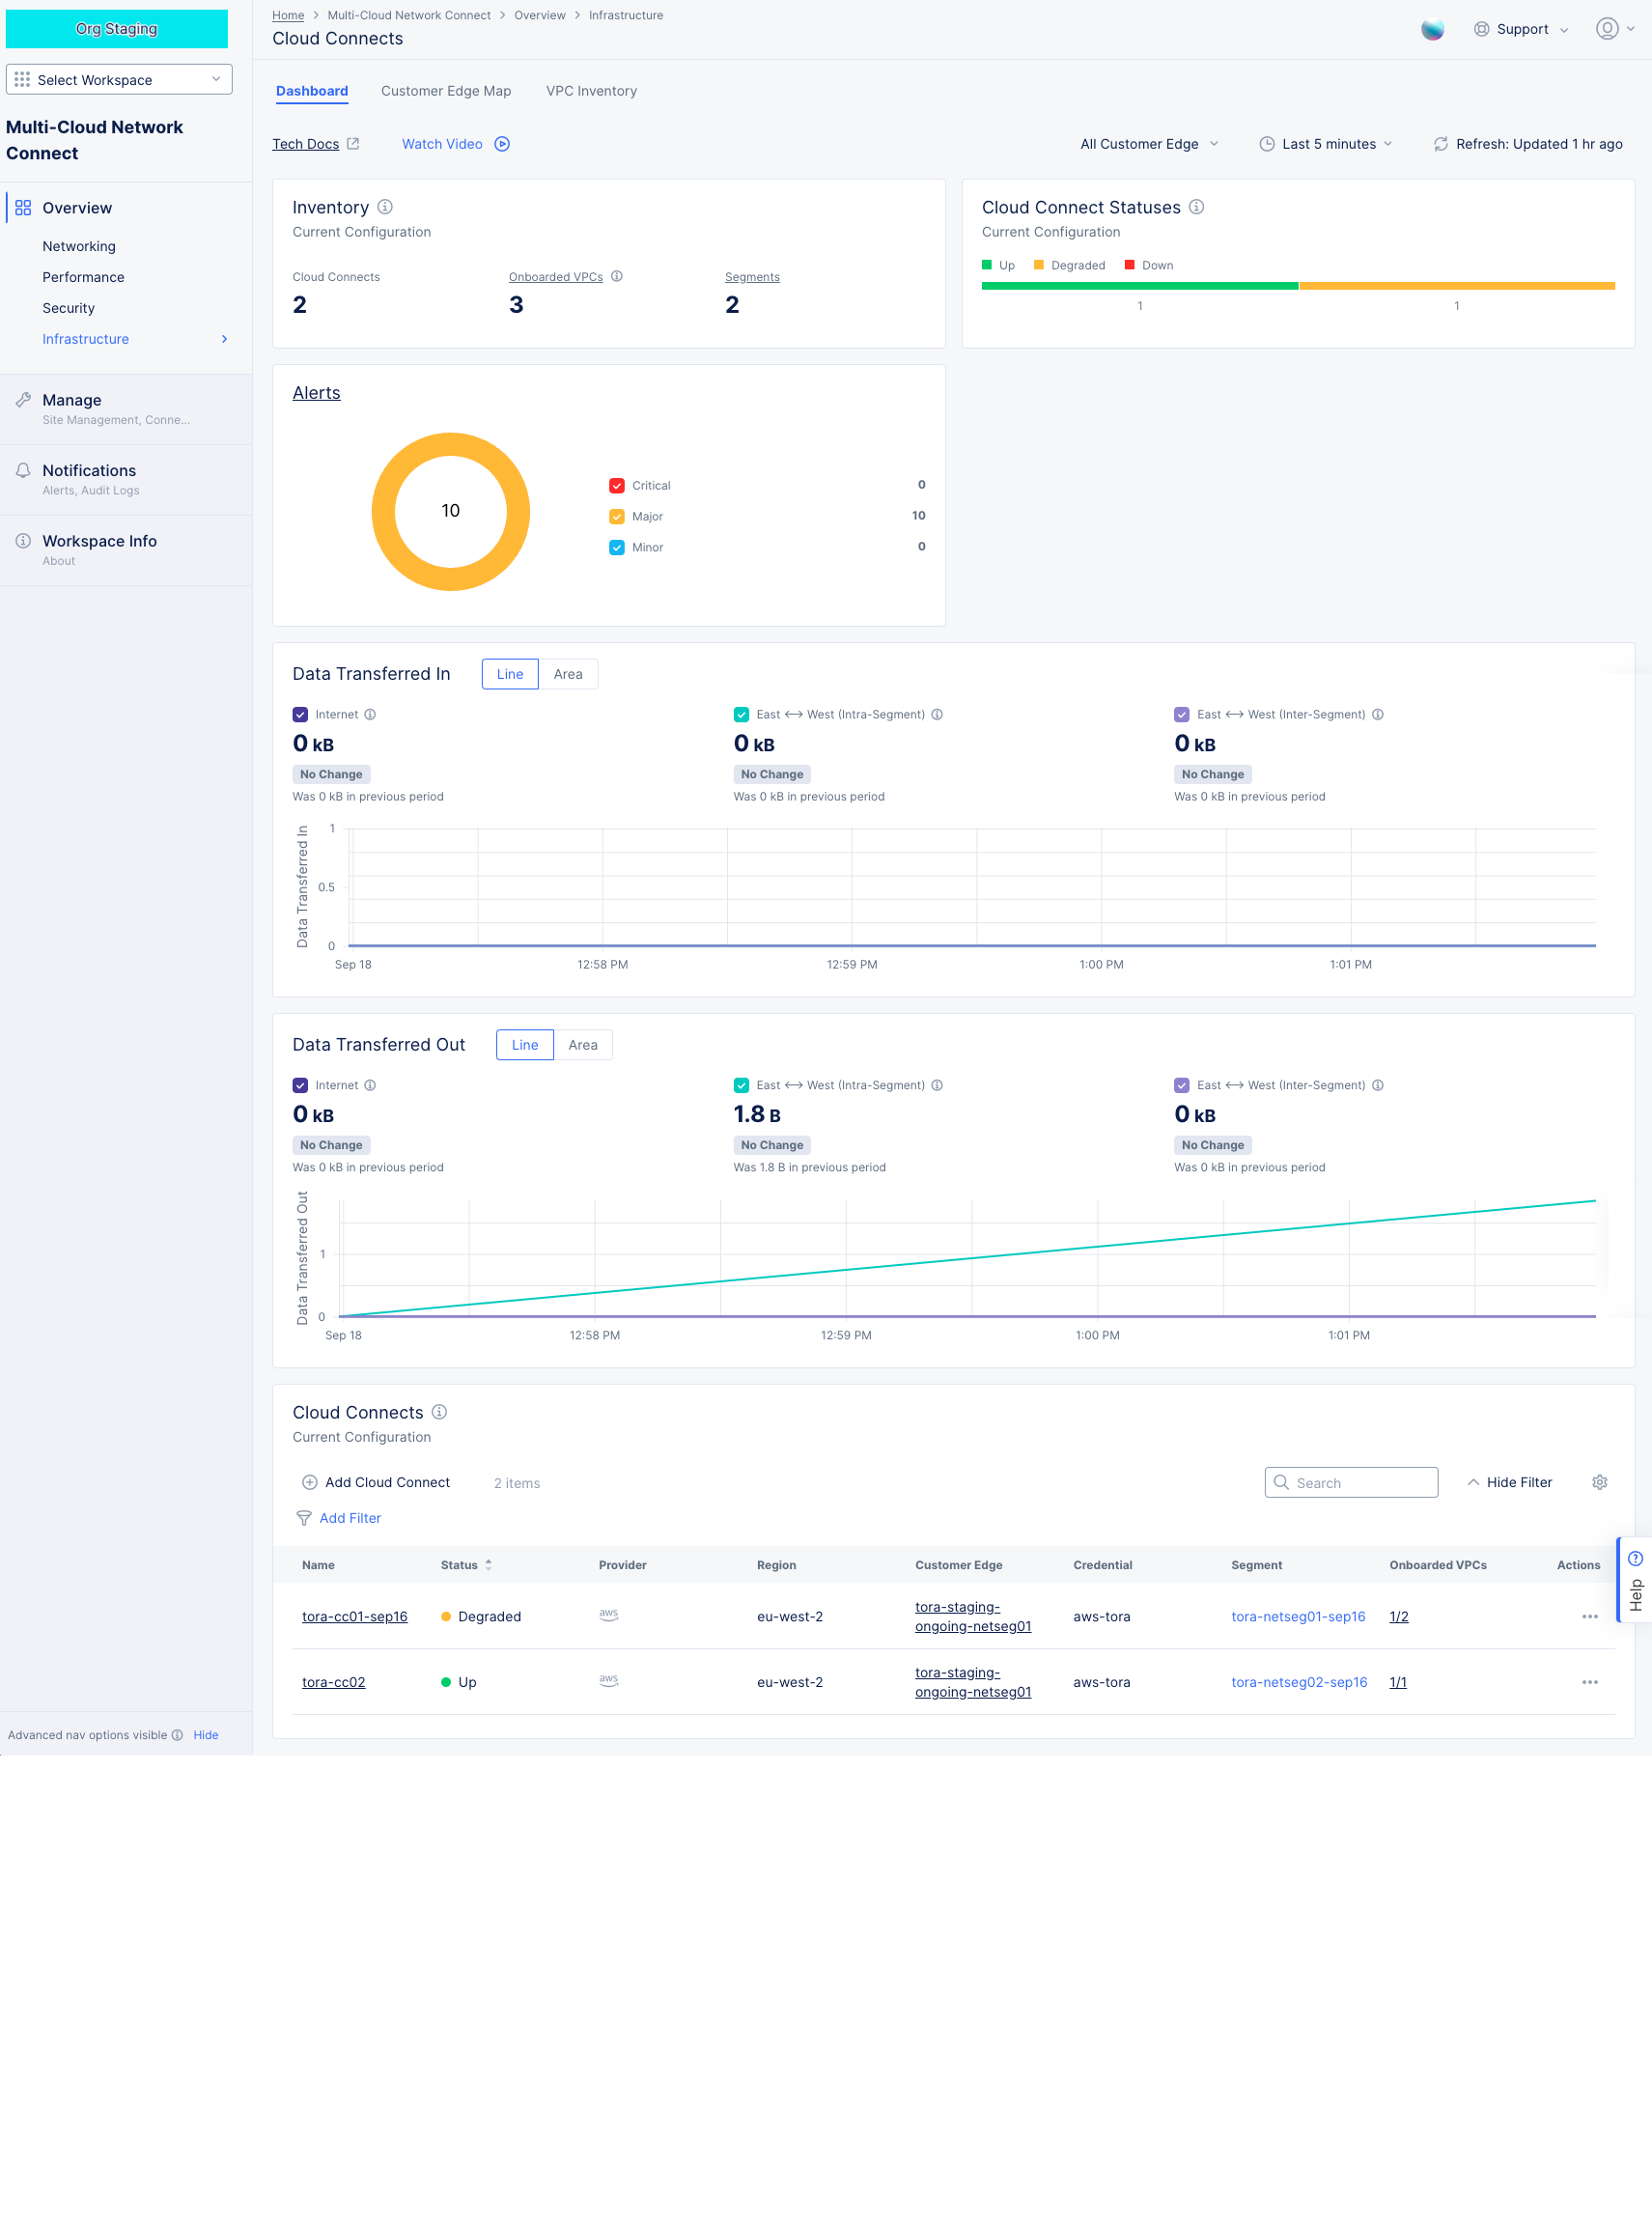
Cloud Connect Dashboard
Dashboard Details
General Page Options
Each tab consists of a number of widgets that display information related to the title at the top of the widget. For example, the Alerts widget only shows information related to alerts and not data transfer. Above the widgets is a set of options that relate to all widgets below (unless otherwise noted).
- The All Customer Edge drop-down menu determines which CE(s) to use for the information shown in the dashboard. You can use the drop-down menu to select one to five CE(s). If no CEs are selected, then data will be shown for all CEs, which is the default.
- The time drop-down menu allows you to show data only for the specified time. This is convenient for assessing your "current" situation or looking at longer term trends. You can also look at a specific time frame by selecting Custom, which can cover any time frame with the last 30 days.
- The Refresh option updates the information shown in the dashboard and shows how long ago the information shown on the page was retrieved.
Inventory, Statuses, and Alerts
-
The Inventory widget shows your current configuration of Cloud Connects.
- Cloud Connects shows the number of Cloud Connects you have created for this tenant.
- Onboarded VPCs shows the number of VPCs that have been onboarded into a Cloud Connect. Click Onboarded VPCs to see details on the VPC Inventory tab. From there you can also onboard additional VPCs.
- Segments shows the number of segments associated with your Cloud Connects. Click Segments to see segment details on the Segmentation tab of the Networking Overview page.
- This information is based on the current configuration and does not take into account the date/time frame selected at the top of the page.
-
The Cloud Connect Statuses widget shows the number of Cloud Connects that are Up (green), Degraded (yellow), or Down (red).
- This information is based on the current configuration and does not take into account the date/time frame selected at the top of the page.
-
The Alerts widget shows an overview of active alerts across all your Cloud Connects as well as onboarded VPCs and associated segments shown in the Inventory widget.
- The donut graph shows the number of alerts in the center, and the ring represents the percentage of alerts by criticality.
- The colored checkboxes show the number of alerts per category. Click a check box to show/hide that data in the donut graph.
Data Transfer Statistics
- Data Transferred In and Data Transferred Out shows the total data transferred into or out of the VPCs through all your Cloud Connects.
- This information can be shown in two ways using the Line|Area selector at the top of the widget.
- The graph shows the trends of three categories of the data transfer. Each category has a checkbox colored to match the associated data shown in the chart. Click a checkbox to show/hide that category of data.
- Internet shows the data transferred to or from the public internet.
- East ⇔ West (Intra-segment) show the data transferred between Cloud Connects on the same network segment.
- East ⇔ West (Inter-segment) show the data transferred between Cloud Connects across network segments.
- Data transfer information for a single Cloud Connect is not available.
Cloud Connects Table
The Cloud Connects widget shows an overview of each of your Cloud Connects. The color of each circle in the status column represents the health of the site: Green - Up, Yellow - Degraded, Red - down.
Interact with the Cloud Connects table:
- Use the Search and Add Filter fields above the list to narrow the list of sites shown.
- Click the gear icon ( ⚙ ) see different column data in the table.
- Use the items per page selector below the list (if present) to set the maximum number of Cloud Connects listed on a page, and use the page selector to see other pages.
- Click Add Filter or enter a string in the Search field to limit what is shown in the table.
- Click on a Cloud Connect name in the list to get an in-depth view of that individual Cloud Connect - see Monitor a Single Cloud Connect.
- Click on a Customer Edge name in the list to get an in-depth view of that individual customer edge - see Explore a Site.
- Click on segment name to see details for that segment in a slide-out panel. There you can find details of the attachments and connected segments.
- The Onboarded VPCs column shows the number of onboarded VPCs vs the total number of VPCs for the Cloud Connect. Click on the numbers ration to see go to the VPCs tab on the Cloud Connect page for that specific Cloud Connect.
- In the Actions column, click ... > Manage Configuration to get view the configuration details for that Cloud Connect.
Customer Edge Map
The Customer Edge Map tab show all of your CEs on a world map. CEs are represented by blue square icons on the map. If there are multiple CEs in a small area, then all of them will be represented by a cluster icon, which is a circle around the number of CEs that are in that cluster.
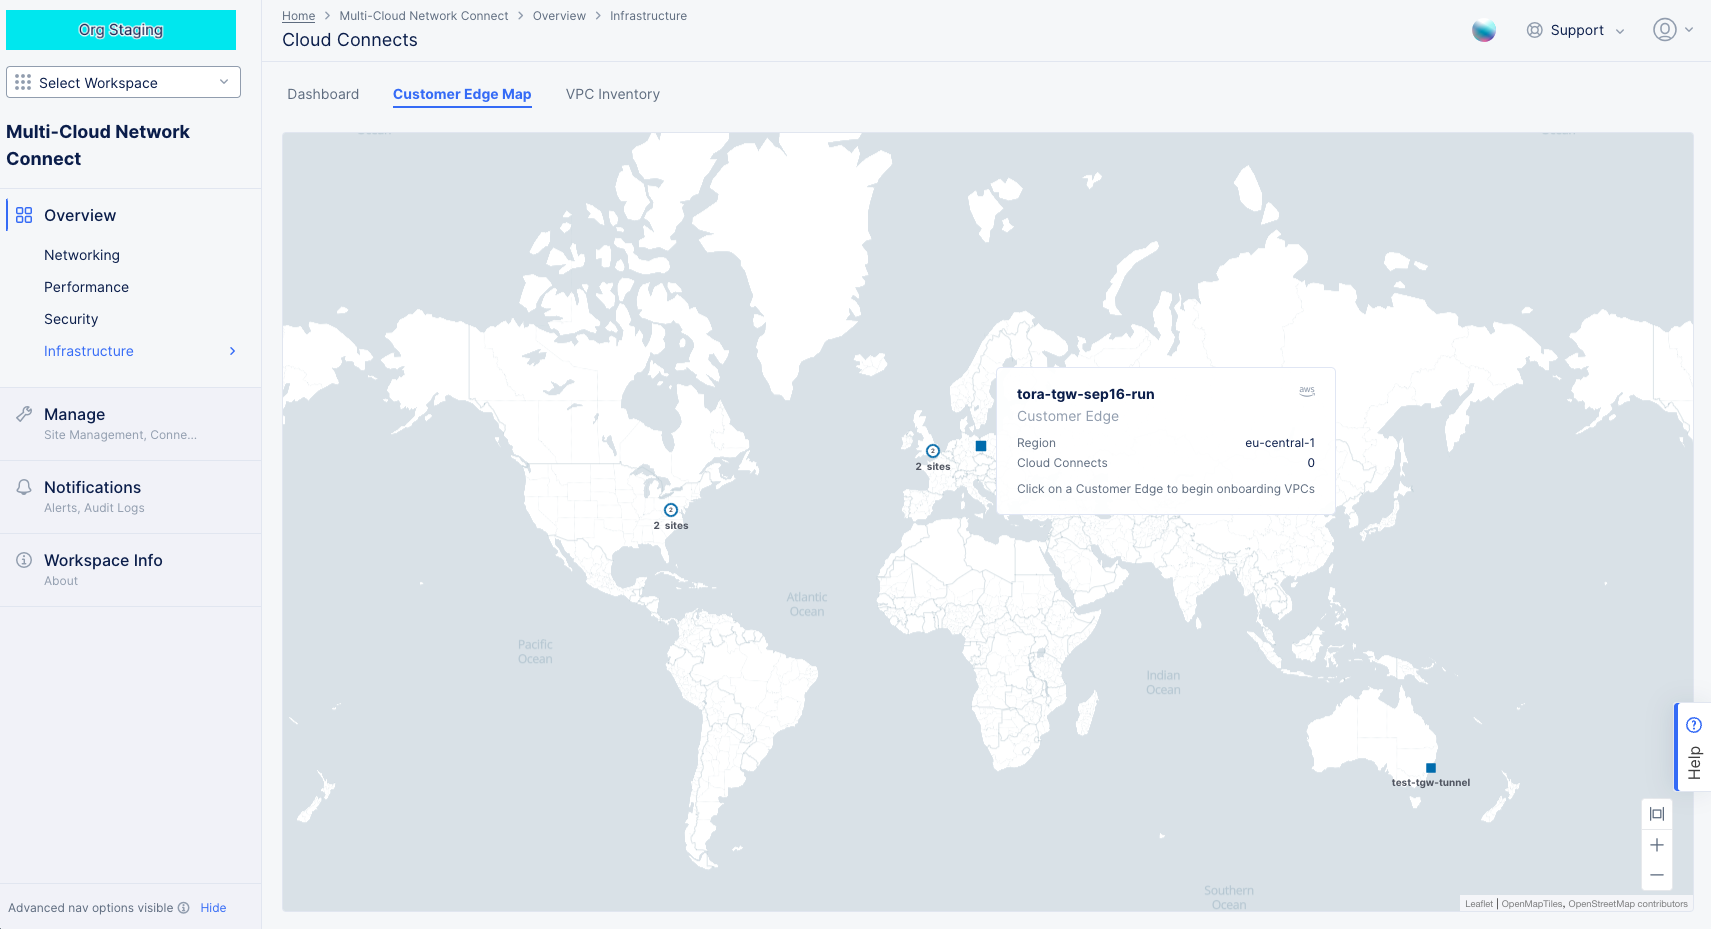
Customer Edge Map
Customer Edge Map Details
- Click a cluster of CEs to zoom into that cluster.
- Hover over a CE to get overview information for that CE.
- Click on a CE see additional information about that CE in a slide-out panel.
Customer Edge Map Details
- Click the CE Name at the top of the panel to go to the site dashboard for that CE.
- Click Onboard VPCs to begin the onboarding process. This will take you to the VPC Inventory tab with this CE configured for onboarding.
- Click the Cloud Connect name in the table to go to the dashboard for that specific Cloud Connect.
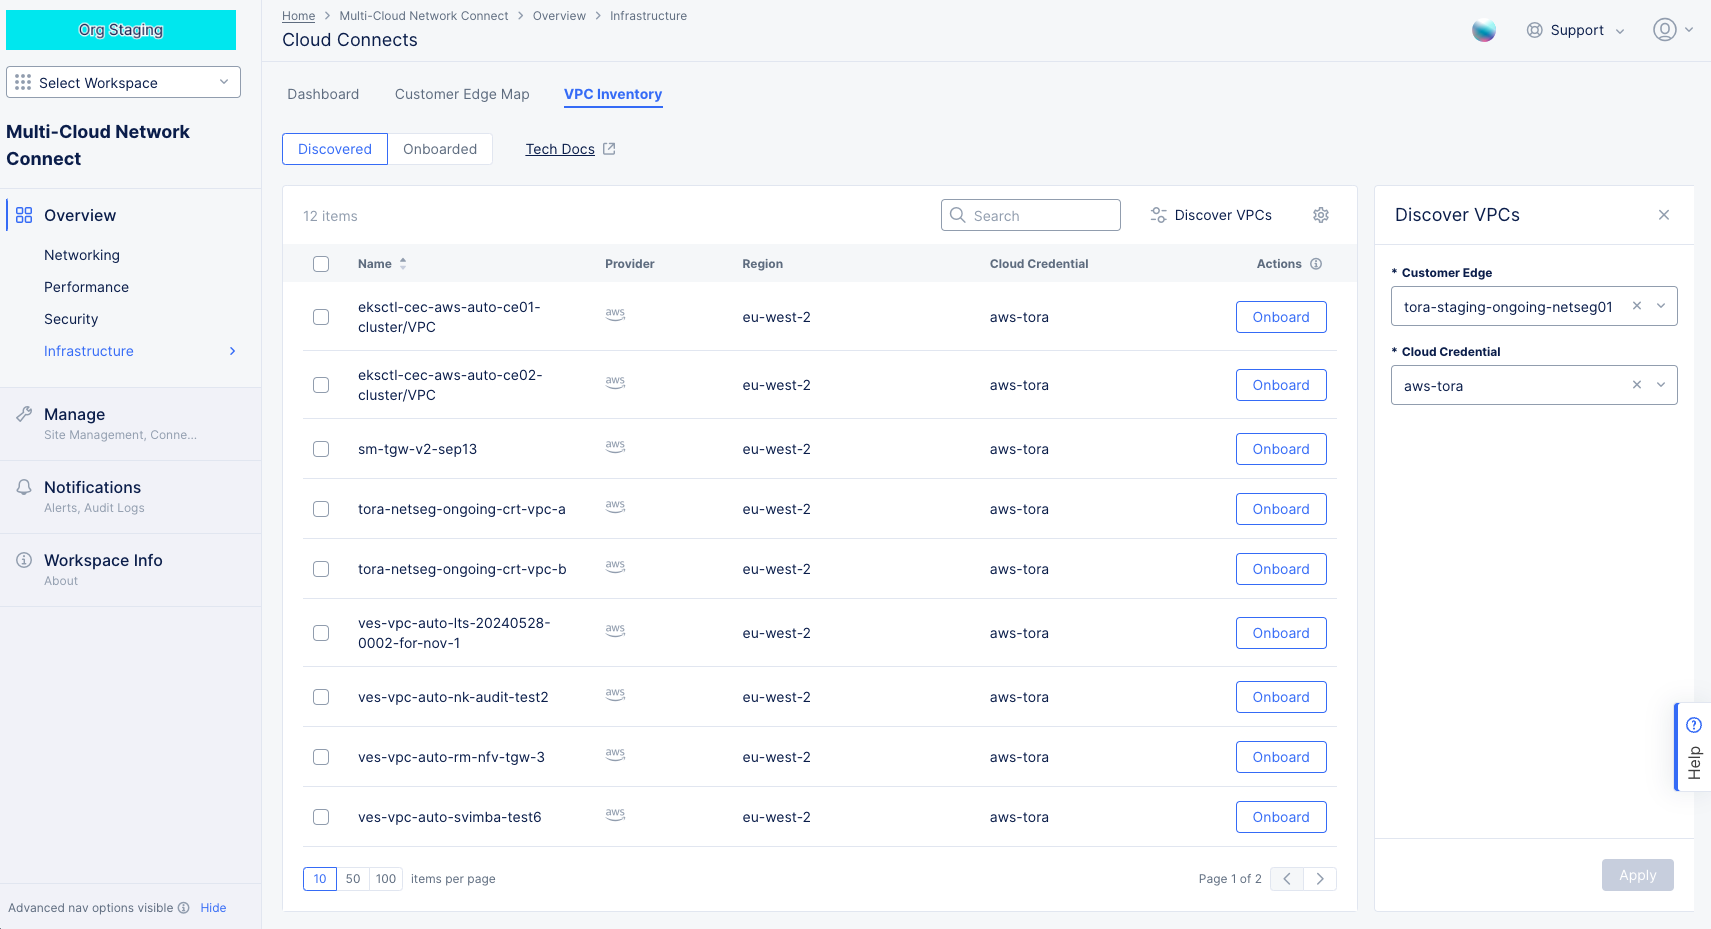
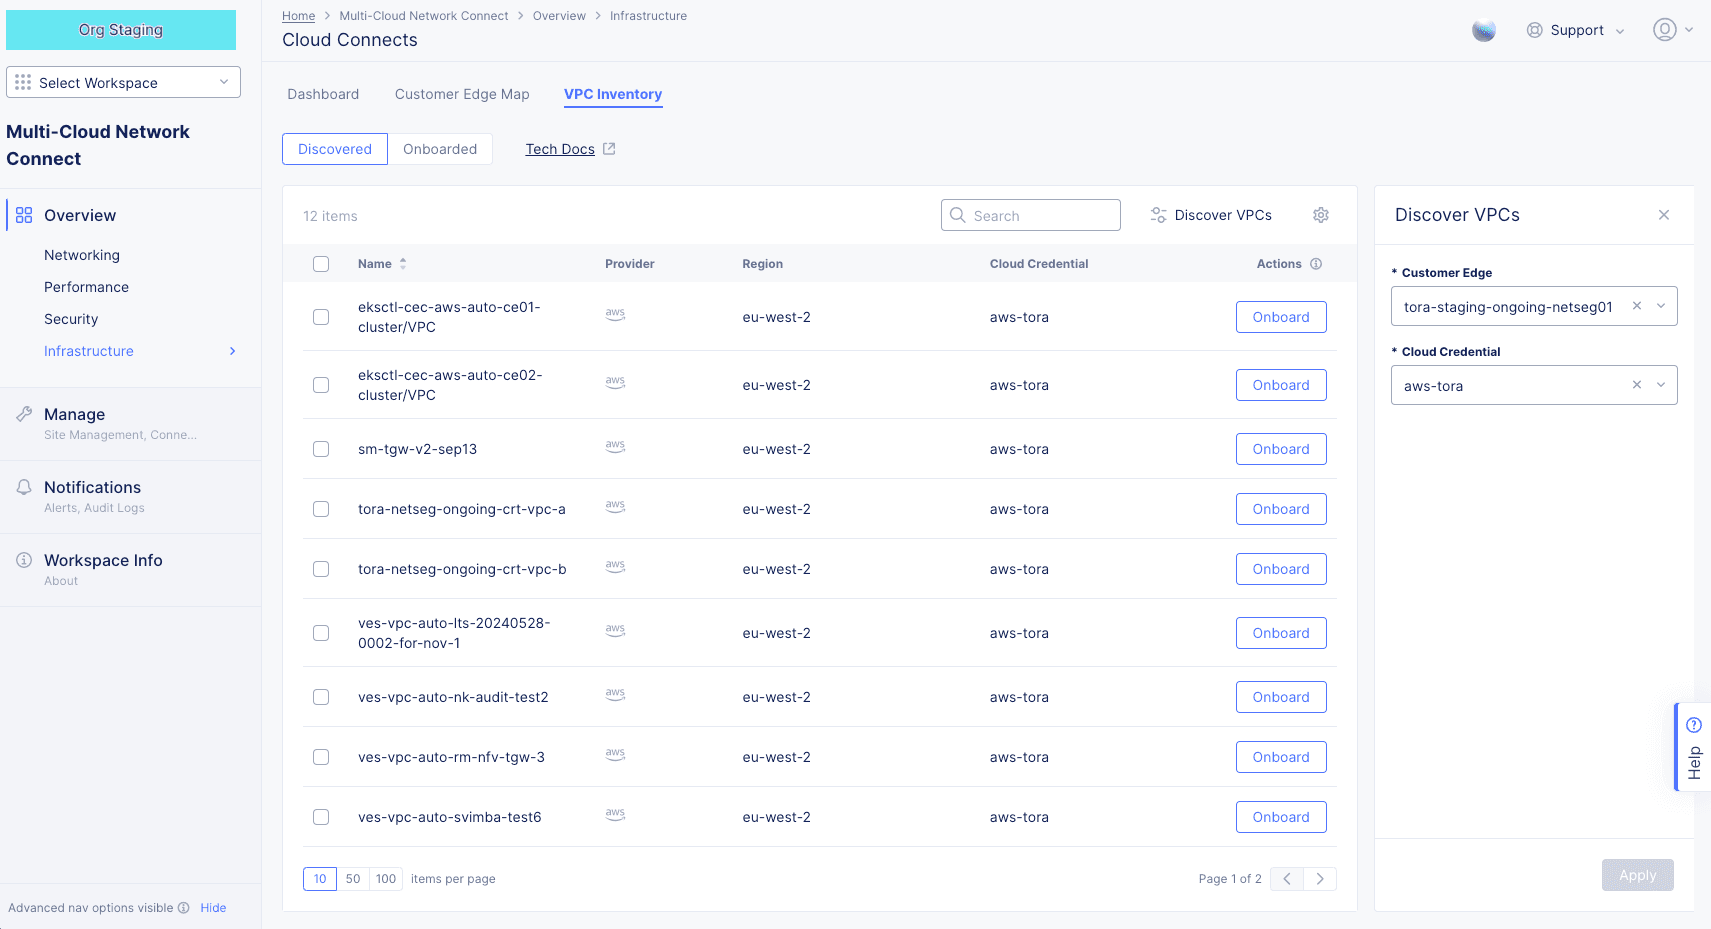
VPC Inventory
The VPC Inventory tab shows your discovered and onboarded CEs. Use the Discovered|Onboarded selector to choose which table to see.
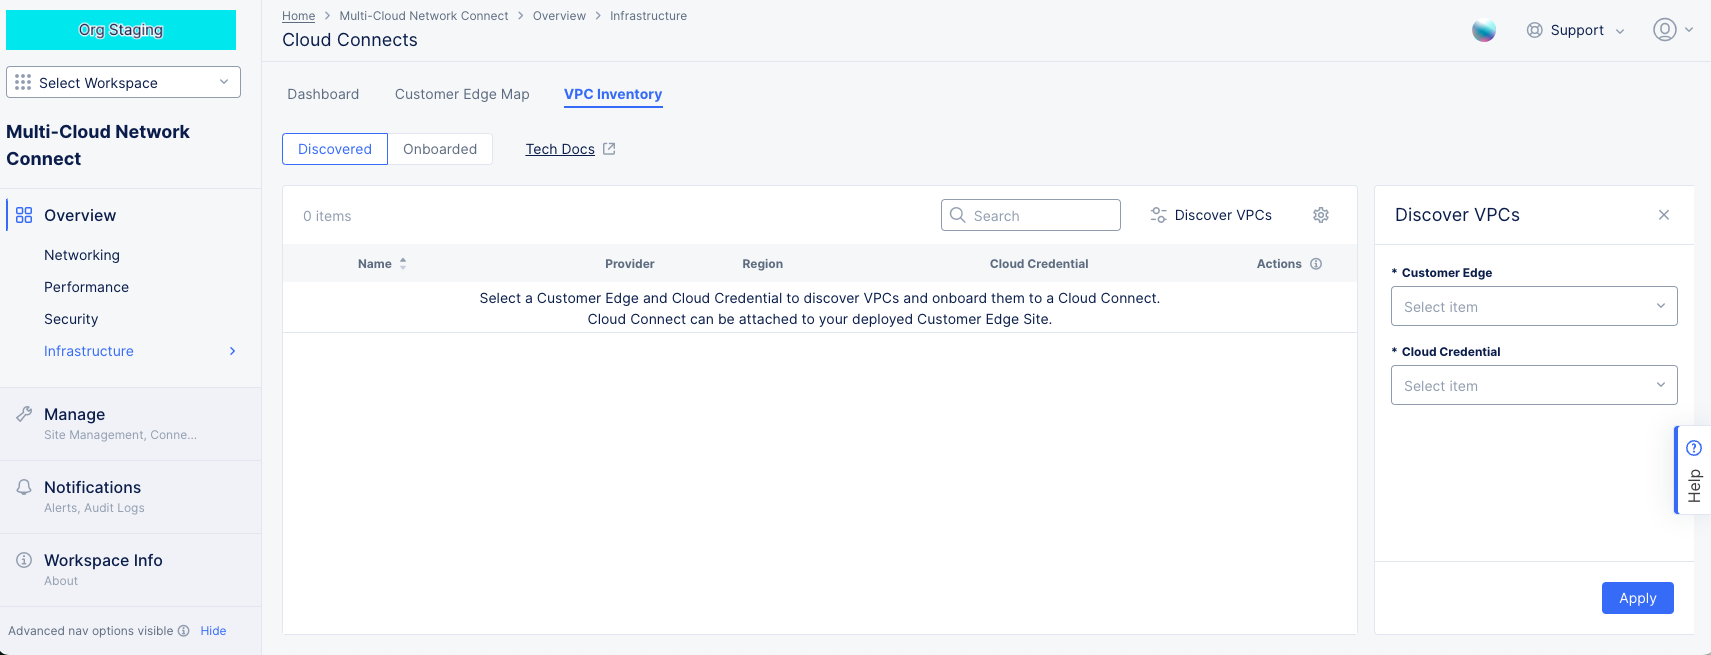
Discovered Table
Start by selecting a CE from the Customer Edge drop-down menu and your credentials from the Cloud Credentials drop-down menu. Then click Apply. This will populate the table with discovered VPCs.
Discovered VPC Inventory
-
Use the Discover VPCs panel to populate the table. Click Discover VPCs at the top of the table to show/hide the Discover VPCs panel.
- Select a site from the Customer Edge drop-down menu.
- Select a valid credential from the Cloud Credential drop-down menu.
- Click Apply to see the discovered VPCs in the table.
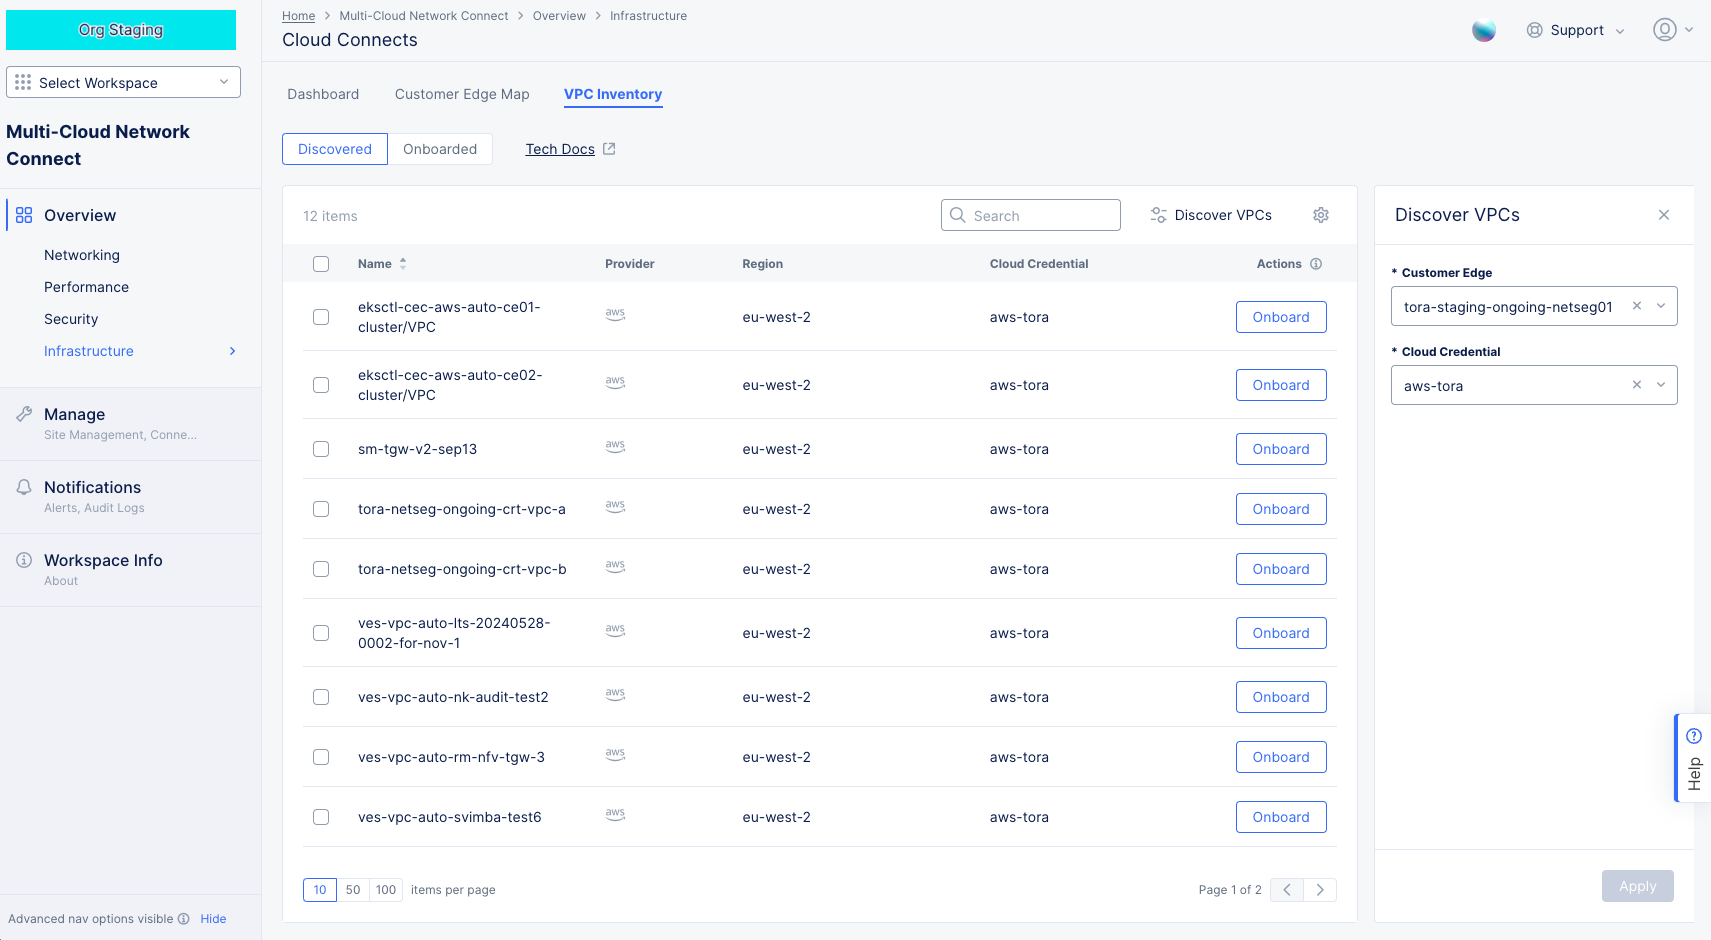
-
Click the Onboard button in the Actions column for the VPC you want to onboard.
-
Check the checkbox for multiple VPCs you want to onboard, and then click Onboard Selected to onboard multiple VPCs.
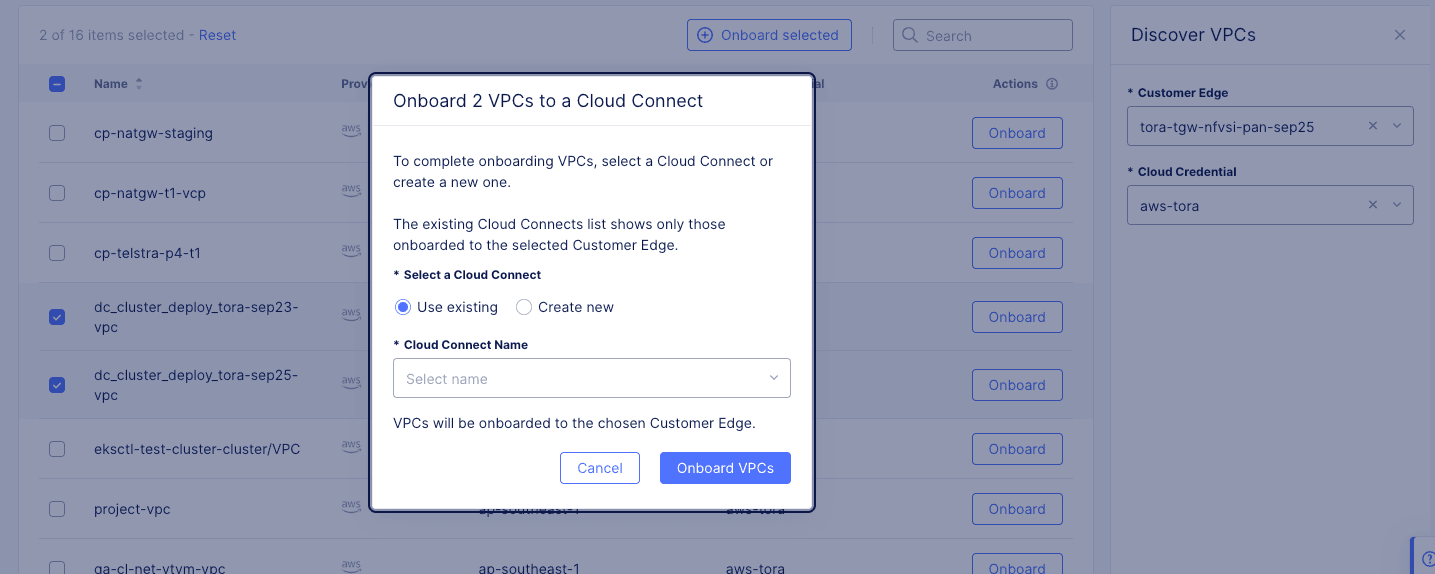
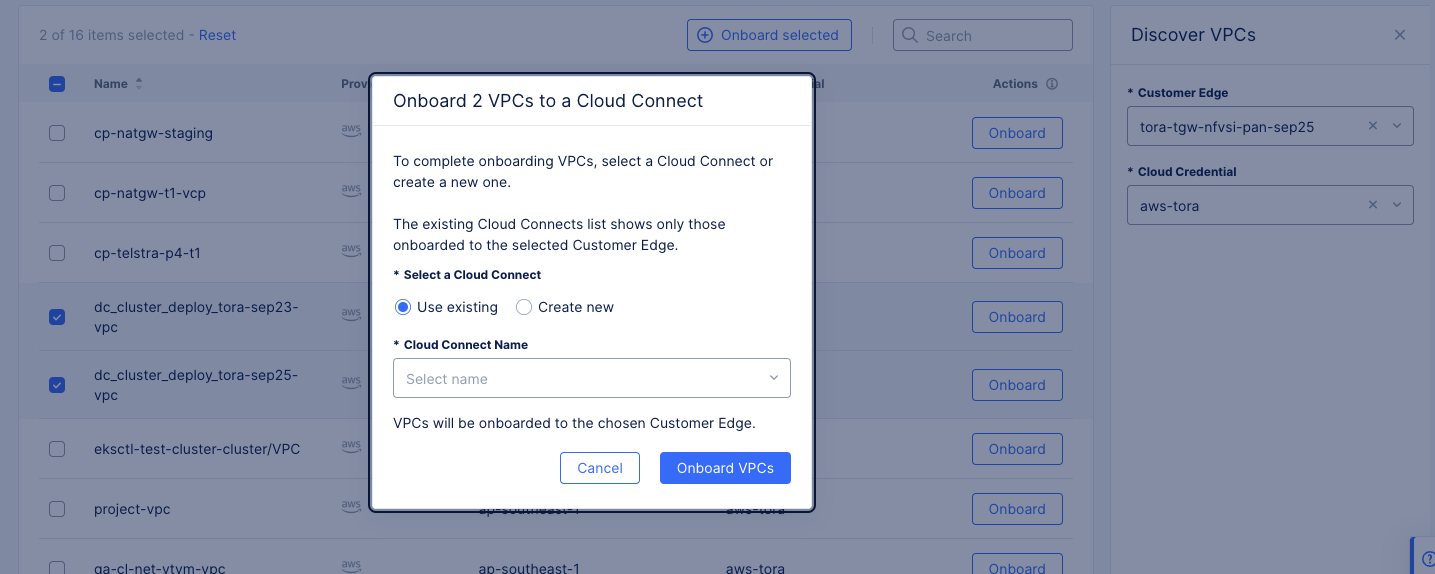
Onboard VPCs
-
Use the Search and Add Filter fields above the list to narrow the list of sites shown.
-
Click the gear icon ( ⚙ ) see different column data in the table.
-
Use the page options at the bottom of the table to change the current page or to change the items per page.
Onboarded Table
The Onboarded table shows the sites that you have already onboarded or attempted to onboard.
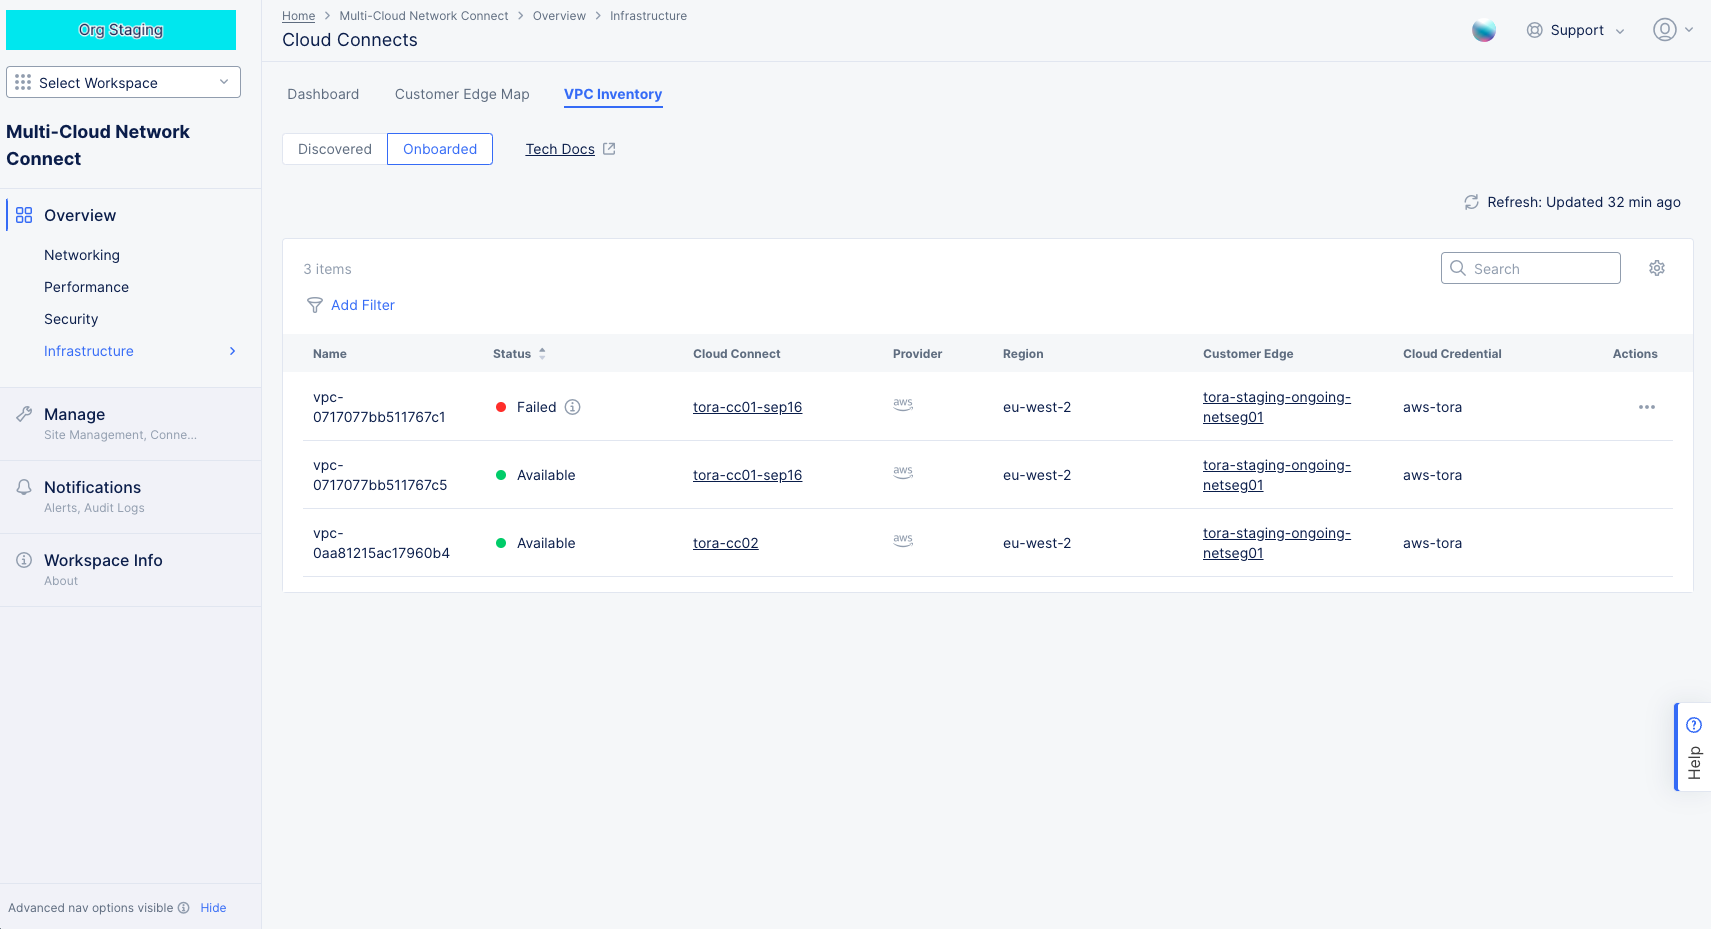
- If you have a Failed status for one of your VPCs, you can click ... > Retry in the Actions column for that VPC. If the problem persists, check the configuration.
- Click a name in the Cloud Connect column to get an in-depth view of that individual Cloud Connect - see Monitor a Single Cloud Connect.
- Use the Search and Add Filter fields above the list to narrow the list of sites shown.
- Click the gear icon ( ⚙ ) see different column data in the table.
- Use the page options at the bottom of the table to change the current page or to change the items per page.
Monitor a Single Cloud Connect
You can get an overview of a specific Cloud Connect by clicking on a Cloud Connect name in the Cloud Connects table on the aggregate Cloud Connects dashboard tab discussed above (also from the Onboarded VPCs table).
Single Cloud Connect Dashboard
The Cloud Connect dashboard looks at one of your Cloud Connects and provides an overview of the Cloud Connect's inventory, status, alerts, and VPC states.
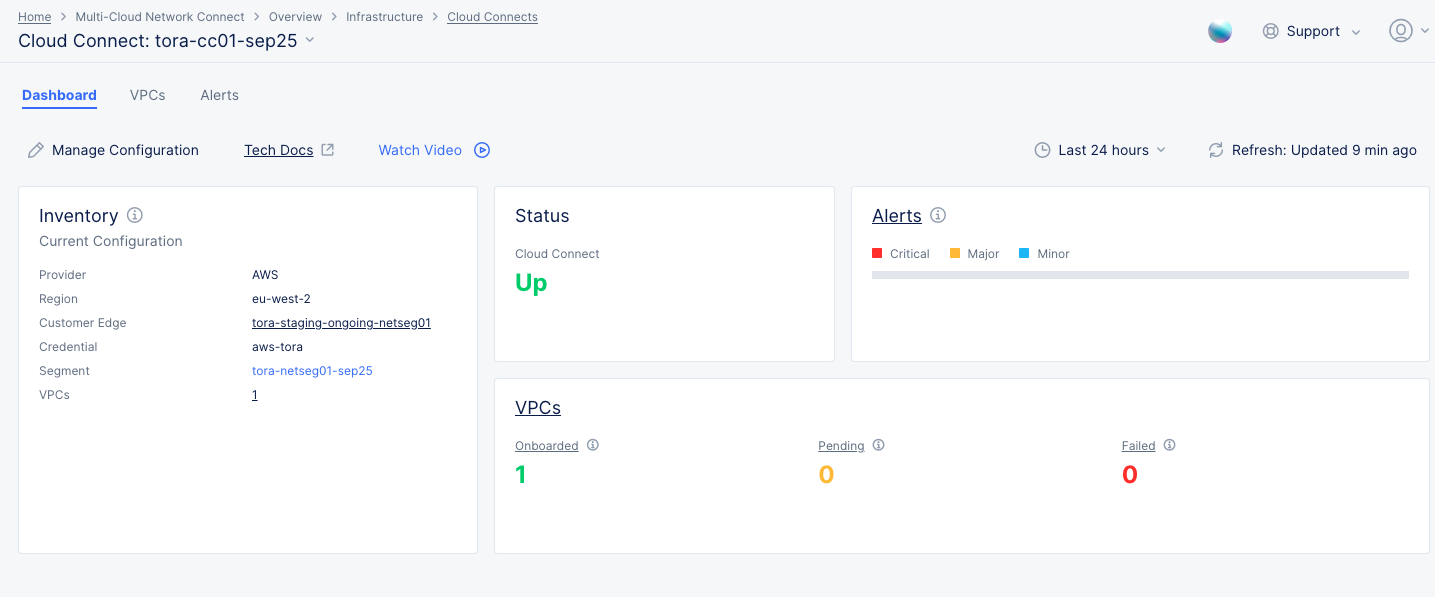
Dashboard Details
- The Inventory widget shows configuration details for the Cloud Connect. The content is current and not affected by the time selector. Click the name of the Customer Edge to see details on the site dashboard.
- The Status widget shows the current state of the Cloud Connect: Green Up, Yellow Degraded, or Red Down.
- The Alerts widget shows how many alerts of each criticality exist for the Cloud Connect. Click the Alerts title to go to the Alerts tab (discussed below).
- The VPCs tab shows the number of VPCs that have been onboarded, are pending, or have failed. Click the VPCs title to go to the VPCs tab (discussed below). Click the Onboarded, Pending, or Failed header to see the VPCs with that status in the Onboarded table on the VPCs tab (discussed below).
Single Cloud Connect VPCs
The VPCs tab shows a table of your VPCs. The Discovered|Onboarded select allows you to chose which table you see.
VPCs Details
The Discovered table shows all the VPCs discovered for this Cloud Connect.
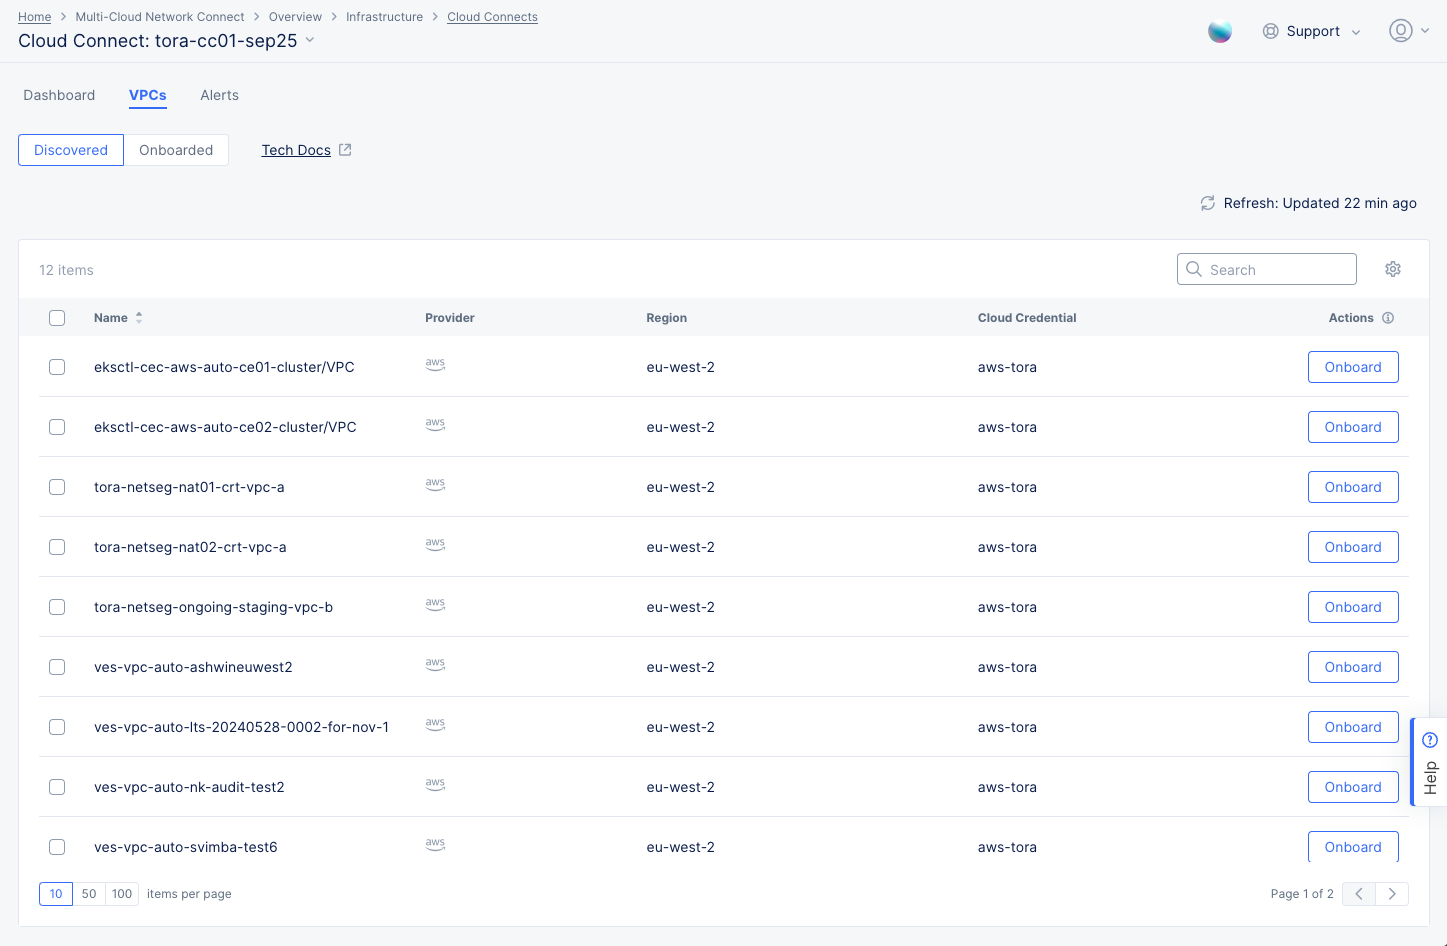
Discovered VPCs
- Click the Onboard button in the Actions column for the VPC you want to onboard.
- Check the checkbox for multiple VPCs you want to onboard, and then click Onboard Selected to onboard multiple VPCs.
- Either of the above actions will display the VPC Attachment form from the Cloud Connect configuration allowing you to onboard the selected VPCs.
The Onboarded table shows all the onboarded VPCs for this Cloud Connect.
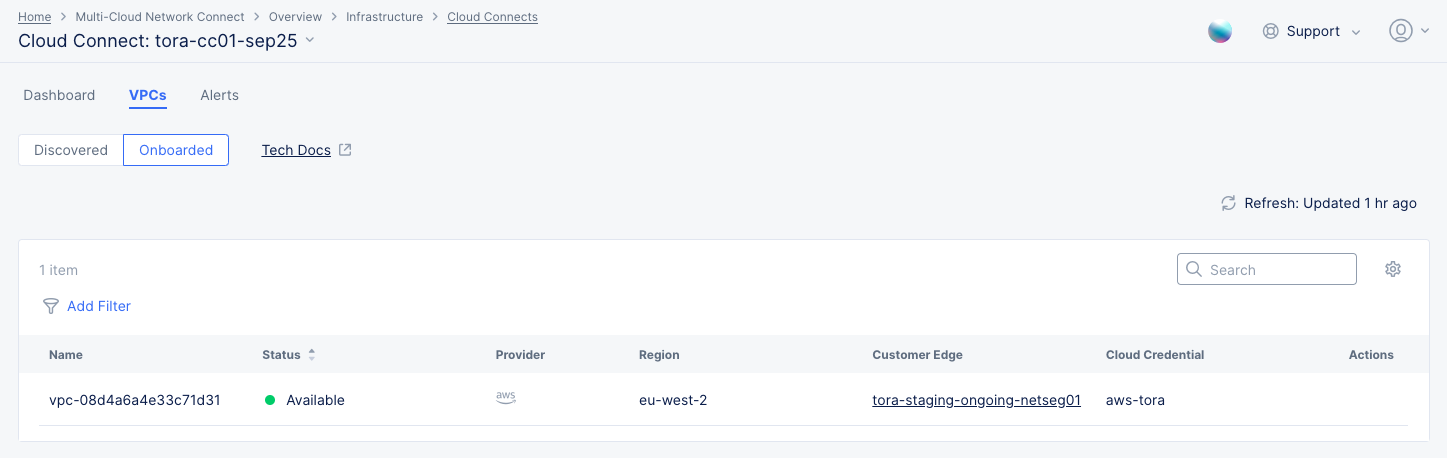
Onboarded VPCs
- If you have a Failed status for one of your VPCs, you can click ... > Retry in the Actions column for that VPC. If the problem persists, check the configuration.
- Click on a Customer Edge name in the list to get an in-depth view of that individual customer edge - see Explore a Site.
Single Cloud Connect Alerts
The Alerts tab provides the alerts affecting the Cloud Connect. The All Alerts|Active Alerts selector allows you to choose between seeing all alerts in a time frame and a table of active alerts.
All Alerts Graph
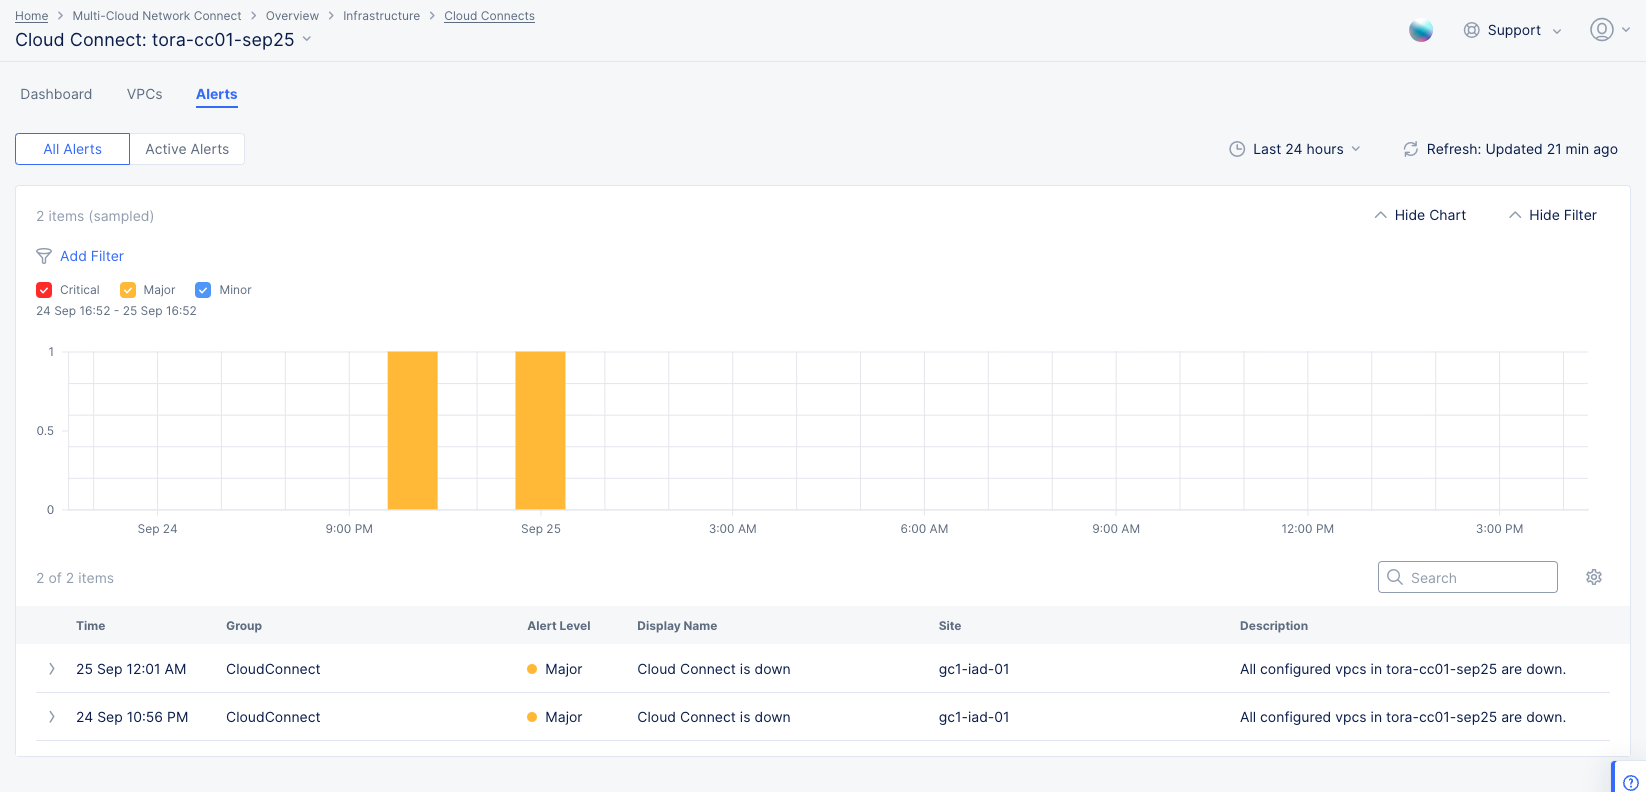
Cloud Connect Alerts
- The All Alerts graph shows the alerts in a graph on a time access. The contents of the graph are color coded to match the criticality check boxes above the graph.
- Click a criticality checkbox to show/hide that type of alerts in the graph.
- Use Add Filter to filter modify which alerts are displayed.
- The table below shows summary information for each alert.
- Use the Search field to limit the alerts shown to only those that match the string you enter.
- Click > for an alert to see the alert details in JSON format.
Active Alerts Table
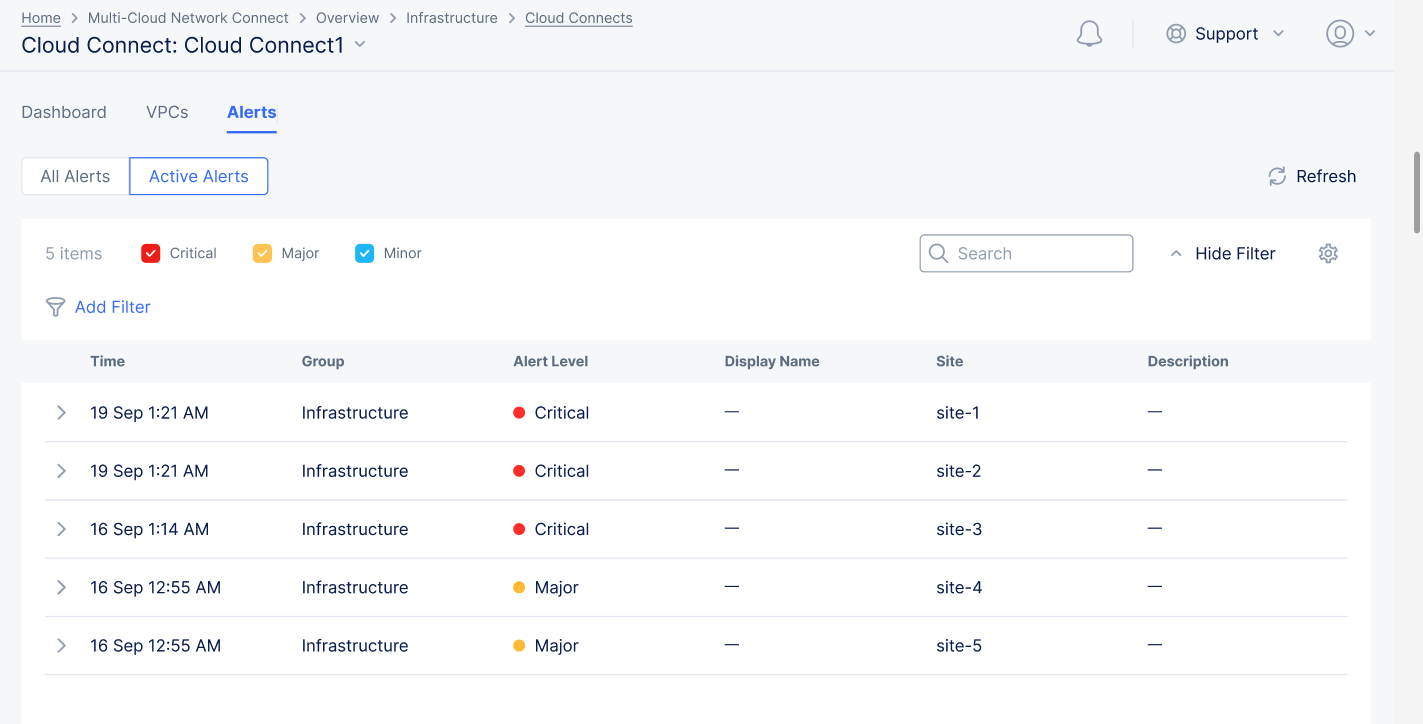
Cloud Connect Active Alerts
- The Active Alerts table shows the alerts in a table with summary information in the columns.
- Click > for an alert to see the alert details in JSON format.
Concepts
API References
On this page:
- Objective
- Prerequisites
- Monitor All Cloud Connects
- Cloud Connect Dashboard
- General Page Options
- Inventory, Statuses, and Alerts
- Data Transfer Statistics
- Cloud Connects Table
- Customer Edge Map
- VPC Inventory
- Monitor a Single Cloud Connect
- Single Cloud Connect Dashboard
- Single Cloud Connect VPCs
- Single Cloud Connect Alerts
- Concepts
- API References