Integrate NGINX Using Service Discovery
Objective
This document provides instructions on how to integrate NGINX® with service discovery into F5® Distributed Cloud Services. Service discovery enables you to find the endpoints where a given service is available. For more information about service discovery, see Service Discovery.
NGINX is an All-in-One API Gateway, Content Cache, Load Balancer, and Web Server.
Using the instructions provided in this guide, you can create a discovery object for an NGINX server block and an endpoint for a service using the service name.
Prerequisites
The following prerequisites apply:
-
A valid Account is required. If you do not have an account, see Getting Started with Console.
-
An existing NGINX server block with a service or application reachable from a Site.
Create Discovery for External NGINX Server Block
Features can be viewed and managed in multiple services. This example shows Service Discovery setup in Multi-Cloud App Connect.
Step 1: Create a new service discovery object.
- Log into Console select Multi-Cloud App Connect.
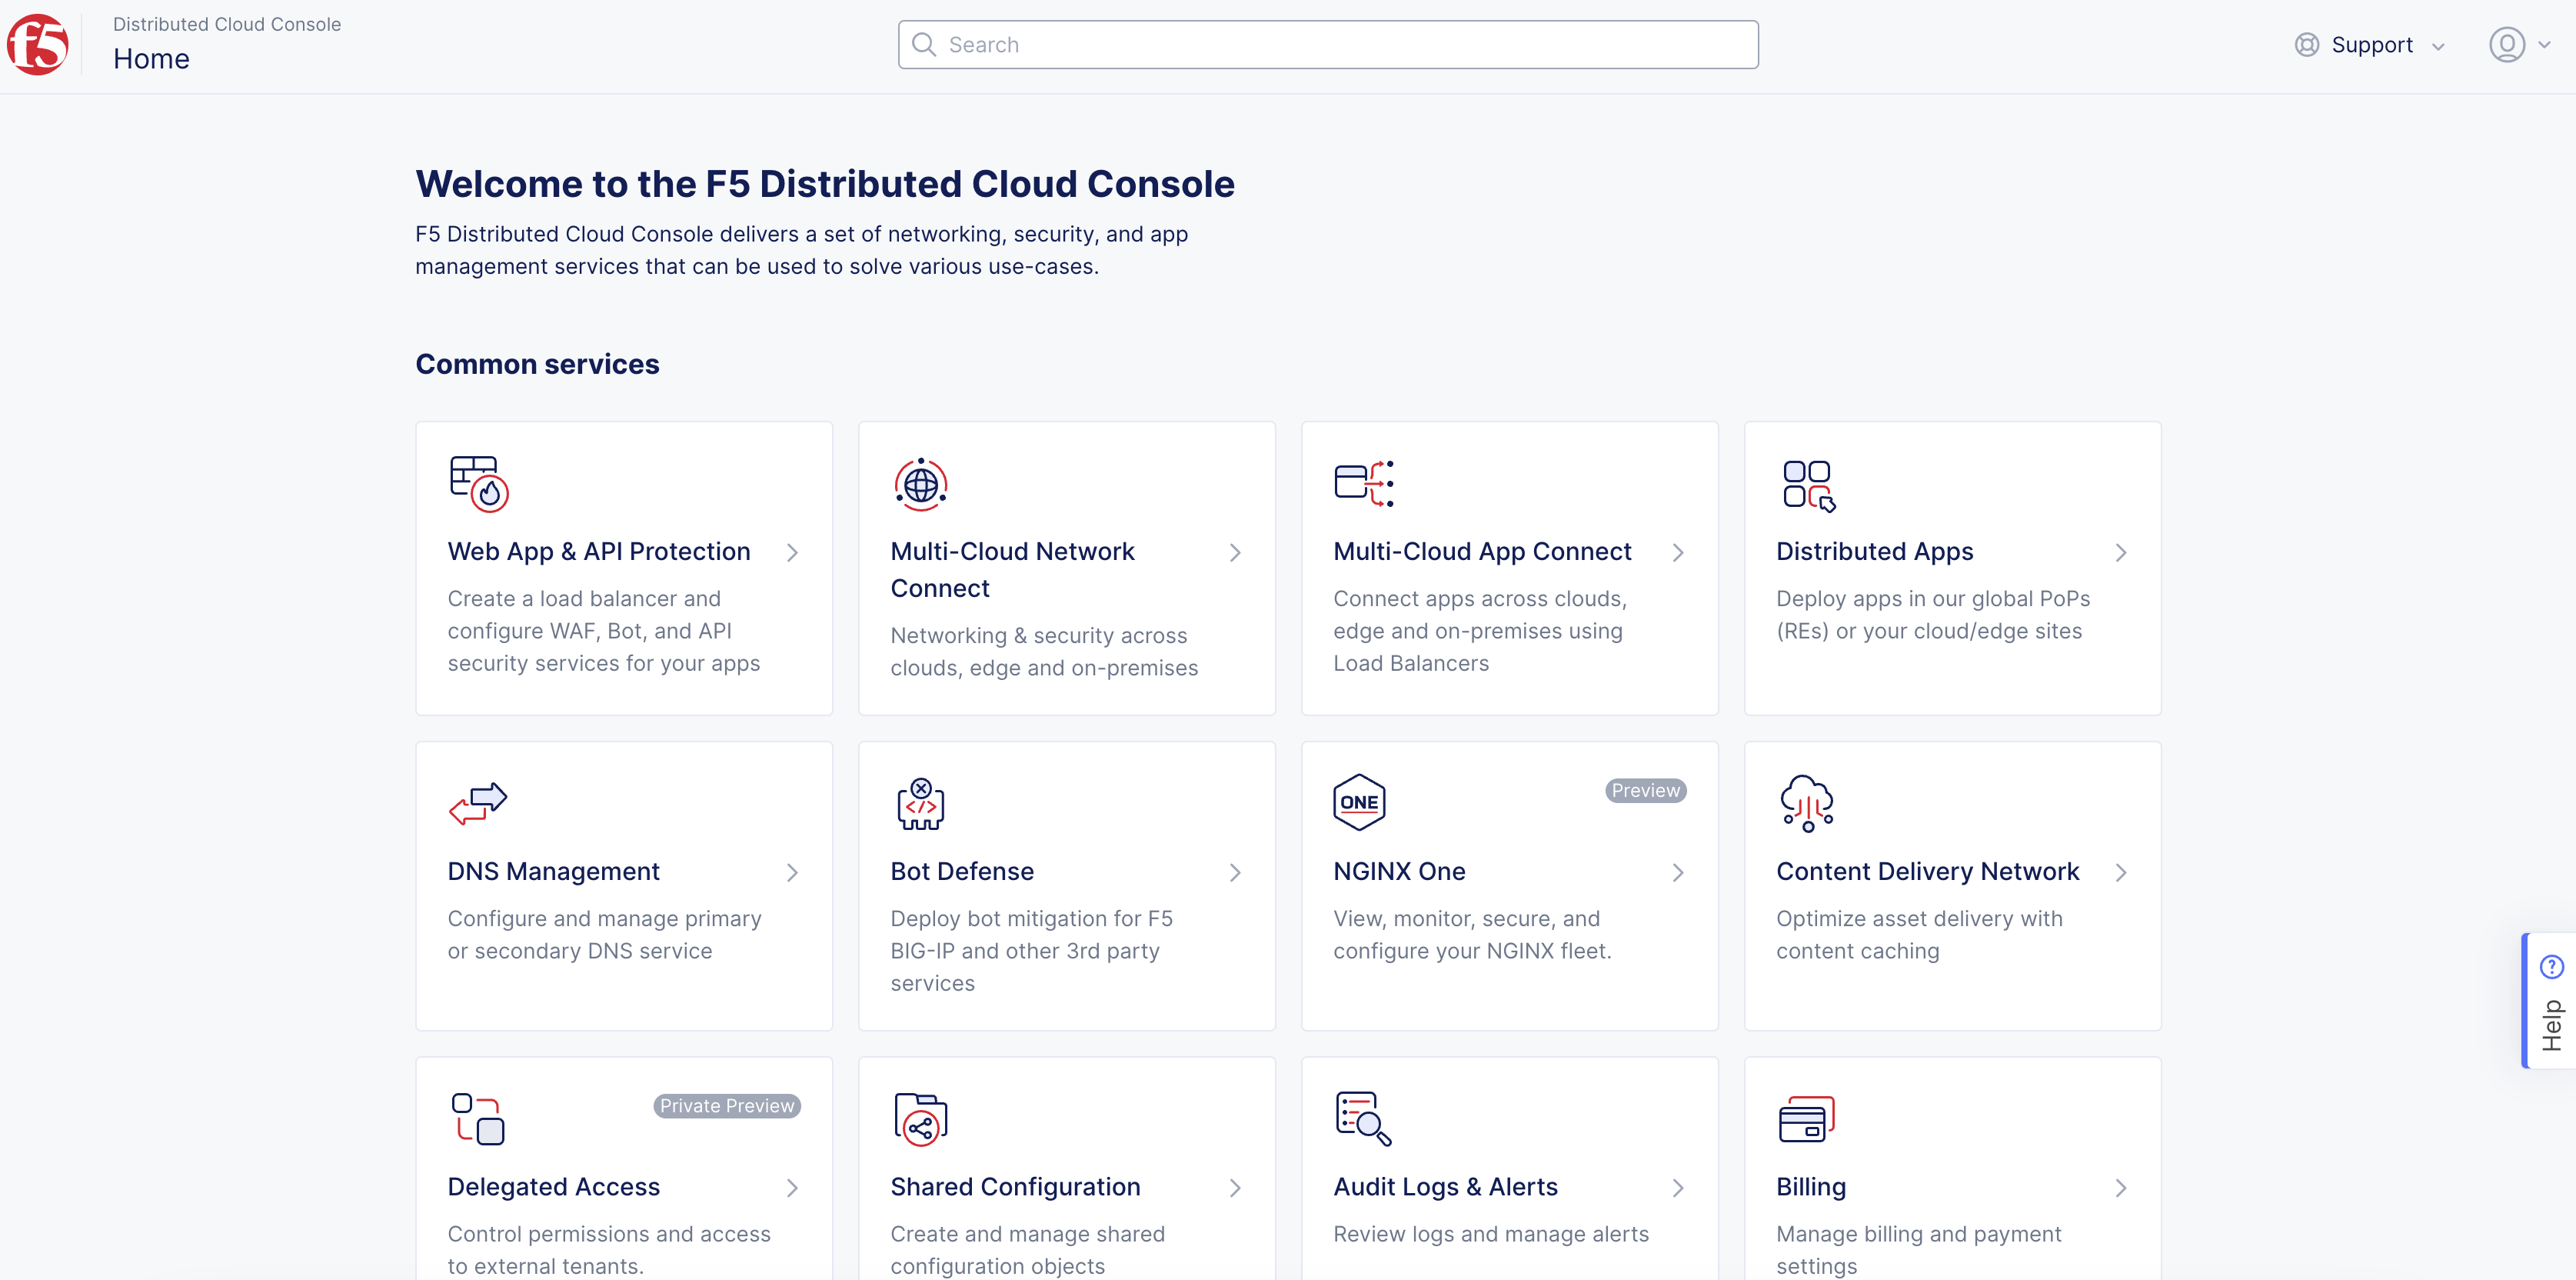
Figure: Console Homepage
- Navigate to Manage > Service Discoveries and select the NGINX tab.
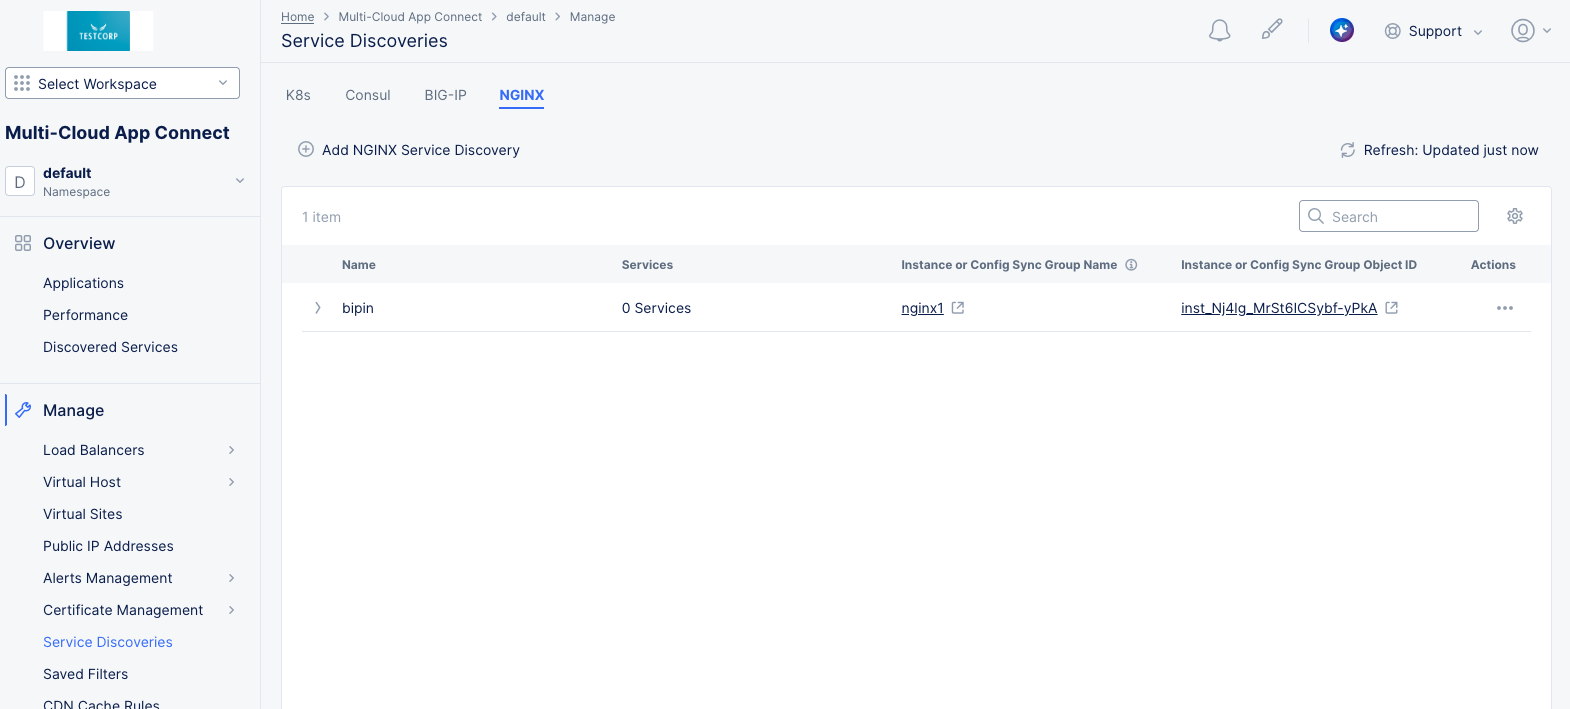
Figure: NGINX Service Discoveries page
-
Confirm the correct namespace is selected. For more information on the namespace concept, see Namespaces.
-
Select Add NGINX Service Discovery.
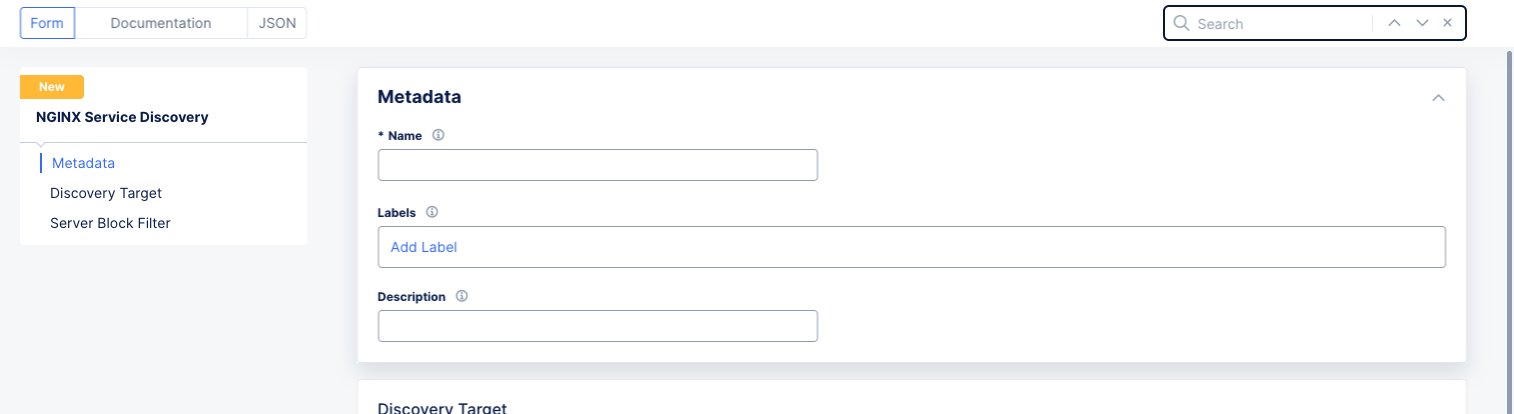
Figure: New NGINX Service Discovery
-
Enter Name.
-
Enter Labels and Description as needed.
Step 2: Configure where the discovery configuration is applicable.
-
Choose the type of NGINX target from the Type drop-down menu, either NGINX Instance or NGINX Config Sync Group.
-
Select the target from the Reference drop-down menu and then copy the Object Id for future reference. Once the target is selected, you can optionally select Manage in NGINX One to see compete information about the target in the NGINX One console. This target may be either an instance or a Config Sync Group.
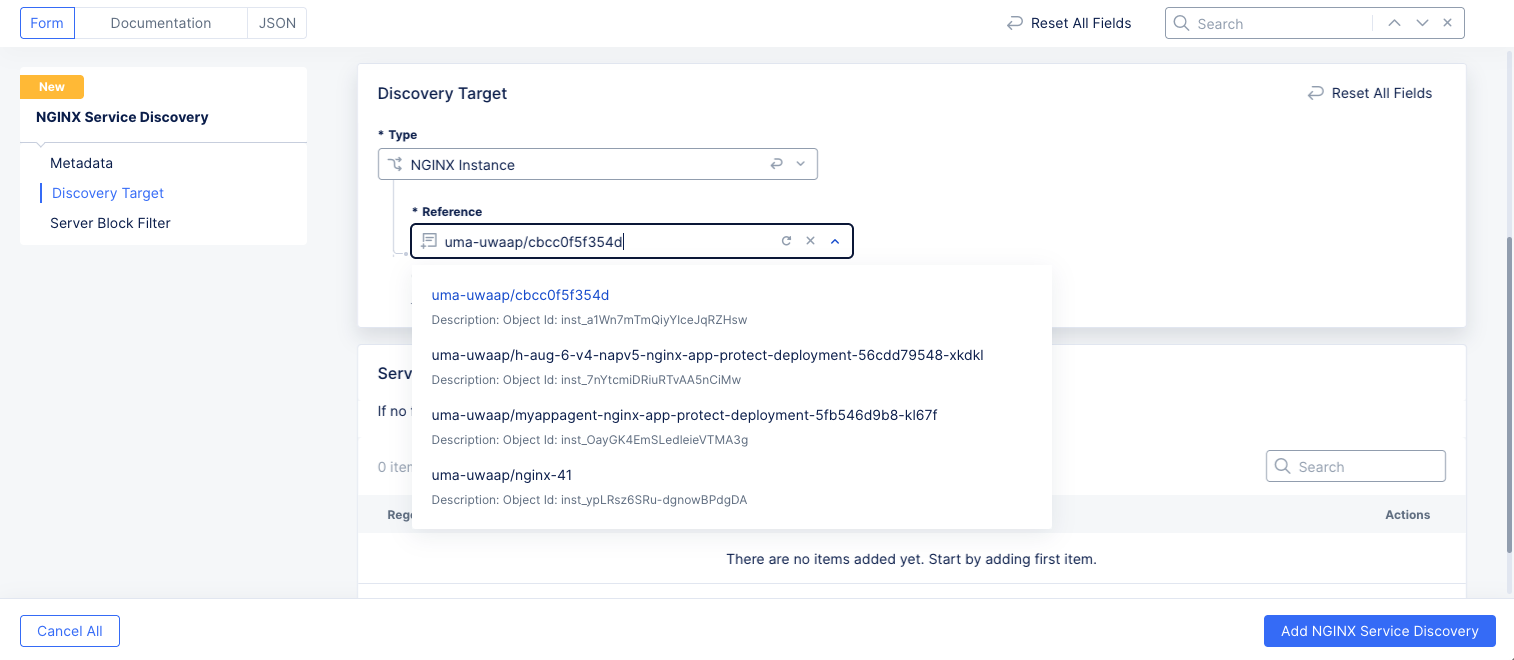
Figure: Select NGINX Target
Step 3: Optionally configure a Server Block Filter.
Note: If no filters are specified, all server blocks will be discovered by default.
-
Select Add Item to create a filter.
-
Enter a regular expression (regex) and/or a port range that must match for a server block to be discovered. If you enter both, then both must match.
-
Repeat this step to add additional filters. All filters must match against the server block for it to be discovered.
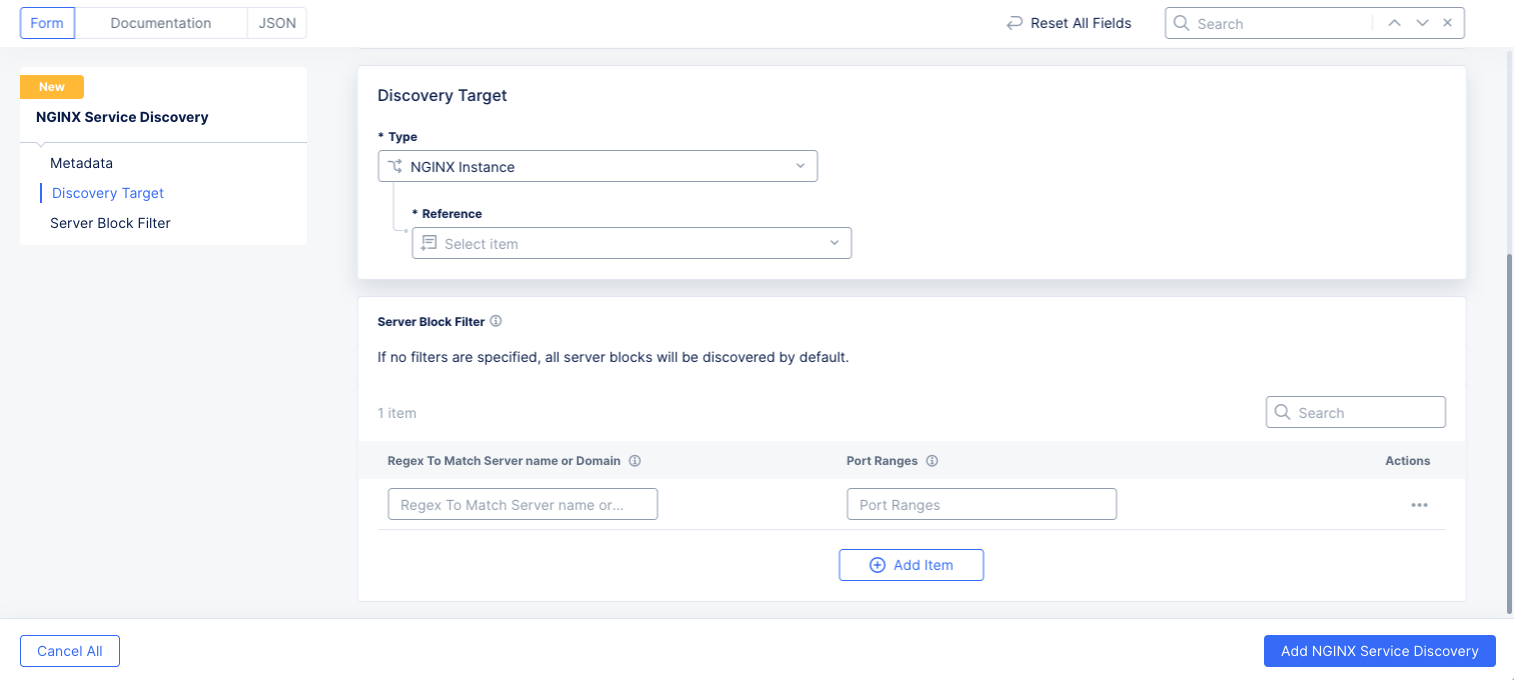
Figure: Select NGINX Server Block Filter
Step 4: Complete creating discovery object.
Select Add NGINX Service Discovery to create the discovery object.
Manage NGINX Service Discoveries
Once you have created NGINX Service Discoveries, you can see a list of your discoveries on the Service Discoveries page. In the Multi-Cloud App Connect workspace, navigate to Manage > Service Discoveries and then select the NGINX tab.
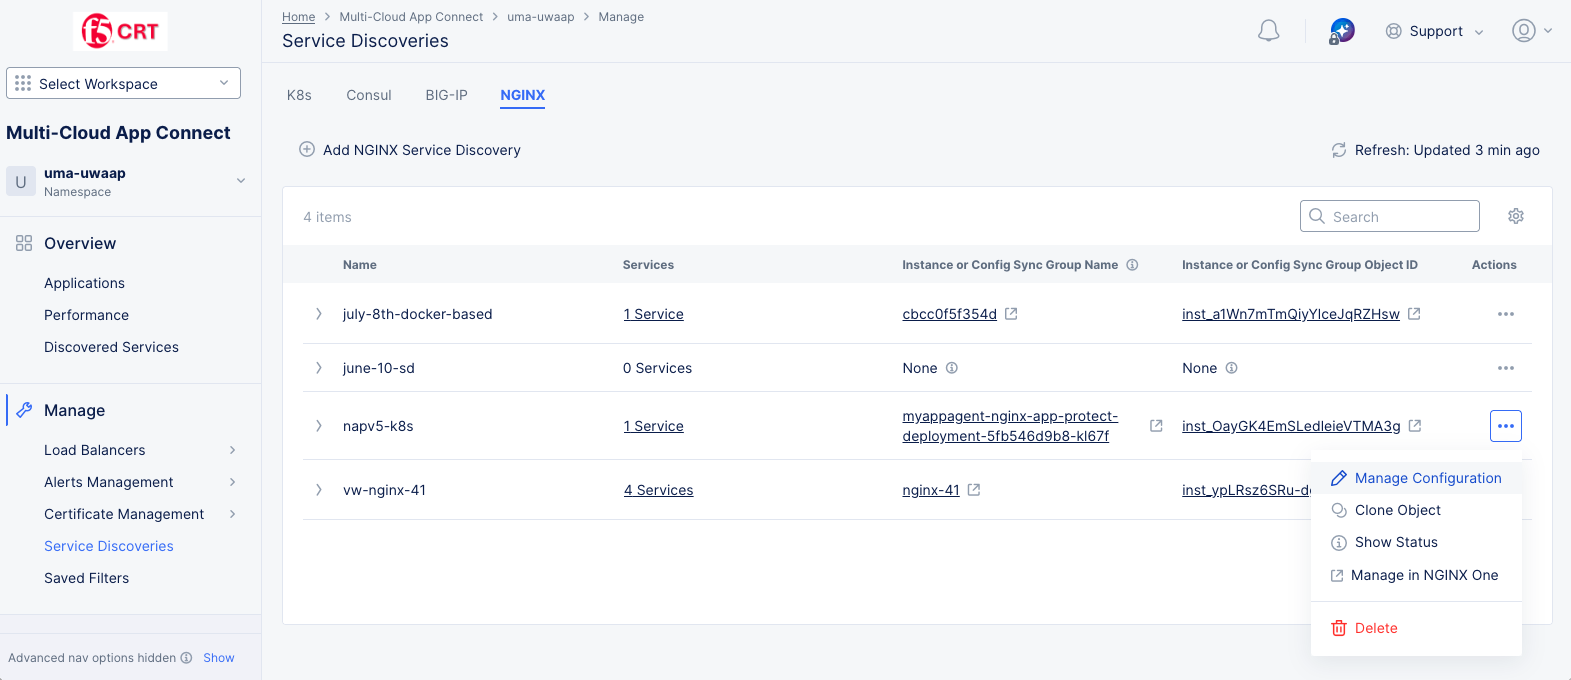
Figure: NGINX Service Discoveries page
Actions you can take
-
The Refresh option refreshes the information displayed on the page.
-
Select > at the left of a list item to display complete information of that service discovery in JSON or YAML format.
-
Enter text in the Search field to filter the table showing only lines that contain your entered text.
-
Select a non-zero value in the Services column to see that service or set of services in a table on the Discovered Services page:
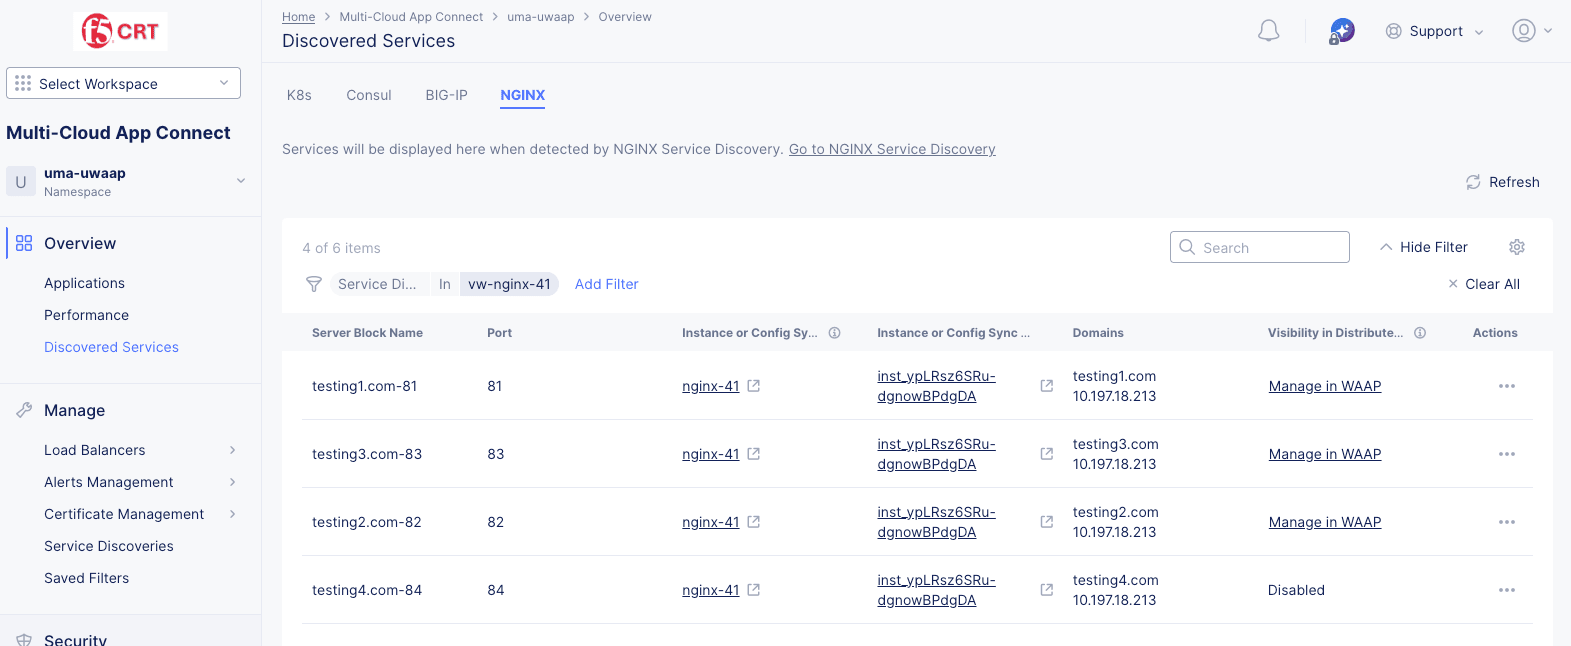
Figure: NGINX Service Blocks Table
- Select an item in the Instance or Config Sync Group Name or Instance or Config Group Object ID to see and manage that item in NGINX One (opened in another browswer tab).
- Select an item in the Visibility in Distributed Cloud column to manage that item in the Web App & API Protection (WAAP) service.
-
Select an item in the Instance or Config Sync Group Name or Instance or Config Sync Group Object ID to see that group in NGINX One.
-
Select ... in the Actions column to perform other operation on that line item, like Delete.
Note: For more information about NGINX One, see F5 NGINX One Console.
Monitor Security for NGINX Service Discoveries
You can monitor the security of your NGINX configuration useing the Web App & API Protection workspace. For more general information on monitoring security, see Monitor Web App & API Protection.
-
Log into Console and select Web App & API Protection.
-
Navigate to Overview > Security in the left navigation pane.
-
Select your namespace.
-
Select the All Delivery Resources tab on the **Security ** page.
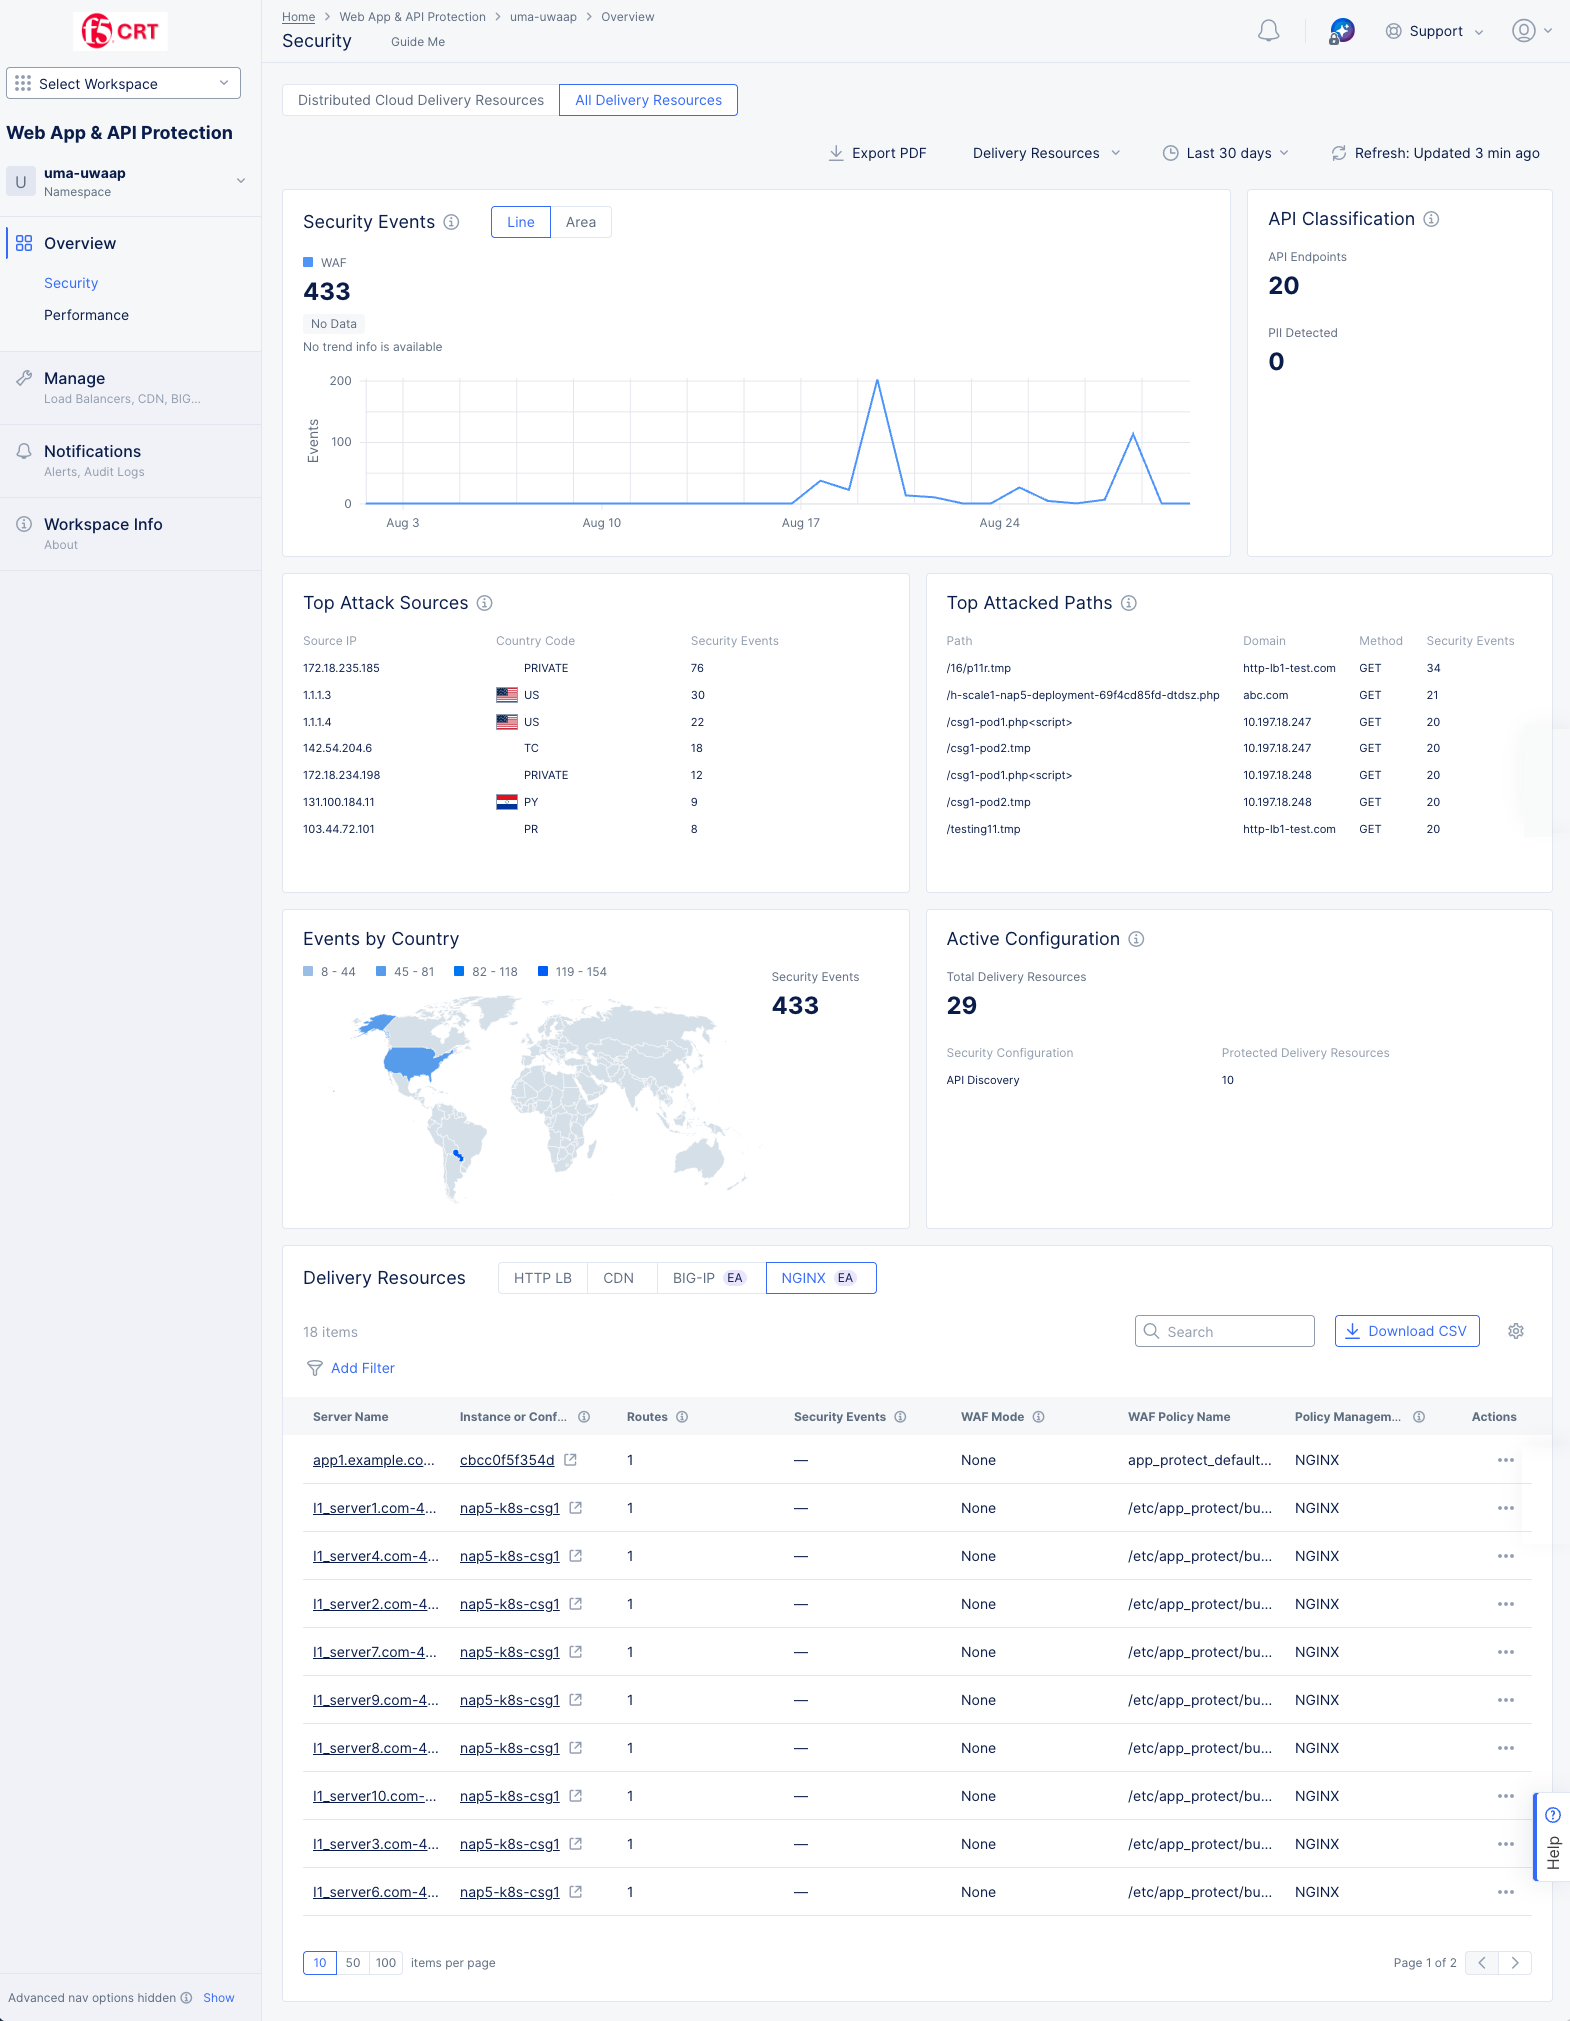
Figure: Security Dashboard
-
The information on this pages covers security related information for all delivery resources in yor namespace—it is not limited to your NGINX servers. To see NGINX server specific information, scroll to the bottom of the page, and in the Delivery Resources widget, select the NGINX tab (shown above at the bottom of the image.)
-
Select a server from the Server Name or Instance or Config Sync Group Name column.
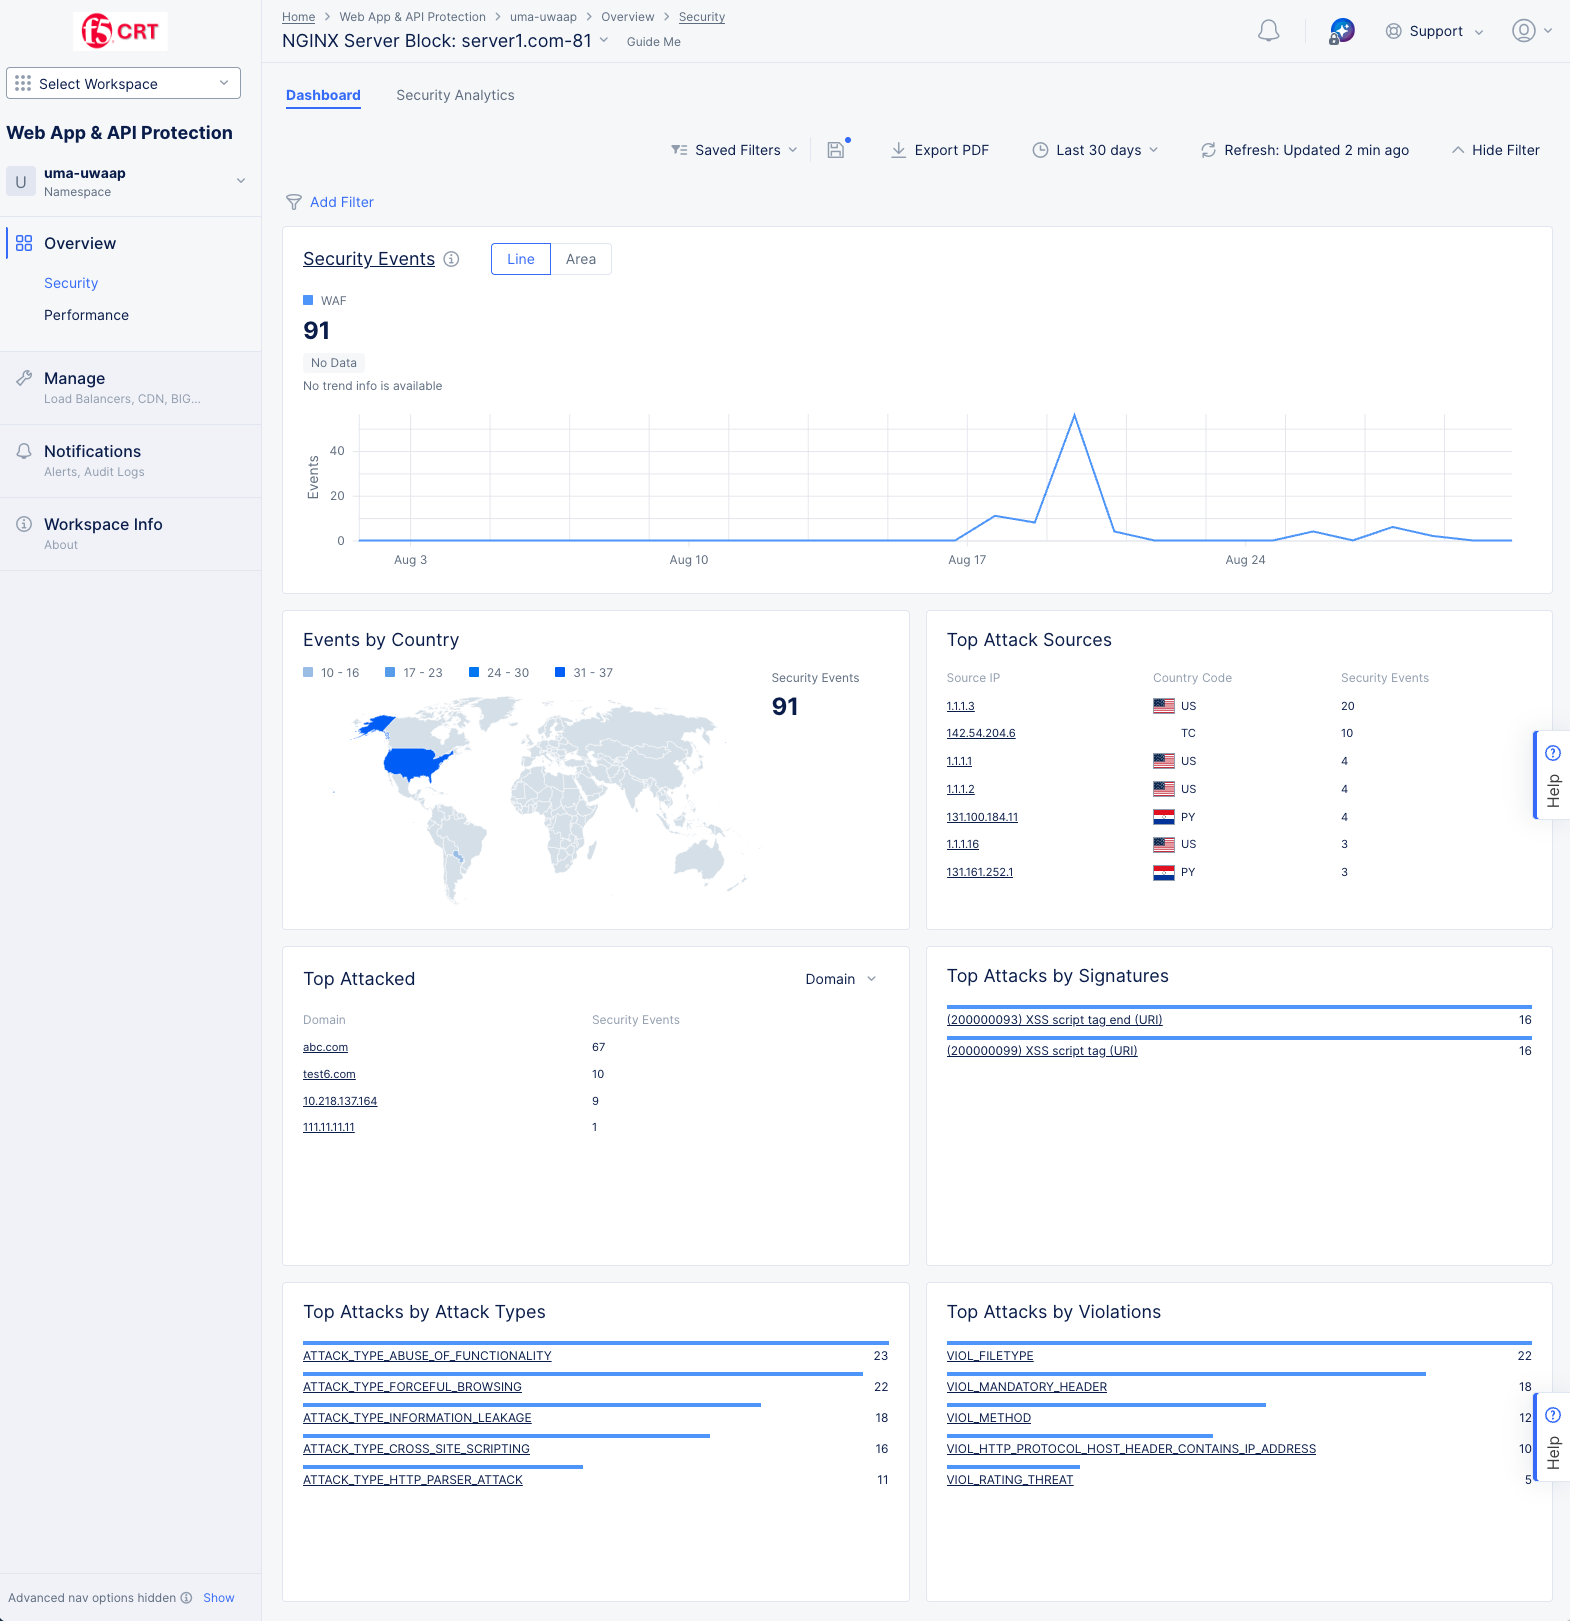
Figure: NGINX Security Dashboard
-
This page shows the security dashboard for the NGINX server block selected at the top of the page. You can view other servers using the NGINX Server Block drop-down menu.
-
At the top of the page, there are two tabs, Dashboard and Security Analytics, followed by some common options across all tabs.
Common Options
In the various monitoring tabs, one or more common options are available to use. These options are typically just below the tab names or at the top of tables and graphs. The following list describes commonly available options:
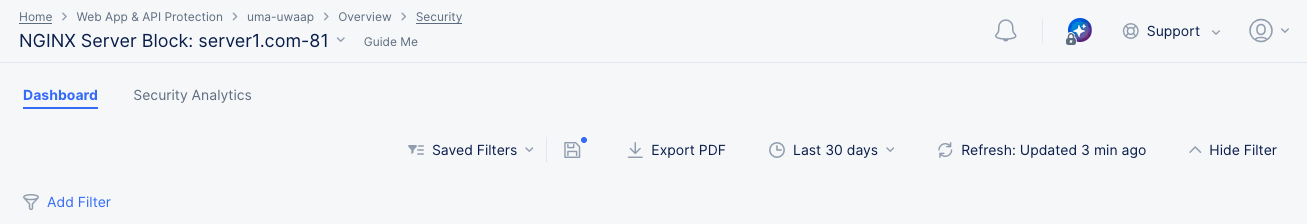
- The Saved Current Filter Settings option ( 💾 ) allows you to save current filter settings to a saved configuration. The blue dot in the icon indicates that you have changed the current filter state. Press the icon to update the existing state or save to a new named state. Note that colored checkboxes in graphs that select types of data to display are not part of the saved filter.
- The Saved Filters option shows the name of the current filter in use. If no filters are being used (the default state) the option will show Saved Filters. Click the Filter List icon to drop down some options:
- Enter a string in the Search field to find filter names with that string.
- Select My Filters or Others to change the list of filters displayed.
- Select a filter to apply from the list of filters.
- Select Restore Defaults to undo the current filter state and return to the defaults.
- Select View More Details to see a larger, more detailed list of saved filters.
- The Export PDF option allows you to save a PDF of this page.
- The Time interval selector ( 🕒 ) to apply from a list of intervals. You can also set a custom 24-hour interval.
- The Refresh option refreshes the information displayed on the page.
- The Hide Filter option lets you hide the filter discussed next. If the filter section is currently hidden, this option will display as Show Filter.
- The Add Filter option to apply filters to the displayed information.
- Enter a string into the Search field to limit the content displayed to entries containing that string.
- Some graphs offer a Forensics option, allowing you to apply specialty filters to the display using the Forensics side panel. Select a filter and select Apply to filter the display accordingly. You can also include more filter options by editing the default options and adding more from the displayed list.
Dashboard
The dashboard tab, shown above, displays by default and offers a snapshot view for entire security monitoring information for this NGINX server block. Dashboards show various security details such as security events by type and country, sources of events, and top attacks by various metrics.
The following list provides overview on the dashboard and the various sections it offers:
-
Security Events section shows the trend of security events over time. Select Line or Area to view the information in either a line or area graph. Hover over the graph to see information for that time. Select the section title, Security Events to switch to the Security Analytics tab analyze these security events.
-
Events by Country section shows the security events arranged in a map view. Select a location with hits to switch to the Security Analytics tab showing the events from that country.
-
Top Attack Sources section shows a list of the sources with the most security events. Select an item in the left column (IP address, ASN, or TLS Fingerprint) to examine those events in the Security Analytics tab.
-
Top Attacked section shows where the most security events have occurred by target. Use the drop-down menu in the upper-right corner switch between top domains or top paths being attacked. Select a domain or path from the list to view the security events for that particular target.
-
Top Attacks by Signature section shows which attacks as defined by their signature are being used against your server block. Attack signatures are rules or patterns that identify attack sequences or classes of attacks on a web application and its components. You can look up signatures in the F5 Attack Signature database by the signature ID or other details.
-
Top Attacks by Attack Types section shows the primary methods of attack that are being utilized. Attack types are the rules or patterns that identify attacks or classes of attacks on a web application and its components, such as Cross-site Scripting or Server Side Code Injection.
-
Top Attacks by Violations section shows the top ways your security policy is being violated. Violations occur when some aspect of a request or response does not comply with the security policy.
Security Analytics
Select the Security Analytics tab to see security related event data for the time frame specified below the filtering options. Security events are individual violations of policy that may be attacks. Beneath the graph, the security events page displays the events in a list showing summary information for each event.
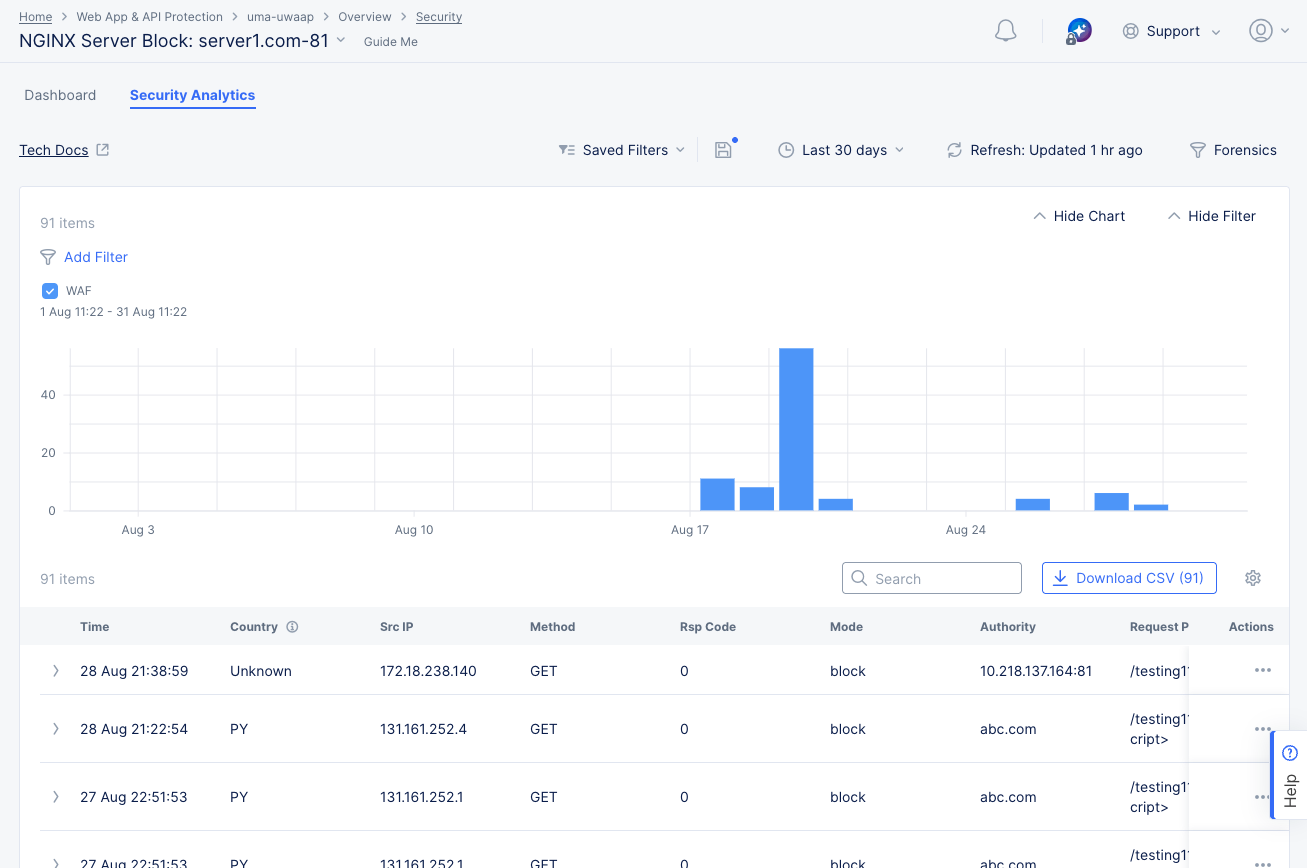
Figure: NGINX Security Analytics Page
Perform the following to analyze the security events:
-
Select the time interval drop-down list on the top right side of the page to select another time interval or specify a custom interval.
-
Select the Add Filter option and select a key-value pair to apply specific filters. You can select available key-value pairs, or you can choose a custom entry: Enter a new key, select Assign a Custom Key, select an operator, enter a value, and select Assign a Custom Value.
-
Hover over a bar in the chart to get summary information for that time frame.
-
Enter a string in the Search field to only display table entries containing that string. Note that the search function only looks at the summary information in the table, not the complete event record.
-
Select the Download CSV button to download a CSV file containing the full content of each event record shown in the table. Using the Add Filter option will reduce the table contents and therefore reduce the size of the CSV file subsequently downloaded, as indicated by the row count shown in the Download CSV button. Using the Search option merely hides non-matching rows, so it does not affect the CSV download.
-
Click the gear icon ( ⚙ ) to see different column data in the table.
Note: If you have enabled the Malware Protection or Threat Mesh feature, or if you have setup sensitive data exposure rules (masking), be sure the events table shows the Event Name column in order to see which security events were triggered based on these capabilities.
-
Select > at the left of a list item to display the Information tab for that event in a fully expanded view. Select the JSON tab to obtain the information in JSON format.
-
Select ... > Explain with AI to get an explanation of the event, the violation, information on the action(s) taken, and potential further actions.
Note: See Attack Signature States for information on the states of signatures displayed on the Security Analytics view.