Monitor DNS
Objective
This document provides instructions on how to monitor your F5® Distributed Cloud DNS services. Using the instructions provided in this document, you will be able to observe your DNS configuration in various ways, such as how many zones and load balancers you have, their statuses, and traffic measurements. You can look at aggregate information for all your zones and load balancers, or you can investigate individual zones and load balancers to explore performance or diagnose issues.
Prerequisites
- A Distributed Cloud Services Account. If you do not have an account, see Getting Started with Console.
- A DNS domain for your web application. Obtain a domain from the Internet domain registrar.
Monitor DNS Zone Performance
- In the DNS Management workspace, click Overview > Performance to see how your DNS setup is performing. The Performance page provides two tabs for different views.
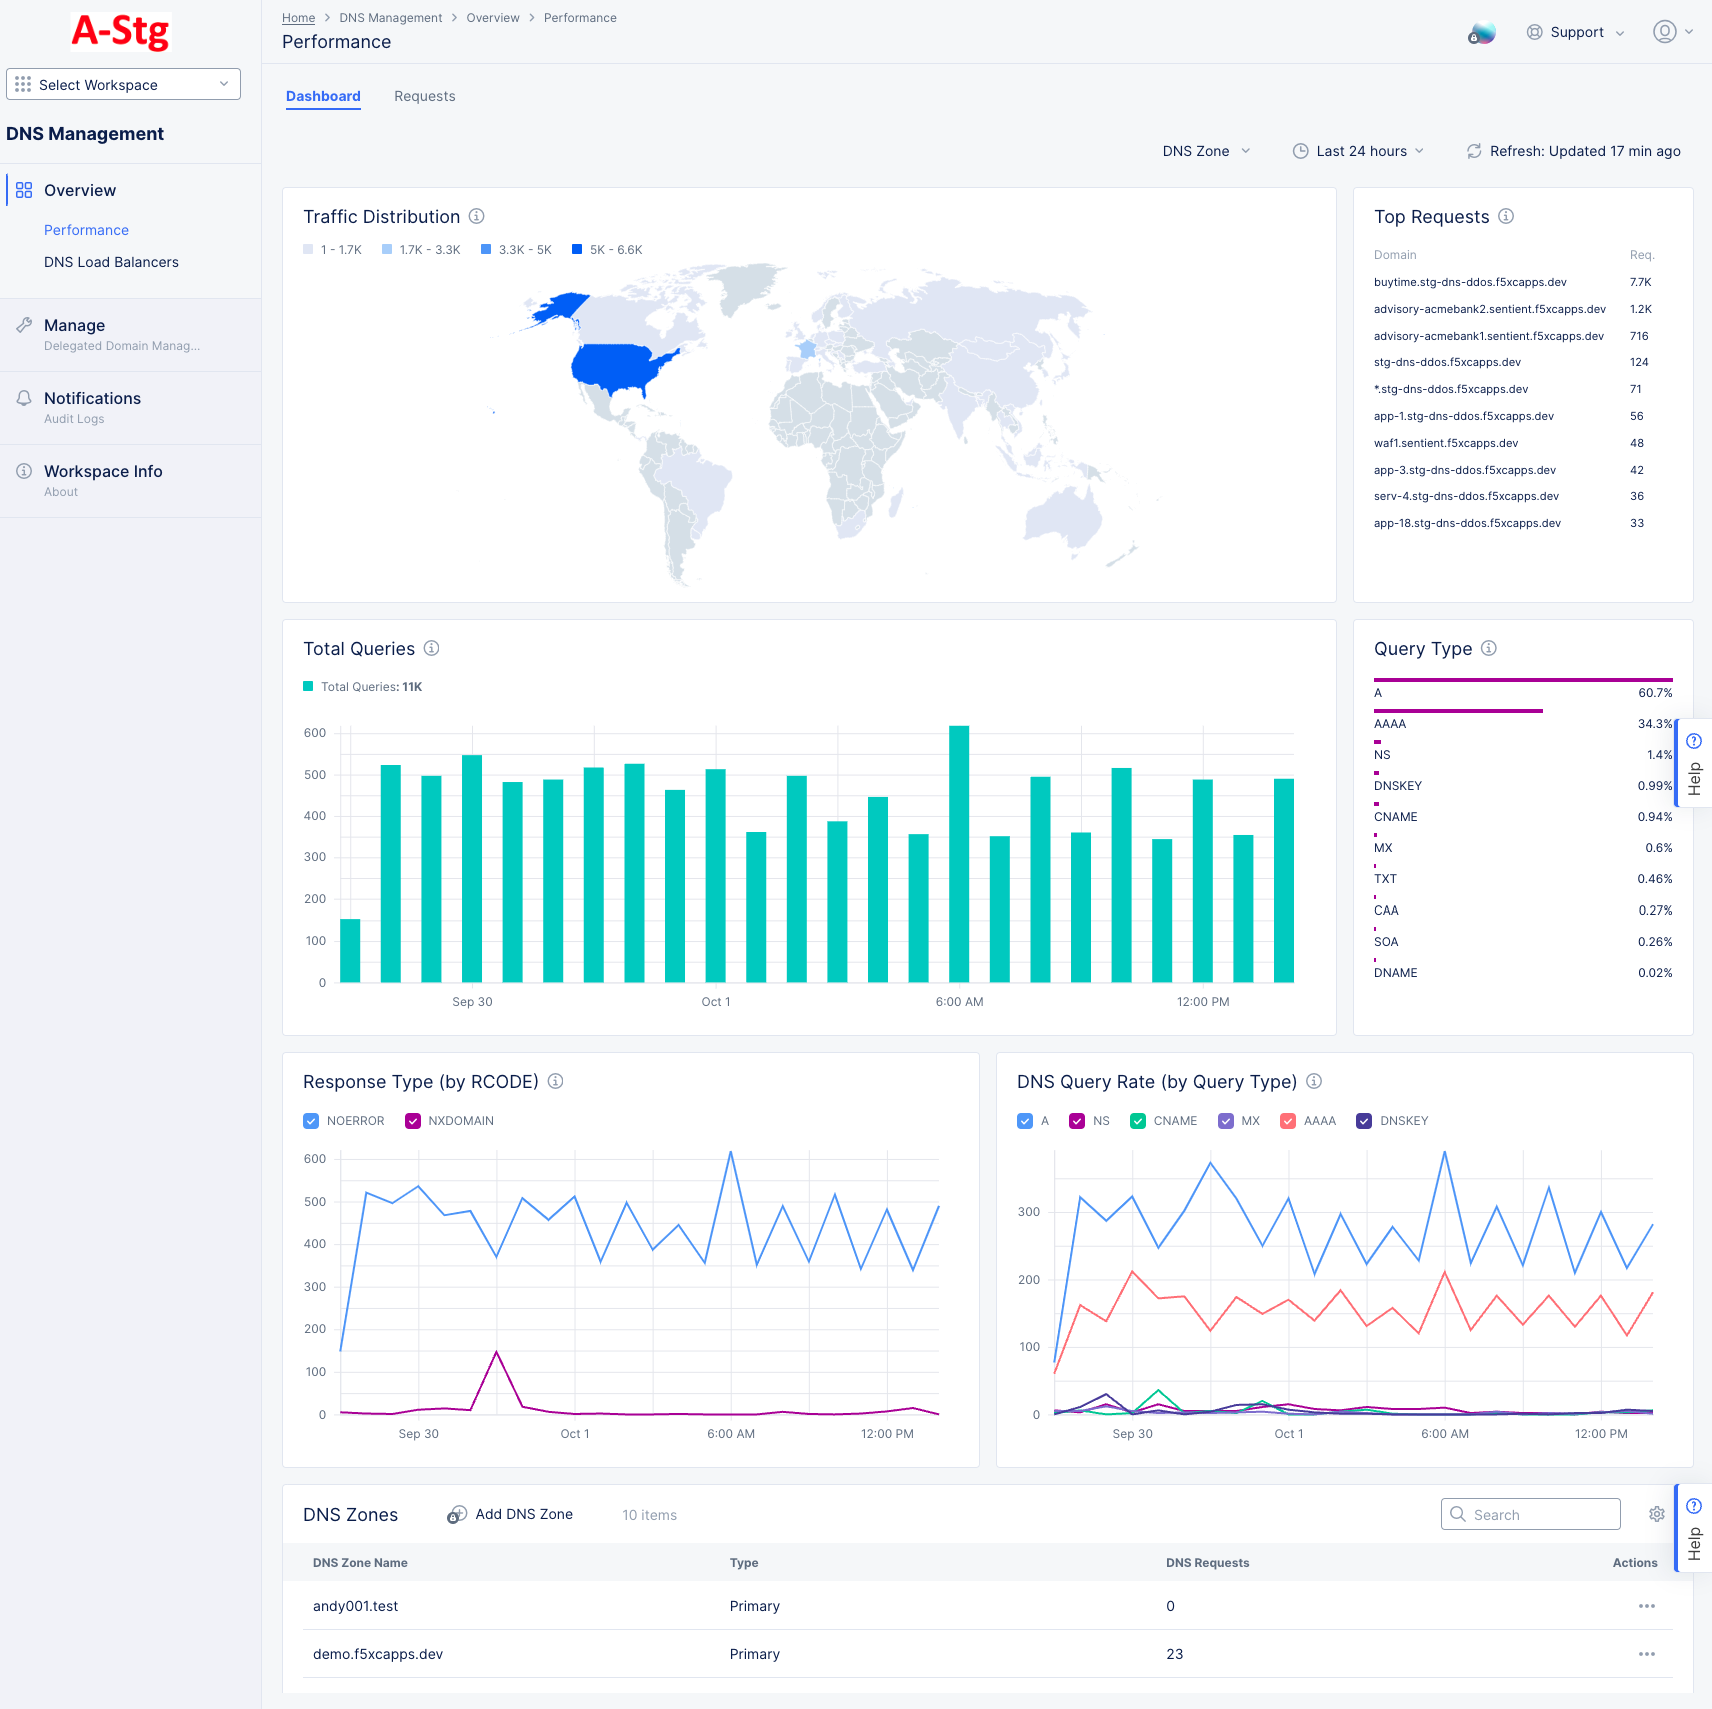
Figure: DNS Zone Dashboard
Dashboard Tab
The Dashboard tab provides an overview of the traffic through the load balancer over the time period shown in the right-justified, top bar of options.
DNS Zone Selector
- Use the DNS Zone drop-down menu above the widgets to select up to five zones or all zones (the default). The data in the widgets below will be specifically for the zone(s) you select.
- To return to seeing data from all zones, click Deselect All in the DNS Zone drop-down menu.
Dashboard Time Period
- The time drop-down allows you to specify the time period for the data shown, including both quick-pick options like Last 24 hours and the ability to specify a custom time period. Custom time periods are limited to ranges within the last 30 days.
- Click the Refresh button next to the time drop-down to update the contents of the dashboard manually.
Information Sections
-
The Traffic Distribution widget shows the distribution of DNS traffic per country. Hover over a colored country to see a pop-up showing the amount of traffic for that country.
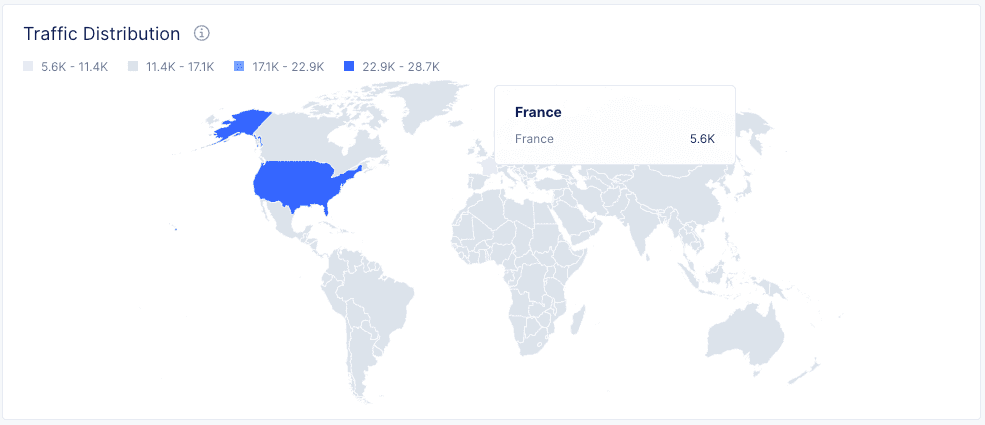
Figure: DNS Zone Traffic by Country
-
The Top Requests widget shows the number of requests for the most requested DNS records.
-
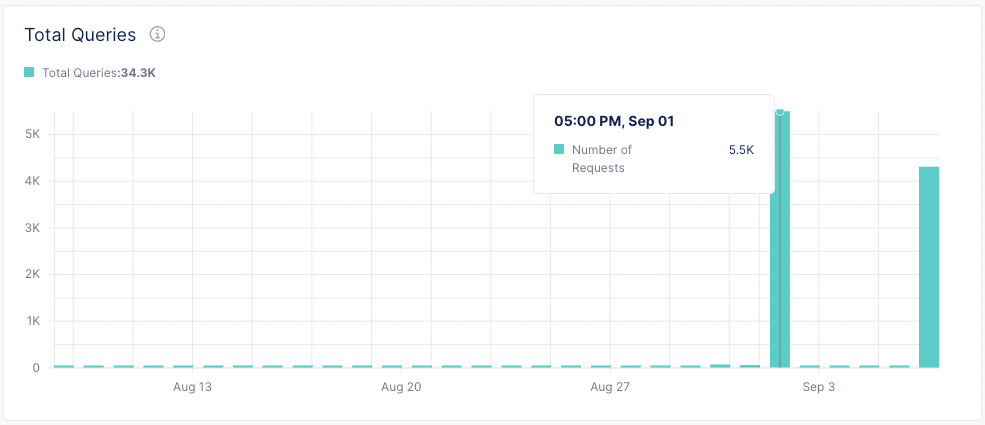
The Total Queries widget shows the distribution of DNS queries over time in a histogram. Hover over a bar (time period) to see a pop-up showing the number of requests for that time period.

Figure: Queries by Time Period
-
The Query Type widget shows the distribution of requests by query type.
-
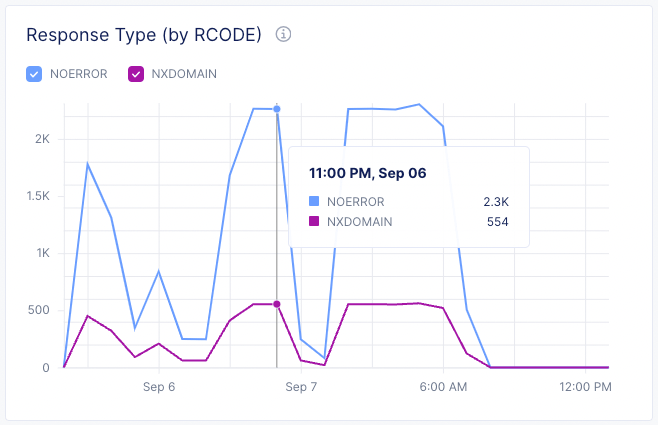
The Response Type (by RCODE) widget shows the response type quantities over time. Click an RCODE checkbox to show/hide that information in the graph. Hover over the graph to see the response count for that time.
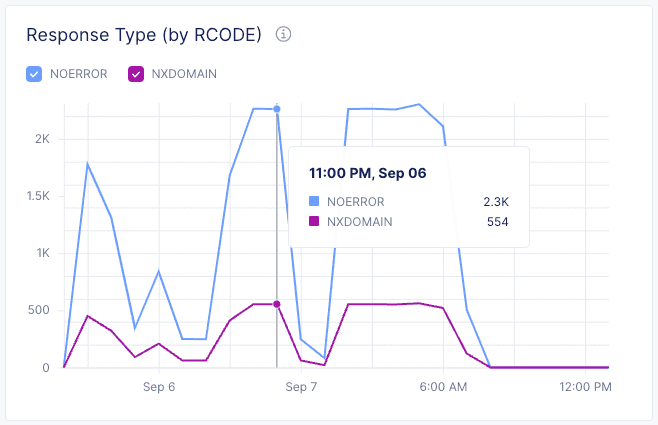
Figure: Response Type Trend
-
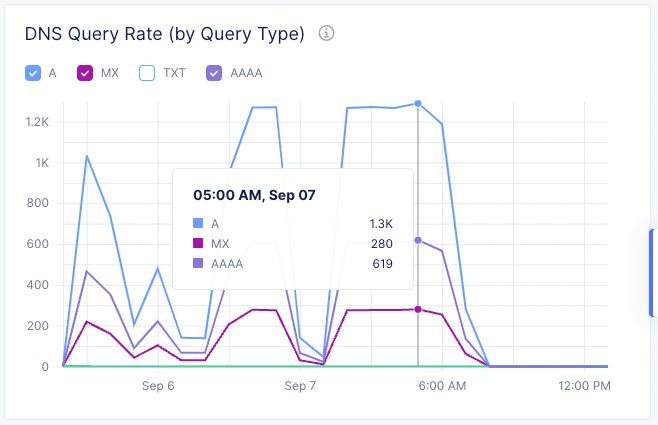
The DNS Query Rate (by Query Type) widget shows the query rate by query types over time. Click a query-type checkbox to show/hide that information in the graph. Hover over the graph to see the query type quantities for that time.

Figure: DNS Query Rate
-
The DNS Zones widget shows a table of your DNS zones.
- Use Add DNS Zone to add a new zone.
- Enter a zone name or partial name into the Search field, and only matching zone names will show in the table.
- Click ... > Manage Configuration to view zone configuration details. From there you can click Edit Configuration to make changes.

Requests Tab
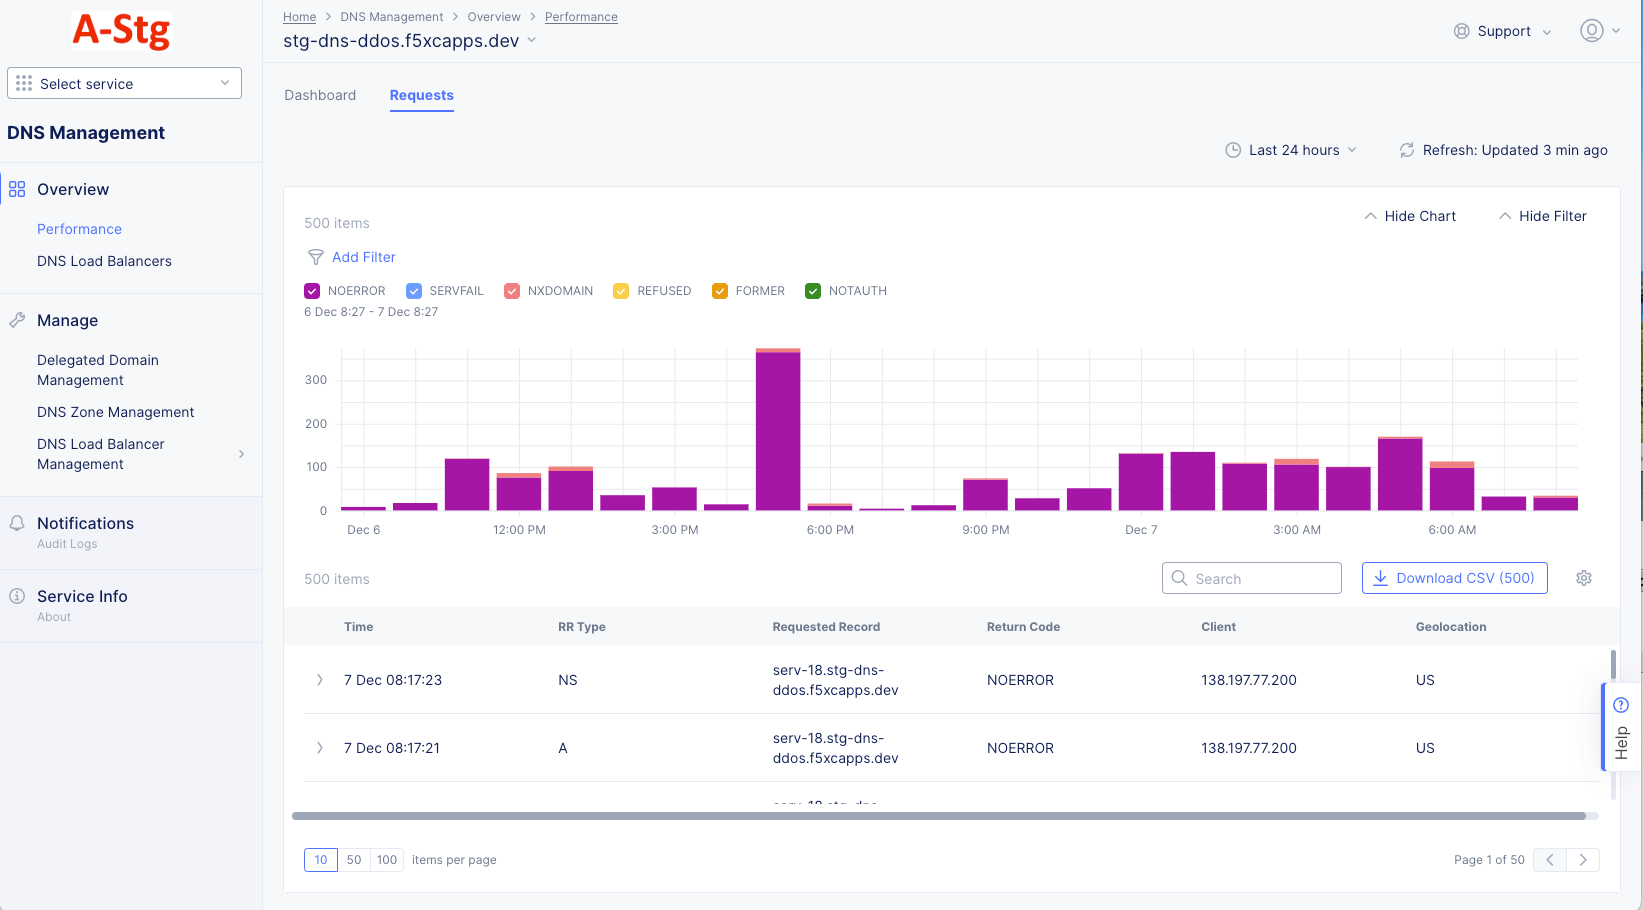
Figure: DNS Zone Requests
The Requests tab shows both request statistics (in the bar chart) and the specific requests received (in the table below). Use the Show/Hide Chart and Show/Hide Filter to customize the display.
DNS Zone Selector
- Use the DNS Zone drop-down menu above the widgets to select up to five zones or all zones (the default). The data in the widgets below will be specifically for the zone(s) you select.
- To return to seeing data from all zones, click Deselect All in the DNS Zone drop-down menu.
Requests Time Period
The dashboard contents are dependent on the settings in the right-justified, top bar of options.
- The time drop-down allows you to specify the time period for the data shown, including both quick-pick options like Last 24 hours and the ability to specify a custom time period. Custom time periods are limited to ranges within the last 30 days.
- Click the Refresh button next to the time drop-down to update the contents of the dashboard manually.
Filter Options
Filtering options are above the graph and affect what's shown in the graph.
- Use Add Filter to exclude or show only requests with specified characteristics. For example, select Geolocation, Not in, and US to show only requests that did not come from the United States. Note that if you do not have any requests from the US, then US will not be an option.
- Check or uncheck the colored checkboxes to quickly filter by return code. The color of the checkboxes correspond to the column colors.
Request Chart Options
- Hover over a bar in the chart to see specifics for that time period.
- Click and drag within the chart to zoom into that time period. This will also create a time-period link above the graph (and below the checkboxes) for the previous time period. Click on a link to return to that time period.
Request Table Options
- Use the Search field to only show entries containing that string.
- Use the Download CSV (#) to download a comma separated values (CSV) file of all requests in the table. The number in parentheses shows the number of entries in the table, which may be more than the number of entries shown on the page.
- Click the gear icon ( ⚙ ) to change the columns shown in the requests table.
- Click > at the left of a request in the table to see details for that request in JSON format. Once the JSON is shown, you can switch it to YAML by using the JSON drop-down menu.
- Click 10, 50, 100 below the table to change the number of table entries shown on the page.
Monitor DNS Load Balancers
- In the DNS Management workspace, click Overview > DNS Load Balancers to get an overview the health and status of your load balancers.
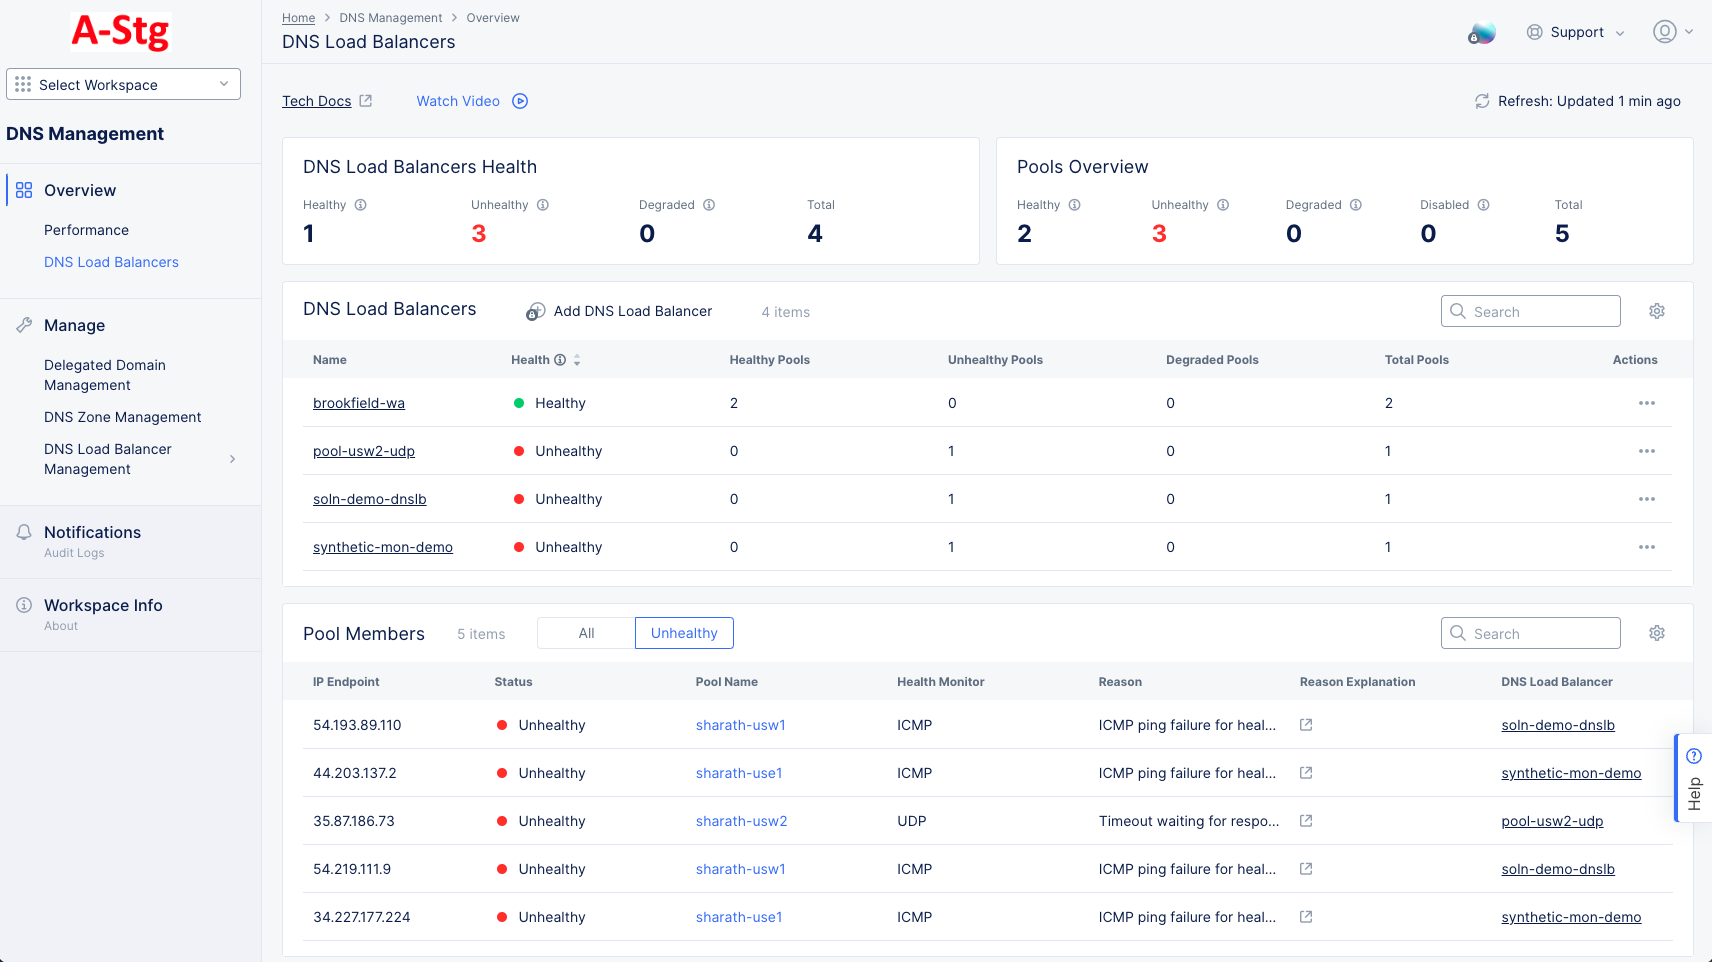
Figure: DNS Load Balancers Dashboard
Dashboard Specifics
-
The DNS Load Balancers Health and the Pools Overview widgets show the current health of all of your DNS load balancers and pool, divided between Healthy, Unhealthy, and Degraded.
-
The DNS Load Balancers widget shows a table of your load balancers.
- Click Add DNS Load Balancer above the table to create a new DNS Load Balancer. See Create DNS Load Balancer for more information.
- Click the gear icon ( ⚙ ) to change the columns shown in the table.
- Enter a string into the Search field, and only line items containing that string will show in the table.
- Click ... > Manage Configuration in the Action column for a specific load balancer to view or edit the configuration of that load balancer.
- Click the name of a DNS load balancer in the table to see the dashboard for that specific load balancer.
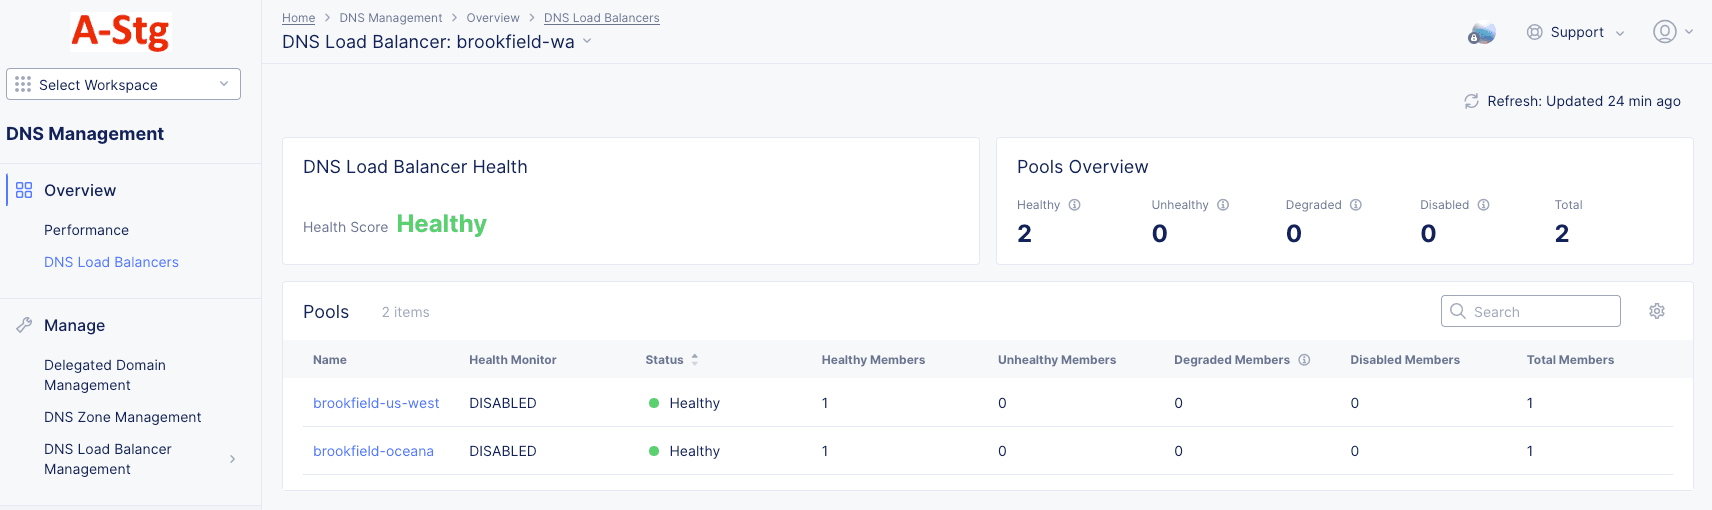
Figure: Specific DNS Load Balancer Dashboard
-
The Pool Members widget shows a table all your pool members.
- Use the All|Unhealthy selector to which pool members you see in the table.
- Click the gear icon ( ⚙ ) to change the columns shown in the table.
- Enter a string into the Search field, and only line items containing that string will show in the table.
- The Pool Name column shows which pool the pool member (endpoint) is a member of. Click the pool name for an endpoint to see configuration details for that pool in a sliding panel.
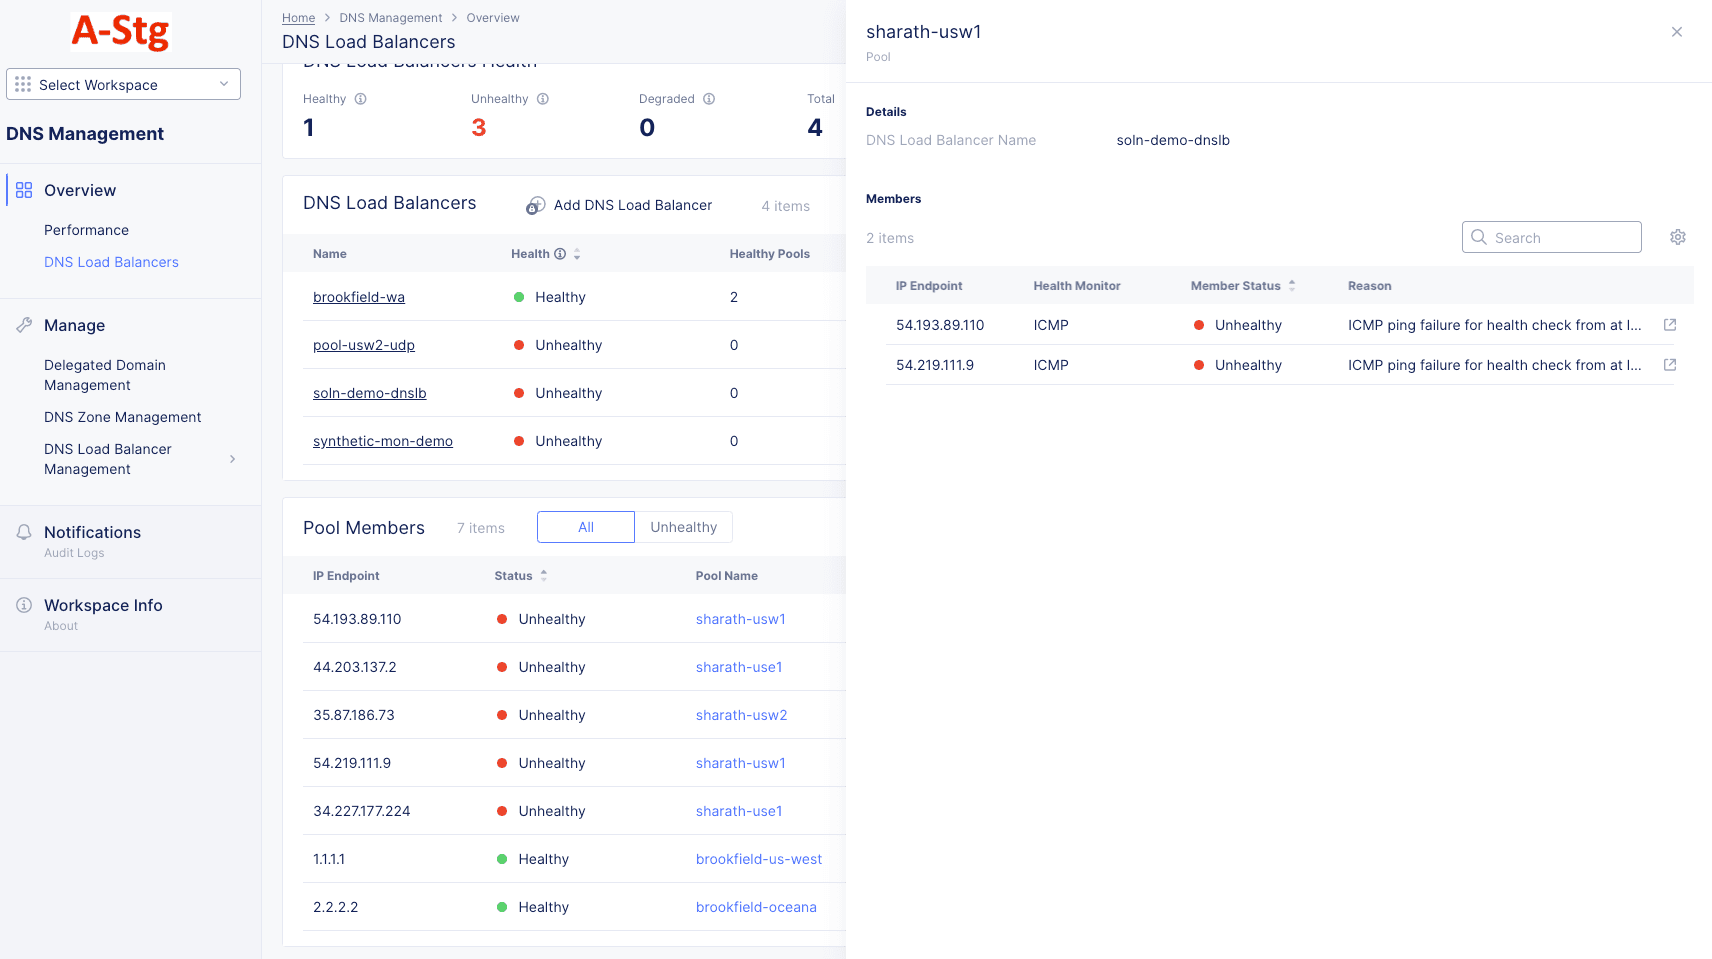
Figure: Specific DNS Load Balancer Dashboard
- The DNS Load Balancer column shows which load balancer the pool member (endpoint) is a member of. Click the load balancer name for an endpoint to see that load balancer's dashboard.

Monitor a Single DNS Load Balancer
- Click the name of the load balancer you want to observe in the DNS Load Balancers table.
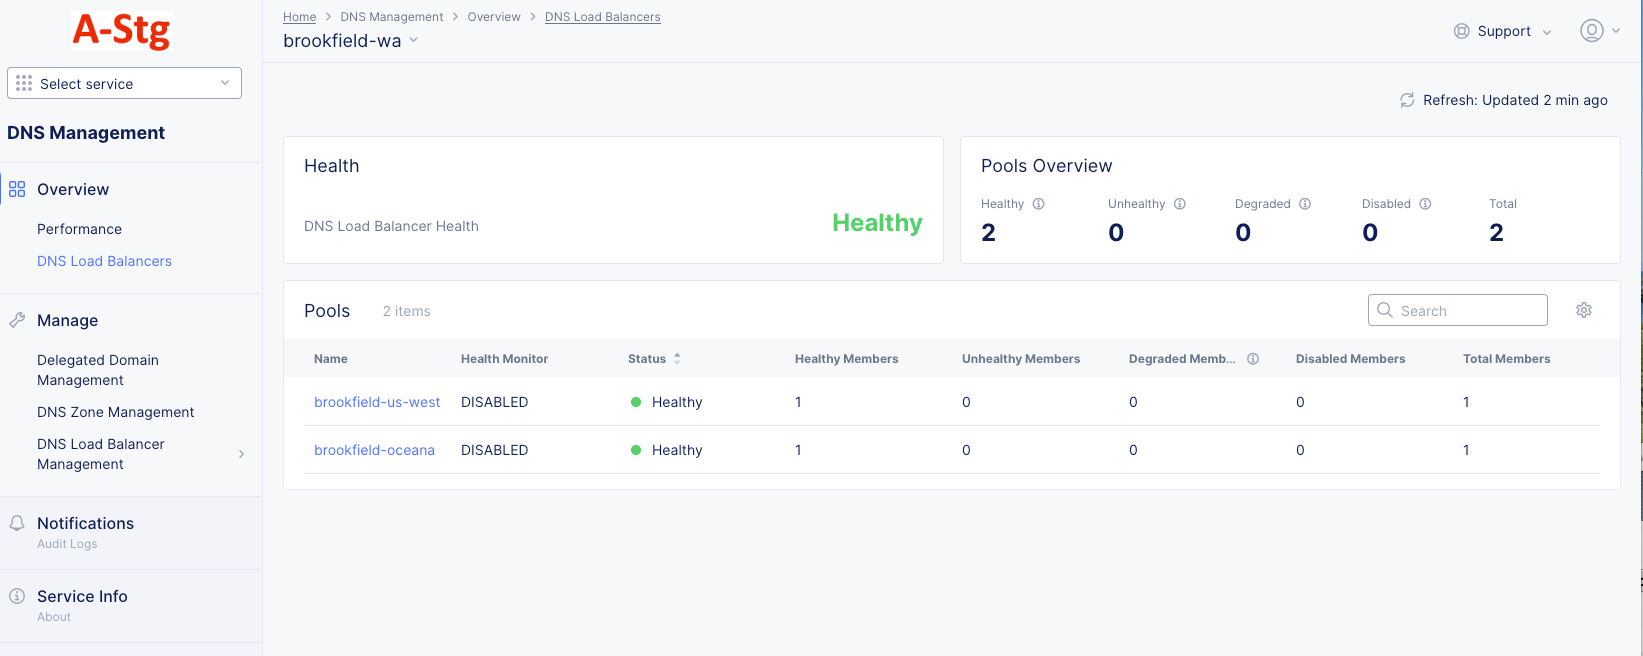
Figure: DNS Zone Dashboard
-
Click the Refresh button next in the upper right to update the contents of the dashboard.
-
The Health section shows the overall health of the load balancer.
-
The Pools Overview section provides overview health information for the pools in the load balancer.
-
The Pools table provides some details for each pool.
- Enter a string into the Search field to only show pool names containing that string.
- Click the gear icon ( ⚙ ) to change the columns shown in the pools table.
- Click on a column name to sort the table by that column.
- Hover over a column name to see the drag icon ( ⠿ ). Click and drag the icon to move the column.
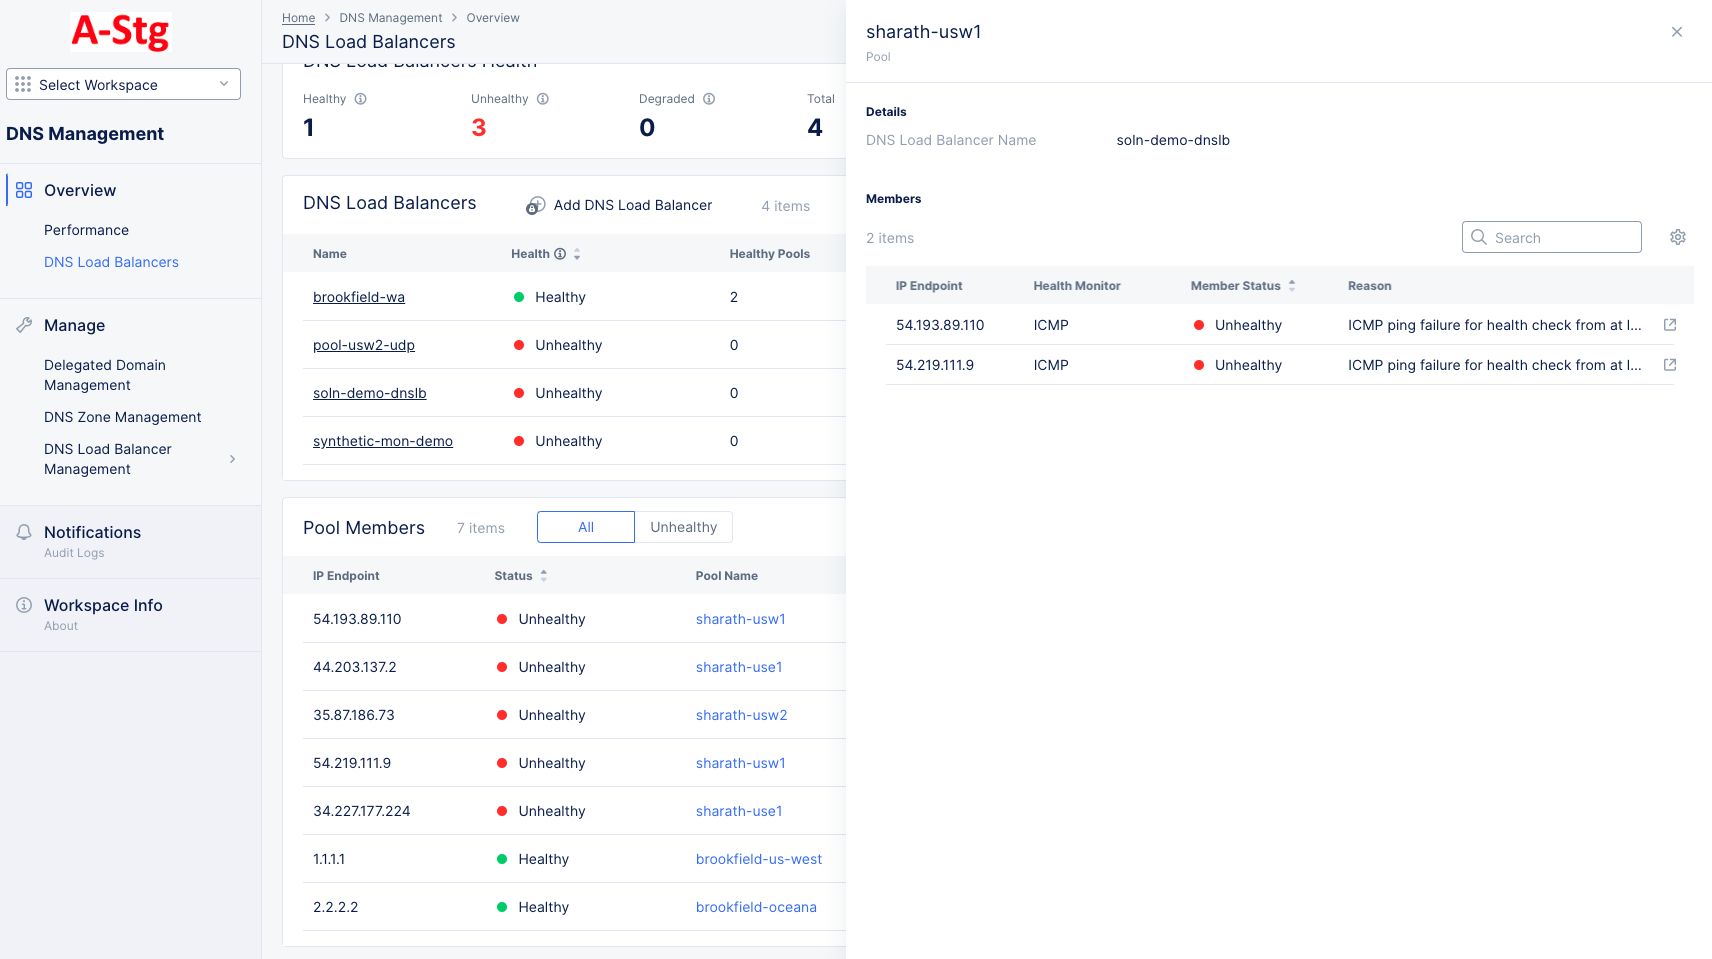
- Click on a pool name to get health information for individual members (IP endpoints) in that pool.
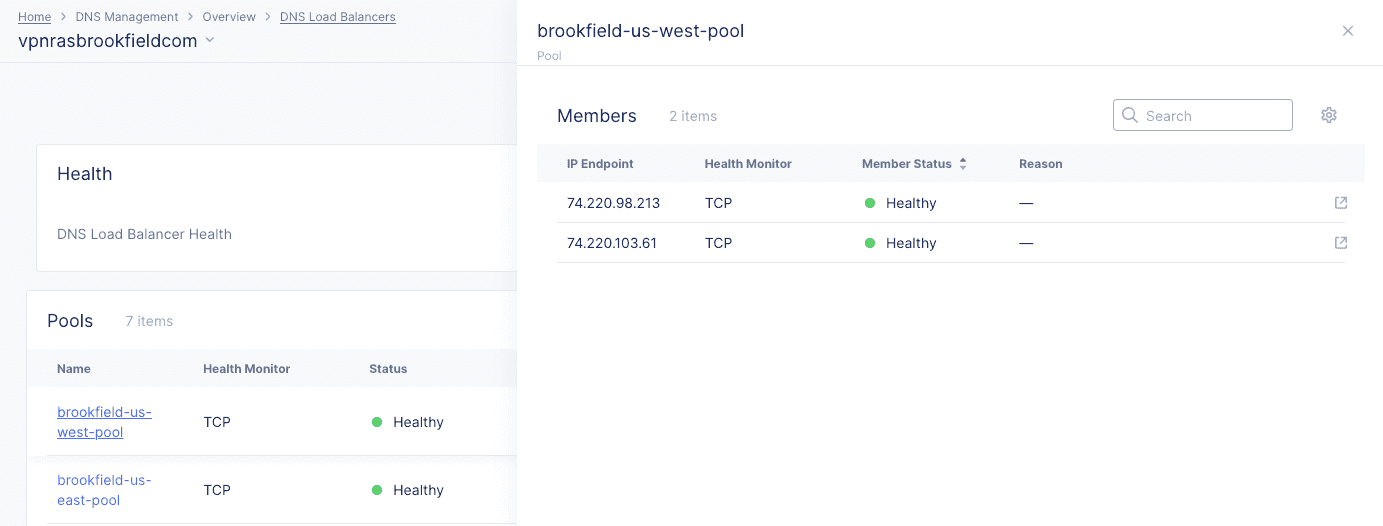
Figure: Pool Member Health
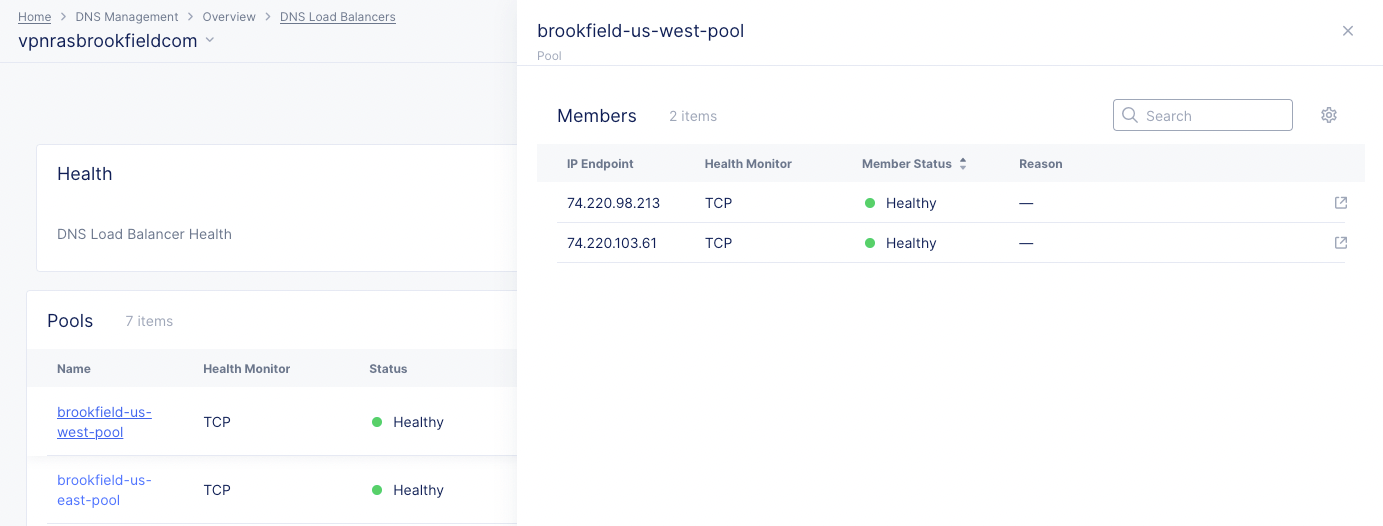
Note: Health checks are triggered every 30s.
- A pool member will be marked as unhealthy only when the third check fails.
- A pool member will be marked as healthy upon the first successful health check. In both cases, visibility will be reflected in the Console 60 to 90 seconds later.
See the following table for expected time taken for pool events:
| Member | Remove from Pool | Added to Pool | Console Reflection |
|---|---|---|---|
| Unhealthy | 1m 30s | N/A | 2m 30s to 3m |
| Healthy | N/A | 30s | 2m to 2m 30s |
Monitor DNS Zones
In the DNS Management workspace, click Overview > DNS Zones to get an overview the health and status of your DNS Zones.
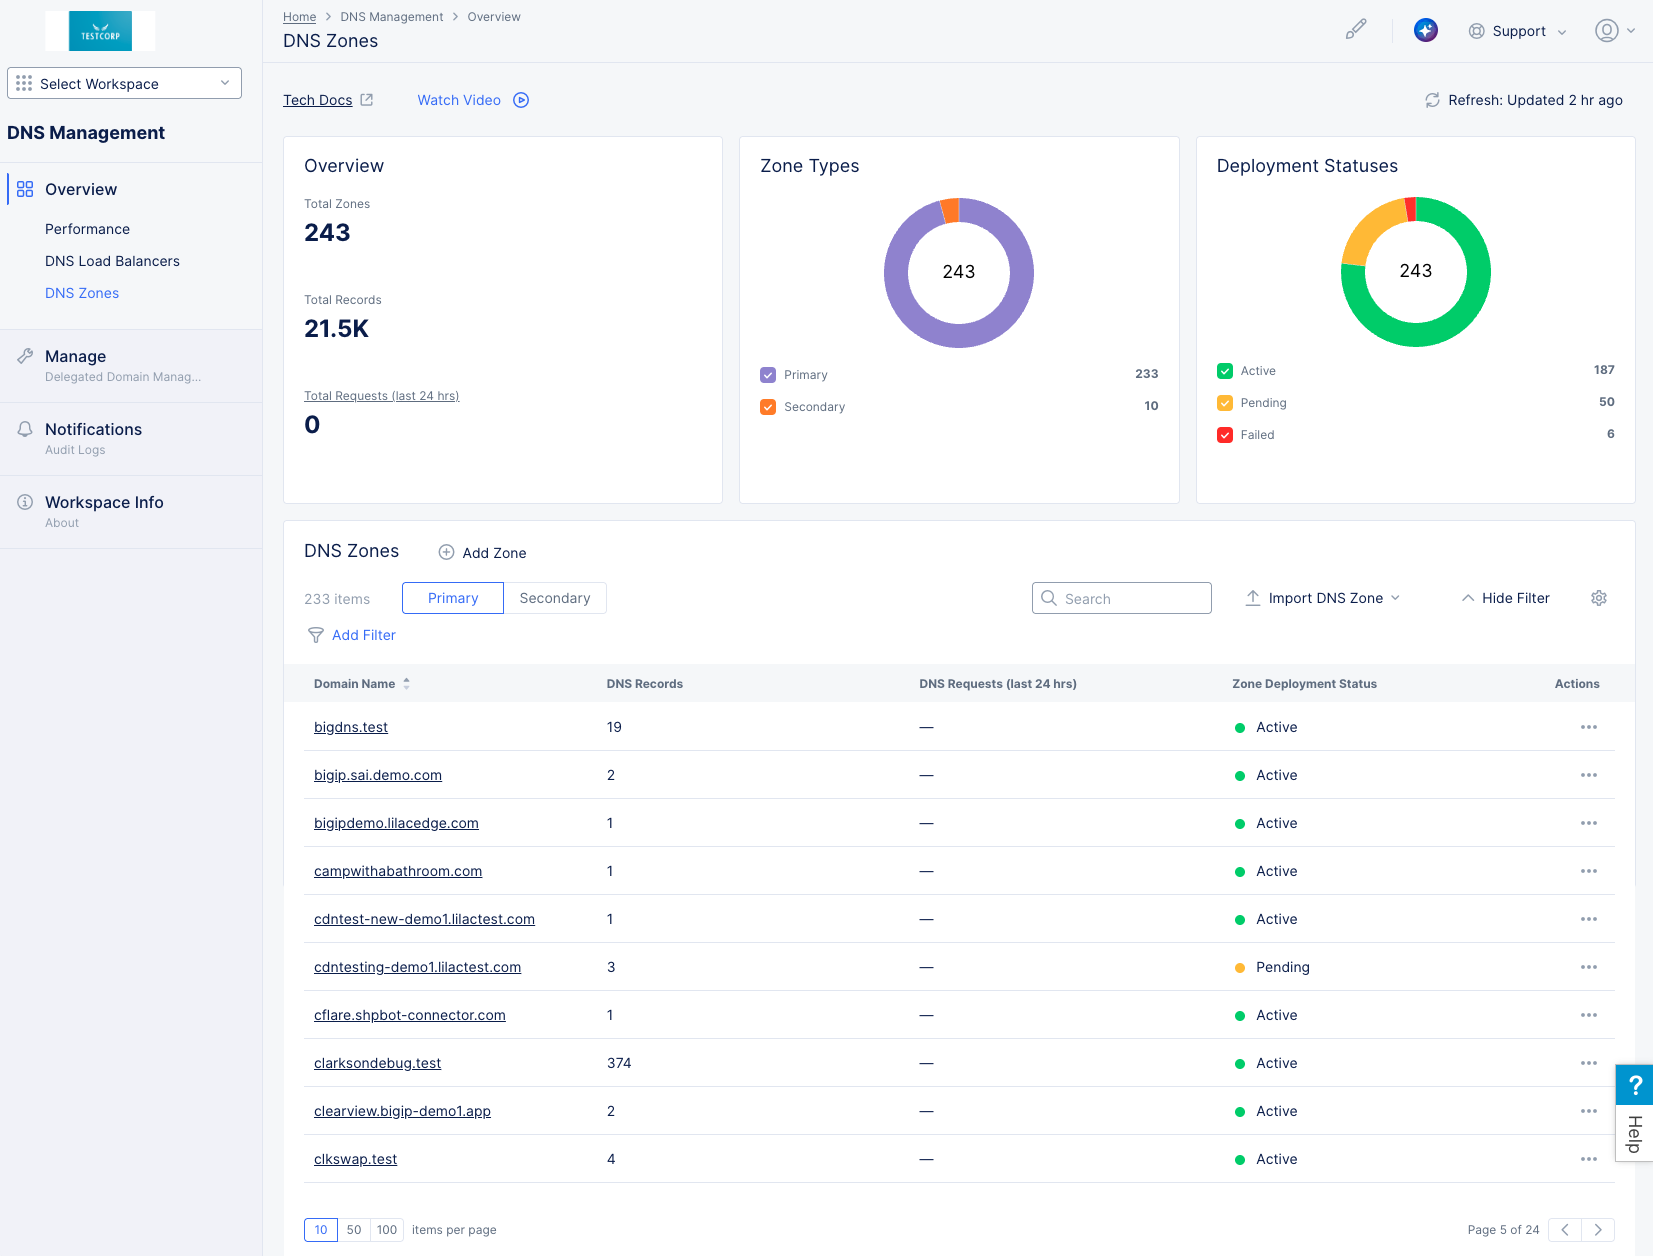
Figure: DNS Zones Dashboard
Dashboard Specifics
-
The Overview widget shows provides a top-level view of your DNS zones, including the total number of zones, the total number of zone records, and the total number of requests received over the past 24 hours.
-
The Zone Types widget provides a graphical and numerical view of how many zones are primary vs. secondary.
-
The Deployment Statuses widget shows how many zones are in an active state, pending state, or have failed.
-
The DNS Zones widget shows a table of your zones.
- Click Add Zone above the table to create a new DNS Zone. See Manage DNS Zone for more information.
- Use the zone-type selected to see Primary or Secondary zones in the table.
- Enter a string into the Search field, and only line items containing that string will show in the table.
- Use the Import DNS Zone to import a new zone. See Manage DNS Zone for more information.
- Click the Hide Filter/Show Filter toggle to show table filtering options.
- Click the gear icon ( ⚙ ) to change the columns shown in the table.
- Click on the Add Filter option and select a key-value pair to apply specific filters. You can select available key-value pairs. You can also choose a custom entry.
- Click ... > Manage Configuration in the Action column for a specific zone to view or edit the configuration of that zone.
- Click the domain name of a zone in the table to see the dashboard for that specific load balancer.

Figure: Specific DNS Zone Dashboard
Monitor a Single Zone
- Click the domain name of the zone you want to observe in the DNS Zones table.
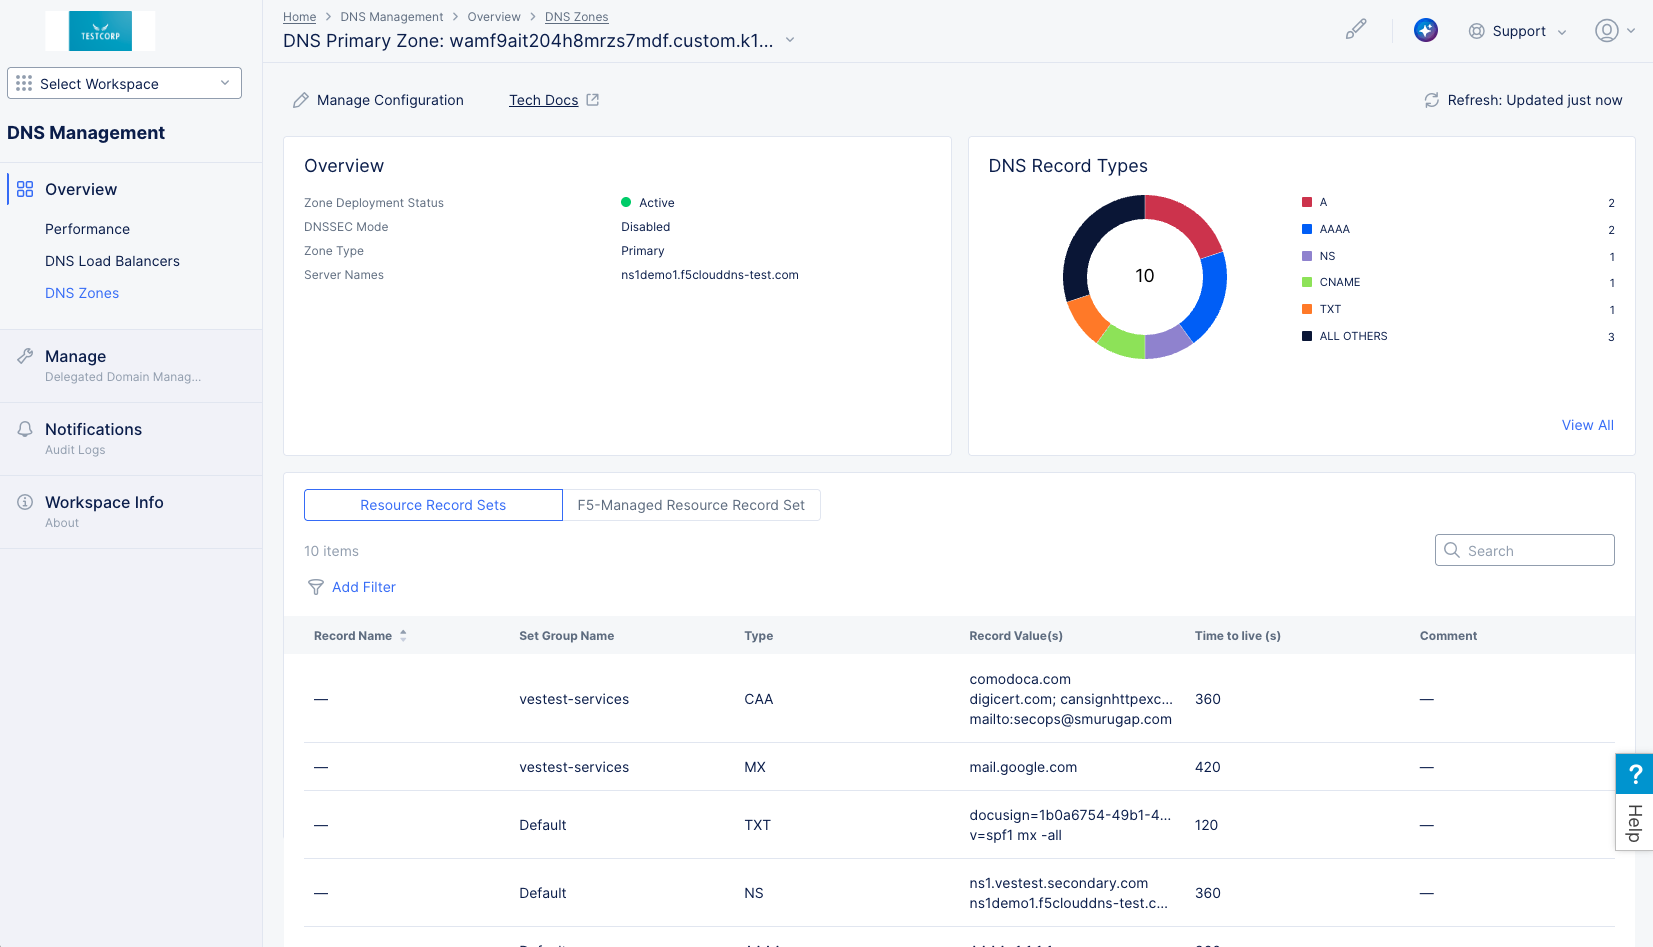
Figure: Specific DNS Zone Dashboard
-
The DNS single zone page shows an overview of the zone, including health and DNS Zone specifics. The following describes the actions you can take on this page.
-
The Overview widget shows the zone's deployment status, DNSSEC mode, zone type, and server name(s).
-
The DNS Record Types widget provides a graphical and numerical view of how many DNS records are used in this zone as well as what types are used. Click View All to see all the quantities of all records used in the zone.
-
The Resource Record Sets table shows all the records in this zone. The columns show the Record Name, Type of resource record, the Record Value(s), Time to live (s), and any Comment.
- Use the selector at the top to show the F5-Managed Resource Record Set.
- Enter a string into the Search field, and only line items containing that string will show in the table.
- Click on the Add Filter option and select a key-value pair to apply specific filters. You can select available key-value pairs. You can also choose a custom entry.