View Bot Defense Dashboards and Reports
Important: Bot Defense Self-Service Policy Management is an Early Access feature.
F5 Distributed Cloud Bot Defense includes multiple ways to view detailed information about the traffic that Bot Defense analyzes. Automated Threat Summaries deliver insights to you automatically each month, while a variety of dashboards provide you with instant, detailed access to analysis of your data.
Note: Bot Defense dashboard and report widgets display the message, "No Data" when there is no data to display. Make sure Bot Defense is configured correctly and that you select a time period for the dashboard or report for which you have collected data.
Automated Threat Summaries
Automated Threat Summaries are emailed reports that summarize your monthly network traffic and Bot Defense activity. Automated Threat Summaries include information about the percentage of your traffic that is automated, the numbers of known and bad bots detected, the number of human visitors to your Bot Defense infrastructures and endpoints, and a breakdown of your overall web traffic that is analyzed by Bot Defense.
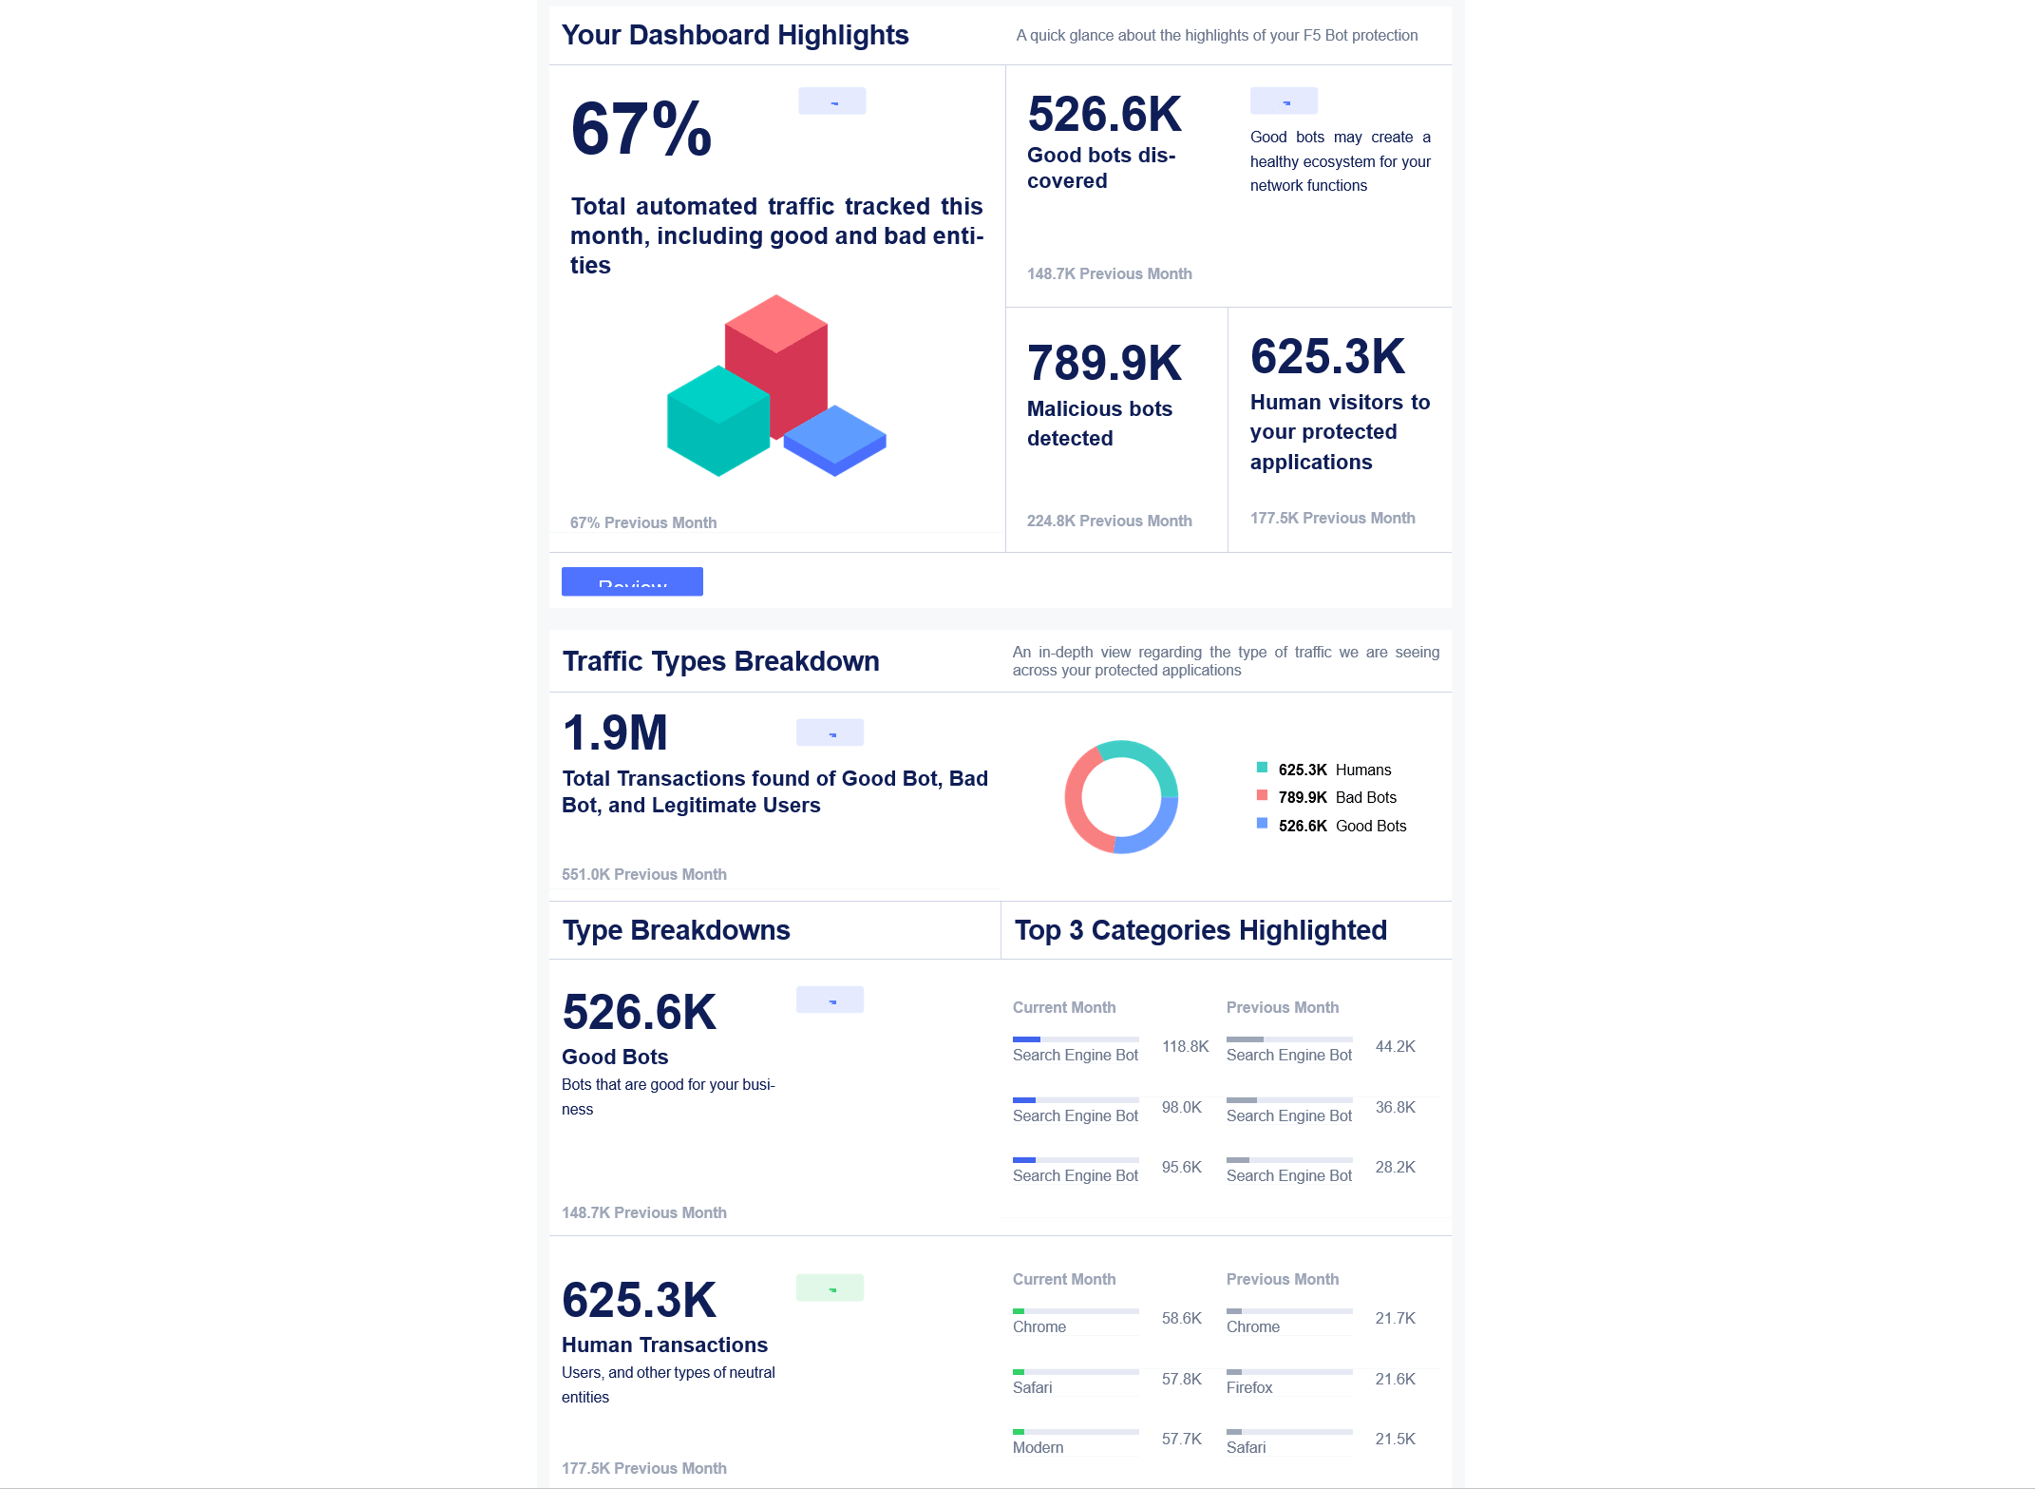
Figure: Automated Threat Summaries
To enable Automated Threat Summaries:
- From the Distributed Cloud Console Home page, select Bot Defense.
- From the Bot Defense navigation menu, select Manage > Reports > Reports Management and then select Add Report.
- Enter a Name for the report and then, from the Report Type drop-down menu, select Bot Defense.
- Select Add Item and then choose the User Group to which you want to send the report. If you need to create a new user group to receive the report, see Users.
- Select Add Report.
Bot Defense Dashboard
The Bot Defense dashboard is a snapshot of all human and bot activity in the web traffic analyzed by Bot Defense for a specified time period. You can view the Bot Defense dashboard in Bot Defense and in Web App & API Protection:
To view in Bot Defense: In the Bot Defense navigation menu, select Overview > Monitor.
To view in Web App & API Protection:
-
In Web App & API Protection, from the navigation menu, select Overview > Security.
-
In the Delivery Resources widget, from the list of HTTP load balancers, select the name of the load balancer you want to view and then select Bot Defense.
-
To view additional Bot Defense data for this specific load balancer, such as human traffic by geographic region, an overview of specific bad bot events impacting your infrastructures, and information about the intent of an attack, select View in Bot Defense.
Note: When you view the Bot Defense dashboard in Web App & API Protection, data is filtered by domain name rather than by load balancer ID. If you configure multiple domain names on a load balancer, the data displayed for that load balancer in the Bot Defense dashboard in Web App & API Protection may differ from the data displayed in the standalone Bot Defense dashboard.
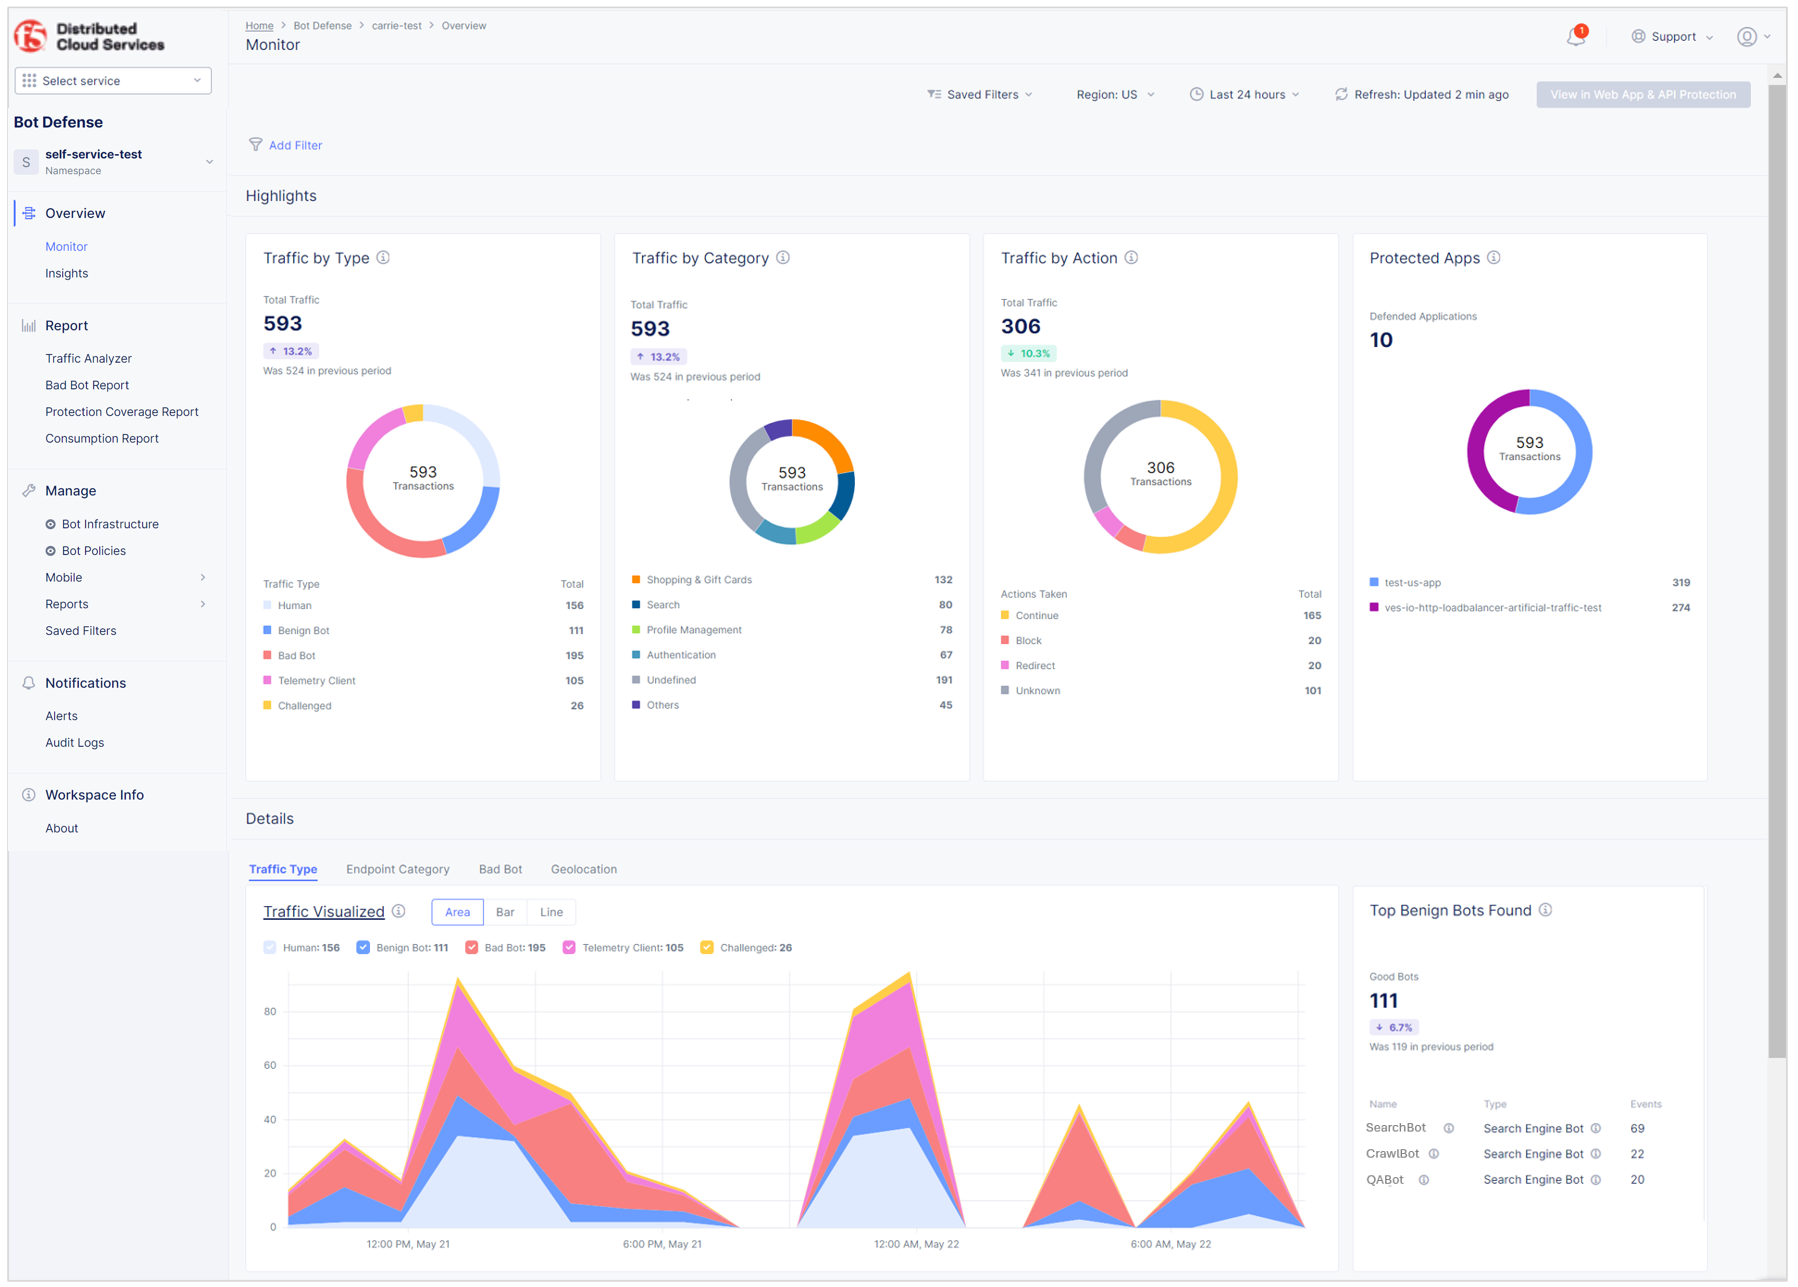
Figure: Bot Defense Dashboard
By default, the dashboard displays data from the last six hours. You can customize the time period and the region that displays. You can also save and share filters that you apply to the dashboard.
The Bot Defense dashboard includes the following information:
-
Traffic By Type: The total number of transactions in the selected time window categorized by the following traffic types:
- Human: Human or automated traffic that is evaluated but not blocked by Bot Defense.
- Known Bot: Automated software programs for which F5 has verified the authenticity and intent that perform useful tasks, such as test tools and search engine crawlers.
- Bad Bot: Bots that are malicious, often causing harm to legitimate users, businesses, or organizations.
- Allowlisted: Traffic from IP addresses that are included in your Bot Allowlist Policy.
- Telemetry Client: Traffic that comes from loading the Bot Defense JavaScript in application pages or from configuration requests (fetches) from mobile applications integrated with the F5 Mobile SDK.
- Challenged: Traffic from challenges served to clients on protected GET transactions to determine if the clients are human or automated.
- Unevaluated: Traffic that is proxied through your bot infrastructure but not evaluated by Bot Defense.
Bot Defense continuously evaluates traffic behavior in real-time to distinguish between legitimate human users and automation. As Bot Defense inspects traffic characteristics and aggregates signals interactions, the system dynamically recognizes patterns and accurately identifies evasive automated attacks. As soon as the traffic's true intent emerges, Bot Defense applies the designated mitigation.
Hover over the donut graph for percentage information for each type of traffic.
-
Traffic by Category: The traffic detected for each endpoint category for the selected time-period. Hover over the donut chart to see percentage information for each category.
-
Traffic by Action: Total number of automated traffic events that reach your protected endpoints and how many times each mitigation action is applied to these events. Hover over the donut chart to see percentage information.
-
Traffic by Bot Infrastructure: A breakdown of all your traffic to each of your Bot Defense infrastructures. Hover over the donut chart to see percentage information.
Use the dashboard controls to view additional data.

Figure: Bot Defense Dashboard Tabs
Traffic Type
- Traffic Visualized: Total number of events impacting the endpoints you protect with Bot Defense over the specified time range as an area chart, bar graph or line graph. Hover over the charts for information about a specific time.
- Top Known Bots Found: Top known bots that are visiting your Bot Defense infrastructures, including the name and type of bot and total events for each bot.
- Bot API Latency Across Bot Infrastructure: Information about traffic latency measured between the Bot Defense infrastructure and origin server, including average time, infrastructure name, latency for each infrastructure, and number of transactions.
Endpoint Category
- Category Traffic Visualized: Shows the traffic detected per endpoint category for the time-period selected. Hover over the chart to see totals and percentages for a specific time.
- Top Endpoint Labels: Shows the top 10 endpoint labels on which traffic was detected, and the percentage of traffic detected on the endpoint label in relation to all traffic detected on your system.
- Top Visited Endpoints: Shows the five endpoints that are being attacked most frequently by bad bots. The table includes the host name, endpoint path, and number of malicious requests in the selected time period.
Bad Bot
- Actions Breakdown: A time series chart for mitigated and flagged bad bot events across all protected endpoints displayed as an area chart, bar chart or line graph.
- Top Actions: The number of events to which each mitigation action was applied.
- Top Sources of Bad Bot Traffic: Bad bot traffic analysis by source type, including number of events, IP address and geolocation. Display by Source IP, ASN or User Agent.
- Threat Type: An overview of bad bot traffic by threat type over a selected time period. View as an area or line chart. Hover over the charts to see the number and percentage of each type of attack for a specific time.
- Top Threat Types: An overview of bad bot traffic by threat type listed in descending order.
- Top 5 Sources of Threat Types: A list of the top five sources of each bad bot attack type. Information includes source IP address, autonomous system number (ASN), geolocation, number of events from each source and the percentage of the total for that attack type attributed to the source.
Geolocation
- Traffic from Humans: A map that shows where your human traffic comes from. Hover over each country for additional information about your traffic.
Traffic Analyzer
The Traffic Analyzer report provides detailed insight into human, known bot, bad bot and other traffic analyzed by Bot Defense. View traffic as a bar chart or an area chart. Hover over the charts to view traffic totals for specific times.
To view the Traffic Analyzer, in Bot Defense, from the navigation menu, select Report > Traffic Analyzer.

Figure: Traffic Analyzer
In addition to the chart showing transactions per minute for a specified time window, you can also:
- View details about every HTTP request sent through Bot Defense.
- Use the time range drop-down menu or select a specific time in the chart and drag your cursor to another time to display specific time periods. By default, the report displays data from the last six hours.
- Select the region for which information displays.
- Save and share filters that you apply to the report.
- Reorder columns by dragging a column to the left or to the right.
Transaction Detail Panel
The Traffic Analyzer Transaction Detail panel provides information about individual transactions and information about why Bot Defense determined that a transaction was from an automated source.
Select an entry in the Time column to display the Transaction Detail panel.
You can optionally export a JSON file that contains the transactions details so you can share the data for offline analysis.

Figure: Download JSON File
The panel contains the following information:
| Name | Description |
|---|---|
| Information Fields | |
| Time | The date and time of the request. |
| User Name | The user name associated with the request. |
| Client Token | Identifies a particular Bot Defense client session. For web clients, this value is shared by all protected requests made by the user from a web page which executed the Bot Defense JavaScript. For mobile clients, this value is shared by all protected requests made by an app with an integrated F5 Distributed Cloud Mobile SDK within a four-hour window. |
| SDK Version | For mobile traffic, the version of the SDK used with the targeted application. |
| IP Fields | |
| IP Address | The IP address where the request originated. |
| ASN | The autonomous system number of the IP address where the request originated. |
| AS Organization | Name of the organization associated with the ASN. |
| Country | The country of origin. |
| Method and URL Fields | |
| Method | The type of HTTP request. |
| Host | The host where the request originated. |
| Path | The path to the flow specified in the request. |
| URL | The URL of the endpoint specified in the request. |
| Referer | The web page where the request originated. |
| Traffic Channel | The type of traffic (web or mobile). |
| Inference Fields | |
| Is Attack | If Bot Defense determined this to be an attack (True or False). |
| Bot Reason | The reason that Bot Defense determined the request was an automated attack. |
| Traffic Type | Whether the traffic was human, known bot, bad bot, allowlisted, telemetry client, challenged or unevaluated. Bot Defense continuously evaluates traffic behavior in real-time to distinguish between legitimate human users and automation. As Bot Defense inspects traffic characteristics and aggregates signals interactions, the system dynamically recognizes patterns and accurately identifies evasive automated attacks. As soon as the traffic's true intent emerges, Bot Defense applies the designated mitigation. |
| Threat Type | Type of attack based on OWASP attack types, for example, scraping, carding, denial of inventory, credential stuffing and account creation. |
| Action Taken | The mitigation action taken by Bot Defense (Continue, Block, Redirect, Transform). Bot Defense only applies mitigation actions to automated traffic. When the traffic type is "Human," the "Action Taken" displays as "Not Applicable." |
| Cookie Age | Time in seconds/ms indicating how long ago the cookie was set. |
| Bot Cookie | Contains a unique id with expiration set by Bot Defense that enables F5 to connect multiple HTTP requests that share the same cookie value. Useful for detecting false positives and provides valuable data for threat intelligence. |
| Known Bot Name | The name assigned to and used to identify this known bot. |
| Known Bot Category | The category that F5 assigned to classify this type of known bot. |
| Known Bot Provider | The entity that released the known bot. |
| User Agent Field | |
| User Agent | Information about the Client OS and the browser version. |
| User Agent OS Family | The operating system on the user agent where the request originated. |
| User Agent Family | The type of browser where the request originated. |
| Fingerprints | |
| Browser Fingerprint | A unique string based on characteristics of the browser that sent the request. |
| User Fingerprint | Captures the hash value for each user's behavior. |
| Header Fingerprint | Hash value, determined from various factors such as browser, plugins, headers and so on. |
| DeviceID | A unique and persistent value which identifies a particular browser or a mobile device. |
| Data Labels & Cluster | |
| Flow Category | High-level categories that help identity endpoints for more granular attack intent identification and reporting. |
| Flow Label | The endpoint label assigned to the flow for more granular attack intent identification and reporting. |
| Agent | Indicates if the client is a legitimate user, illegitimate (failed to provide valid telemetry), on trusted allowlist (for example, your internal users), or on an untrusted allowlist (for example, third parties that you allow to access the application without valid telemetry). |
| Application Name | A label applied in the policy when the endpoint is configured. |
| Bot Infrastructure | The name of the cluster that processes your incoming traffic. |
| Headers and Response Fields | |
| Request Headers | List of request headers. |
| Response Headers | List of response headers. |
| Response Code | HTTP response code for the transaction served from Bot Defense. |
| Server Response Code | HTTP response code for transaction served from upstream. |
| Transaction Result | Captures information based on success/fail criteria for protected endpoints. |
| Latency Fields | |
| Inference Response Latency | The time Bot Defense takes to process transactions and provide inference. |
| Origin Latency | The time it takes the origin server to respond. |
| Total Latency | Total of inference response latency and origin latency. |
| Triggered Detection Rules | Bot detection rules that were triggered for this transaction. |
| On | Bot Defense performed the Endpoint Policy mitigation actions. |
| Off | Bot Defense monitored the automation but did not perform the mitigation actions configured in the Endpoint Policy. |
| Transaction Insights | Information about the criteria that Bot Defense used to determine if the source of a transaction was a bot. |

Figure: Transaction Detail
Forensics Panel
The Traffic Analyzer Forensics panel displays the top results for four configurable transaction characteristics captured by Bot Defense, such as top IP addresses from which automated traffic is sent, top traffic type and top mitigation actions taken by Bot Defense.
From the Traffic Analyzer, select Forensics to display the Forensics panel.

Figure: Forensics Panel
You can edit each section of the Forensics panel to display the data you want to see.
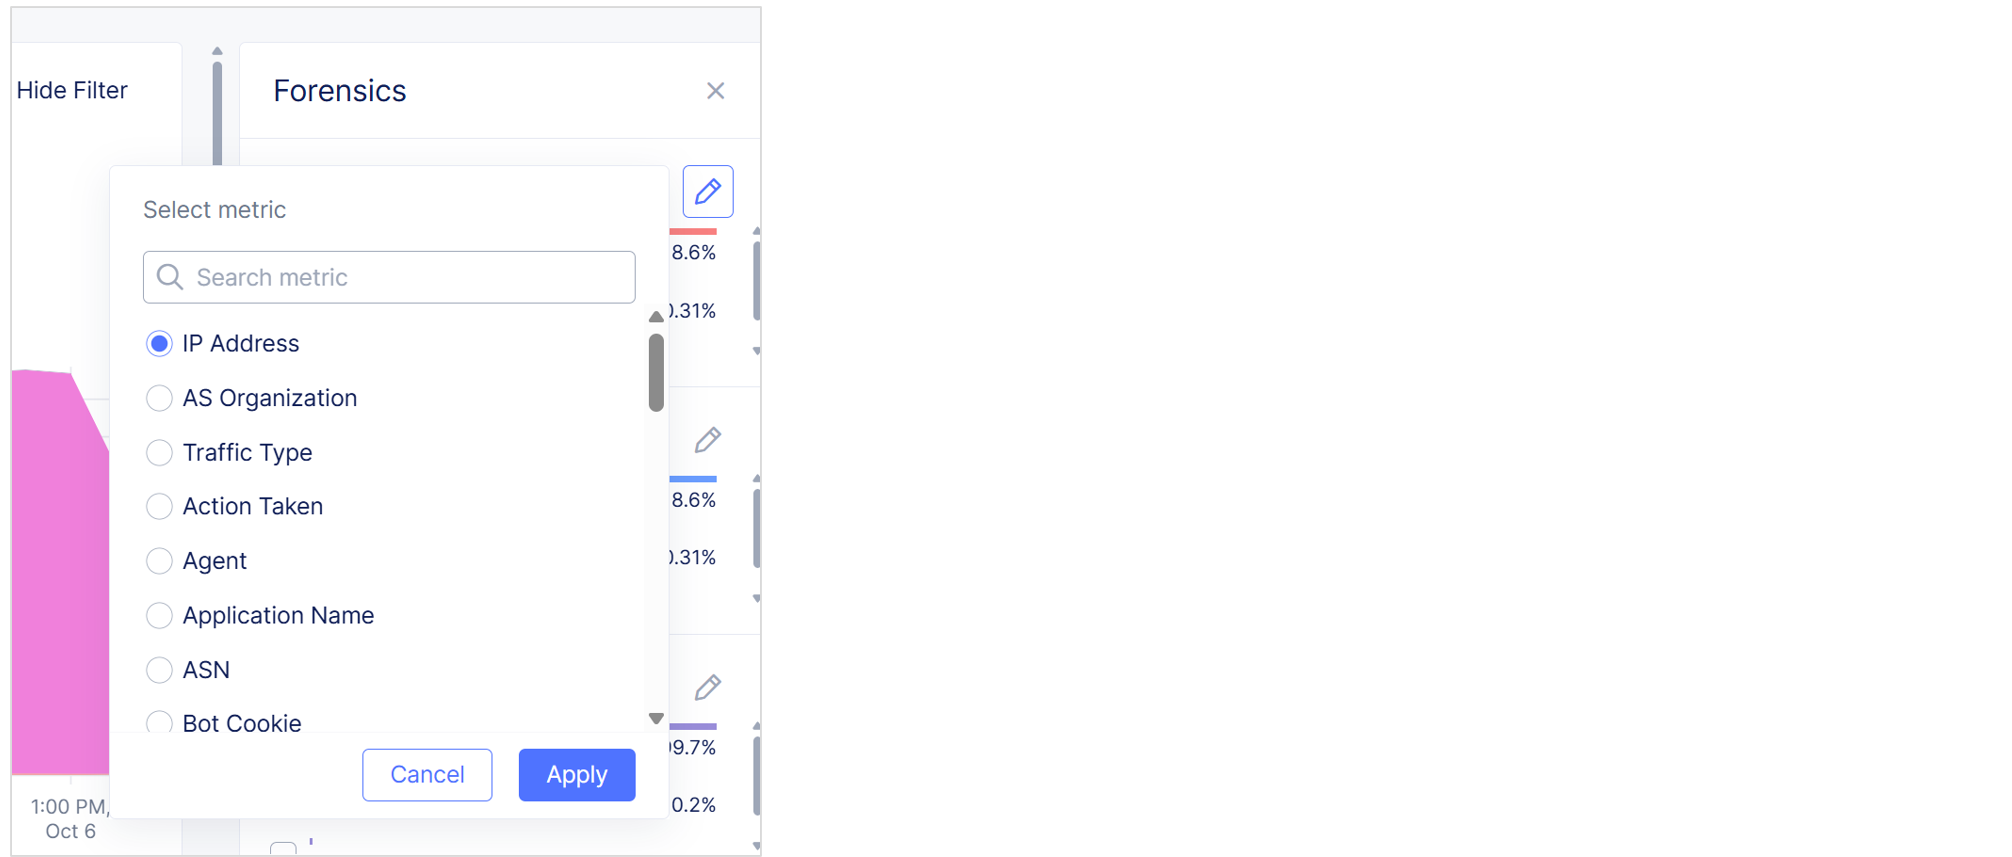
Figure: Edit the Forensics Panel
Select the checkbox next to a result in the Forensics panel to filter the data displayed in the Traffic Analyzer by that result. For example, filter Top Traffic Type so that only traffic from bad bots is displayed and then filter Top IP Address so that the Traffic Analyzer only displays traffic from a specific IP address. Select Apply to apply the filters you select.

Figure: Filter by Forensics Panel Data
Select Clear All to clear Forensics panel filters.
Bad Bot Report
The Bad Bot Report provides information about malicious automation in your web traffic.
To view the Bad Bot Report, in Bot Defense, from the navigation menu, select Report > Bad Bot Report.

Figure: Bad Bot Report
By default, the report displays data from the last six hours. You can customize the time period and the region that displays. You can also save and share filters that you apply to the dashboard.
The Bad Bot Report includes the following information:
- Traffic Metrics: An overview of the different characteristics of the bad bot traffic that Bot Defense has detected across your protected endpoints.
- Actions Taken: The number of events to which each mitigation action was applied, including percentage information.
- Threat Type: An overview of bad bot threat traffic based on key OWASP attack types to help you see how attackers are targeting your endpoints.
- Events per Bot Infrastructure: The number of bad bot events grouped by infrastructure. Hover over the chart for totals and percentages for each infrastructure.
- Bad Bot Reasons: The reasons why Bot Defense associated an event with a bad bot, including the number of events for each reason code and percentage, to help you understand how bad bots are attacking your endpoints.
- Bad Bot Traffic: An overview of bad bot traffic by threat type over a period of time.
- Bad Bot Events per Bot Infrastructure: An overview of bad bot events that occurred on each Bot Defense infrastructure. View data as an area chart, bar chart or line graph. Hover over the charts for event totals and percentages on each infrastructure at a specific time.
- Bad Bot Traffic Breakdown: An overview of bad bot events impacting your endpoints across the specified time range. View data as an area chart, bar chart or line graph. Hover over the charts for totals and percentages for a specific time. You can also view bad bot events organized by operating system (OS), browser, user agent (UA), autonomous system number (ASN) or IP address. Explore and investigate detailed event data, including threat types and reason code information. Expand each row to reveal additional total and percentage information. Use Search to find specific events.
- Endpoints with Bad Bot Traffic: An overview of bad bots attacking your protected endpoints.
Known Bot Report
The Known Bot Report is a snapshot of all activity from known bots in the web traffic analyzed by Bot Defense for a specified infrastructure, region and time period. You can view traffic from all Bot Defense infrastructures or choose to view traffic only from specific infrastructures.
To view the Known Bot Report, from the Bot Defense navigation menu, select Report > Known Bot Report.
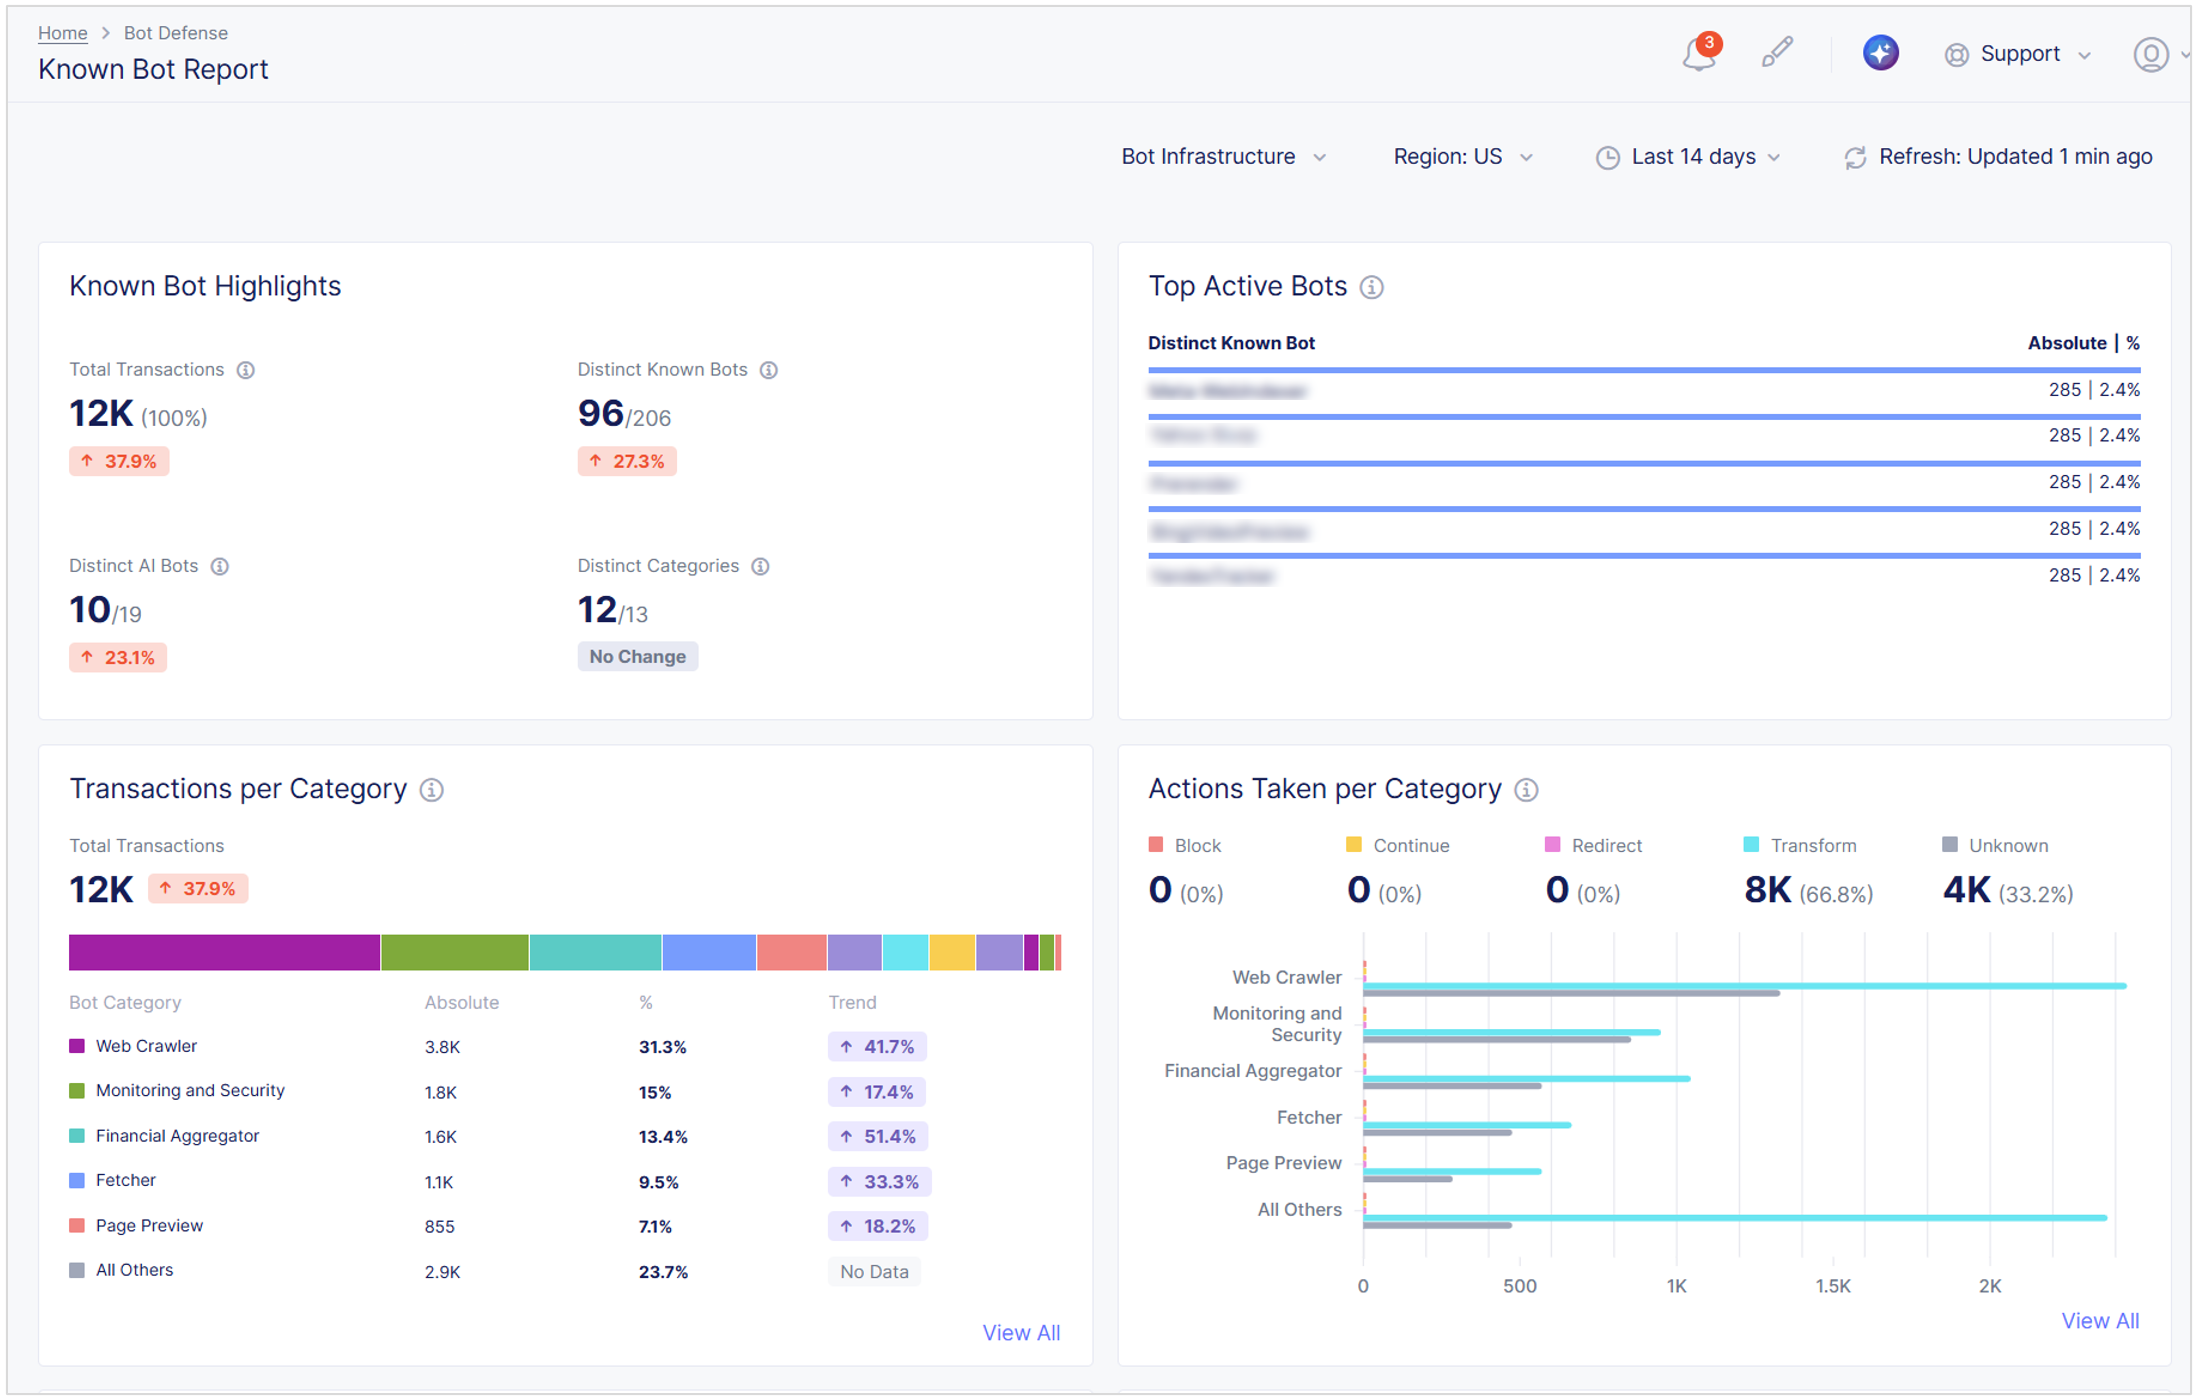
Figure: Known Bot Report
Important: Due to a change in how Bot Defense identifies known bot data, Known Bot transaction totals may not display correctly when date ranges include data prior to May 2026.
The Known Bot Report includes the following information:
- Known Bot Highlights:
- Total Transactions: The number of transactions from known bots for the specified timeframe, region and Bot Defense infrastructures.
- Distinct Known Bots: The number of unique known bots that generated requests in your web traffic compared to the total number of unique known bots.
- Distinct Categories: The number of unique known bot categories that generated requests in your web traffic compared to the total number of known bot categories.
- Total AI Transactions: The total number of transactions generated by AI bots in the AI Search Crawler, AI Data Scraper, and AI Assistant categories.
- Distinct AI Bots: The number of unique known AI bots that generated requests in your web traffic compared to the total number of unique known AI bots.
- Top Active Bots: The top five known bots that generate the most requests in your web traffic. Includes total number of requests and the percentage of your traffic generated by each of the five bots.
- Transactions per Category: The total number of transactions generated by bots in each known bot category, including the percentage of total known bot transactions generated by each category.
- Actions Taken per Category: The number of times Bot Defense applied each mitigation action to requests from bots in each known bot category, including the total number of times each mitigation action was applied and the percentage each mitigation contributed to the total mitigation actions.
- Active AI Bots: The number of transactions from each of the four most active AI bots in your traffic.
- Actions Taken per AI Category: An overview of the number of times Bot Defense applied each mitigation action to requests from AI bots in the AI bot categories, including the total number of times each mitigation action was applied and the percentage each mitigation action contributed to the total mitigation actions.
- Categories Over Time: An overview of the number of transactions from each known bot category throughout the specified time period. View data as an area chart, bar chart or line graph.
- Endpoint Activity: The number of requests from each known bot category for the specified timeframe, region and Bot Defense infrastructures. You can view the following columns:
- Name: The name of the endpoint to which a known bot sent a request.
- Endpoint Label: The endpoint label assigned to the flow for more granular attack intent identification and reporting.
- Bot Endpoint Policy: The Bot Endpoint Policy that processed the known bot. Select an Endpoint Policy name to view the policy details.
- Known Bot Name: The name assigned to and used to identify this known bot.
- Known Bot Category: The category that F5 assigned to classify this type of known bot.
- Known Bot Provider: The entity that released the known bot.
- Known Bot Mitigation: The number of times each mitigation action was applied to the activity.
- Absolute: The number of occurrences of a specific known bot activity.
- %: The percentage of your known bot traffic that a specific activity comprises.
Percentage increase and decrease information is the result of data from the currently selected time period compared to data from the previous time period of the same duration. For example, if you select to view data for the last 14 days, the percentages are a result of data from the last 14 days compared data to the previous 14 days.
Protection Coverage Report
The Protection Coverage Report provides information about your protected endpoints and the traffic that accesses them.
To view the protection coverage report, in Bot Defense, from the navigation menu, select Report > Protection Coverage Report.

Figure: Protection Coverage Report
By default, the report displays data from the last six hours. You can customize the time period and the region that displays. You can also save and share filters that you apply to the dashboard. To reorder report columns, drag columns to the left or to the right.
The Protection Coverage Report includes the following information:
- Endpoint Summary: A summary of your protected endpoints during the selected time period.
- Endpoints Category Breakdown: An overview of traffic passing through your secured endpoints. Use the drop-down menu to display data for specific flow categories and associated flow labels.
- Protected Traffic Flow: A visual representation of all traffic visiting your protected endpoints.
- All Protected Endpoints: Information about all of your endpoints that are protected by Bot Defense, including domain, associated infrastructure, number of events that took place on the endpoint, and percentage of your total traffic that passed through the endpoint.
Peer Comparison Dashboard
The Peer Comparison dashboard helps you understand how your bot protection compares to similar peer companies. Data includes comparisons of total traffic breakdowns, top known bots, top reason codes (how Bot Defense determined the automation was malicious), and top threat types. For example, the Top Threat Types widget shows you your top bad bot traffic compared to an average of the top bad bot traffic at peer companies.
Use peer comparison data to help you identify areas where you might want to tune your configuration to help ensure the highest protection from current and future attacks.
To view peer comparison data, from the Bot Defense navigation panel, select Report > Peer Comparison.

Figure: Peer Comparison Dashboard
You can select the time period, sort the data in descending order based on either your threat information or your peer threat information, and view absolute values or view data as a percentage of traffic.
The Peer Comparison dashboard includes the following information:
- Total Traffic Breakdown: The total number of events impacting the endpoints you protect with Bot Defense compared to the average number of events impacting peer companies. Hover over the bar chart for exact numbers and percentages of each traffic type.
- Top Known Bots: The top known bots in your web traffic during the selected time period compared to the average number of those known bots at peer companies, including the name of each bot and the number of individual events attributed to a specific bot. Hover over the bar chart for exact numbers and percentages of each type of bot.
- Top Bad Bot Reasons: A list of the top bot reason codes indicating how an attack was executed compared to the average of those codes at peer companies. Hover over the bar chart for exact numbers and percentages of each code.
- Top Threat Types: An overview of the different types of bad bot traffic impacting your endpoints compared to the average number of those types of bad bots impacting peer companies. Hover over the bar chart for exact numbers and percentages of each threat type.
Note: Peer comparison information is not available for MSP and FedRAMP customers or for customers with private instances, and the Peer Comparison dashboard does not appear in the Bot Defense navigation menu.
Consumption Report
The Consumption Report lets you see how many transactions Bot Defense has processed for the past year.
To view the Consumption Report, in Bot Defense, from the navigation menu, select Report > Consumption Report.

Figure: Consumption Report
This report displays the following information by month or by quarter:
- Traffic: All the traffic on your endpoints that are monitored by Bot Defense.
- Telemetry Client: Traffic that comes from loading the Bot Defense JavaScript in application pages or from configuration requests (fetches) from mobile applications integrated with the F5 Distributed Cloud Mobile SDK.
The report displays data for the past year, starting from a year previous to the current month until the previous month. For example, if the current month is December 2022, data is presented from December 2021-November 2022. Hover over the chart to see information for a given month or quarter.
The following summary data for the previous 24 months is displayed at the top of the report:
- Highest: The highest number of transactions monitored in a given month in the past year, compared with the highest number of transactions monitored in a given month in the previous year.
- Lowest: The lowest number of transactions monitored in a given month in the past year, compared with the lowest number of transactions monitored in a given month in the previous year.
- Average: The monthly average number of transactions monitored in the past year, compared with the monthly average number of transactions monitored in the previous year.
You can display data as a bar chart, area chart or line chart. Hover over the charts to see data from specific months.
Use the drop-down menu to switch between Monthly and Quarterly views.

Figure: Quarterly or Monthly View Controls
Save and Manage Dashboard Filters
The Bot Defense Dashboard (Monitor), Traffic Analyzer report, Bad Bot report, and Protection Coverage Report allow you to apply one or more filters to view specific subsets of information. Report filtering allows you to:
- Apply and save filters.
- View past dashboard filter combinations.
- Share your saved filters with other users.
- View filters saved by other users.
To apply a filter to a report:
- Open a report and select Add Filter.
- From the drop-down menu, select a filter option.
- Select an operator, such as In, Includes, Does Not Include, Match Regex, Starts With, and so on.
- Select Apply.
For example, to add a filter that displays only automated transactions where the Bot Reason is Token Missing:
Select Add Filter. From the drop-down menu, select Bot Reason, select In, select Token Missing and select Apply.
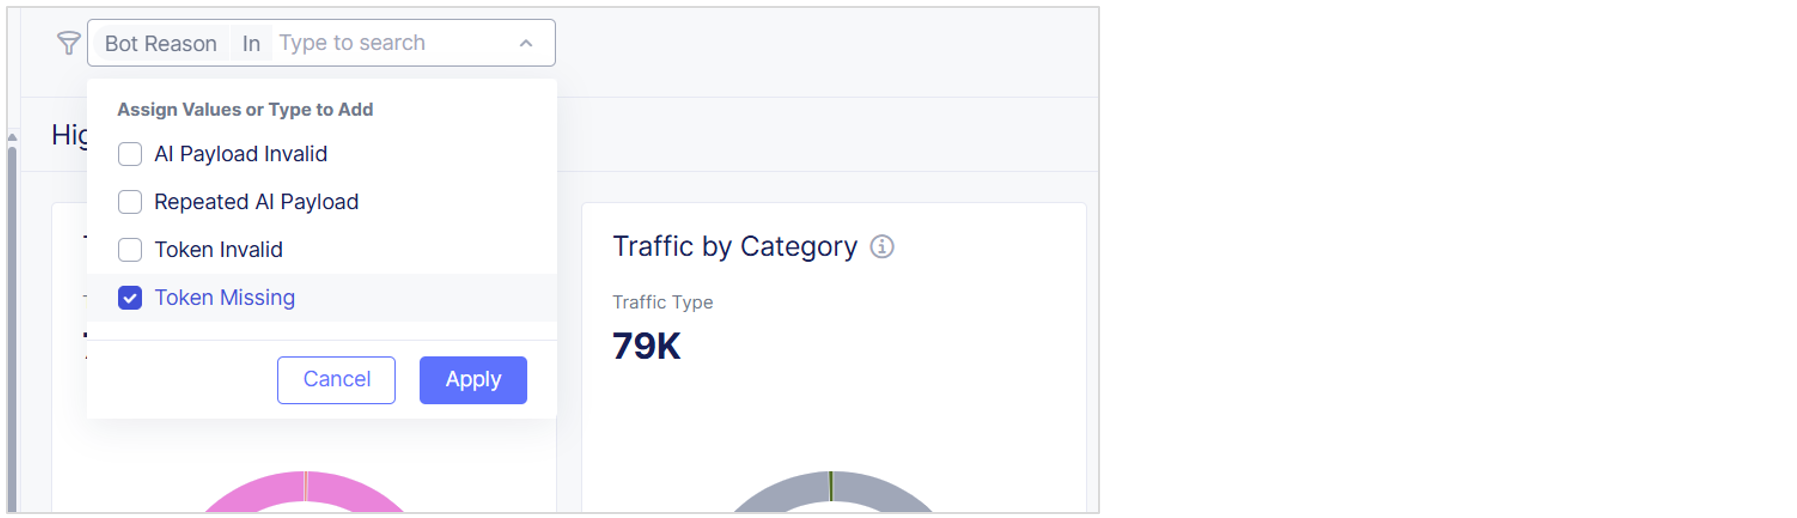
Figure: Filter Example
The following filters are available. Note that not all filters are available in all reports.
| Filter | Description |
|---|---|
| Action Taken | The mitigation action taken by Bot Defense (Continue, Block, Redirect, Transform). Bot Defense only applies mitigation actions to automated traffic. When the traffic type is "Human," the "Action Taken" displays as "Not Applicable." |
| Agent | Indicates if the client is a legitimate user, illegitimate (failed to provide valid telemetry), on trusted allowlist (for example, your internal users), or on an untrusted allowlist (for example, third parties that you allow to access the application without valid telemetry). |
| Application Name | A label applied in the policy when the endpoint is configured. |
| AS Organization | Name of the organization associated with the ASN. |
| ASN | The autonomous system number of the IP address where the request originated. |
| Bot Cookie | Contains a unique id with expiration set by Bot Defense that enables F5 to connect multiple HTTP requests that share the same cookie value. Useful for detecting false positives and provides valuable data for threat intelligence. |
| Bot Infrastructure | The name of the cluster that processes your incoming traffic. |
| Bot Reason | The reason that Bot Defense determined the request was an automated attack. |
| Browser Fingerprint | A unique string based on characteristics of the browser that sent the request. |
| Client Token | Identifies a particular Bot Defense client session. For web clients, this value is shared by all protected requests made by the user from a web page which executed the Bot Defense JavaScript. For mobile clients, this value is shared by all protected requests made by an app with an integrated F5 Distributed Cloud Mobile SDK within a four-hour window. |
| Cookie Age | Time in seconds/ms indicating how long ago the cookie was set. |
| Country | The country of origin. |
| Device ID | A unique and persistent value which identifies a particular browser or a mobile device. |
| Flow Category | High-level categories that help identity endpoints for more granular attack intent identification and reporting. |
| Flow Label | The endpoint label assigned to the flow for more granular attack intent identification and reporting. |
| Header Fingerprint | Hash value, determined from various factors such as browser, plugins, headers and so on. |
| Host | The host where the request originated. |
| IP Address | The IP address where the request originated. |
| Is Attack | If Bot Defense determined this to be an attack (True or False). |
| Known Bot Name | The name assigned to and used to identify this known bot. |
| Known Bot Category | The category that F5 assigned to classify this type of known bot. |
| Known Bot Provider | The entity that released the known bot. |
| Method | The type of HTTP request. |
| Mobile Transaction Insight | The behaviors that Bot Defense used to determine that the source of a mobile transaction was automated. |
| Path | The path to the flow specified in the request. |
| Referer | The web page where the request originated. |
| Response Code | HTTP response code for the transaction served from Bot Defense. |
| Threat Type | Type of attack based on OWASP attack types, for example, scraping, carding, denial of inventory, credential stuffing and account creation. |
| Traffic Channel | The type of traffic (web or mobile). |
| Traffic Type | Whether the traffic was human, known bot, bad bot, allowlisted, telemetry client, challenged or unevaluated. Bot Defense continuously evaluates traffic behavior in real-time to distinguish between legitimate human users and automation. As Bot Defense inspects traffic characteristics and aggregates signals interactions, the system dynamically recognizes patterns and accurately identifies evasive automated attacks. As soon as the traffic's true intent emerges, Bot Defense applies the designated mitigation. |
| Transaction Result | Captures information based on success/fail criteria for protected endpoints. |
| Triggered Detection Rules | Bot detection rules that were triggered for a transaction. |
| URL | The URL of the endpoint specified in the request. |
| User Agent | Information about the Client OS and the browser version. |
| User Agent Family | The type of browser where the request originated. |
| User Agent OS Family | The operating system on the user agent where the request originated. |
| User Fingerprint | Captures the hash value for each user's behavior. |
| User Name | The user name associated with the request. |
| Web Transaction Insight | The behaviors that Bot Defense used to determine that the source of a web transaction was automated. |
Save a Dashboard Filter
Save dashboard filters to reuse later. Saved filters are specific to the report where they are created and saved. For example, a filter created and saved for the Traffic Analyzer report is only available for that report.
-
Use the Add Filter option to filter the data displayed by your report.
Note: Displayed filter values may be a subset of the available filter values. Type the filter value you want to use. Filter values are case-sensitive.
-
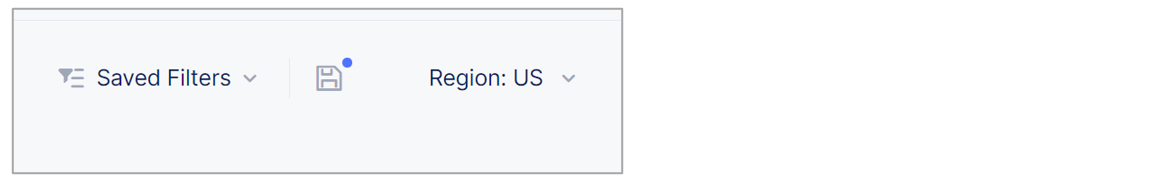
After you set a new filter that you want to save, select the Save Filters icon.

Figure: Save filters icon
-
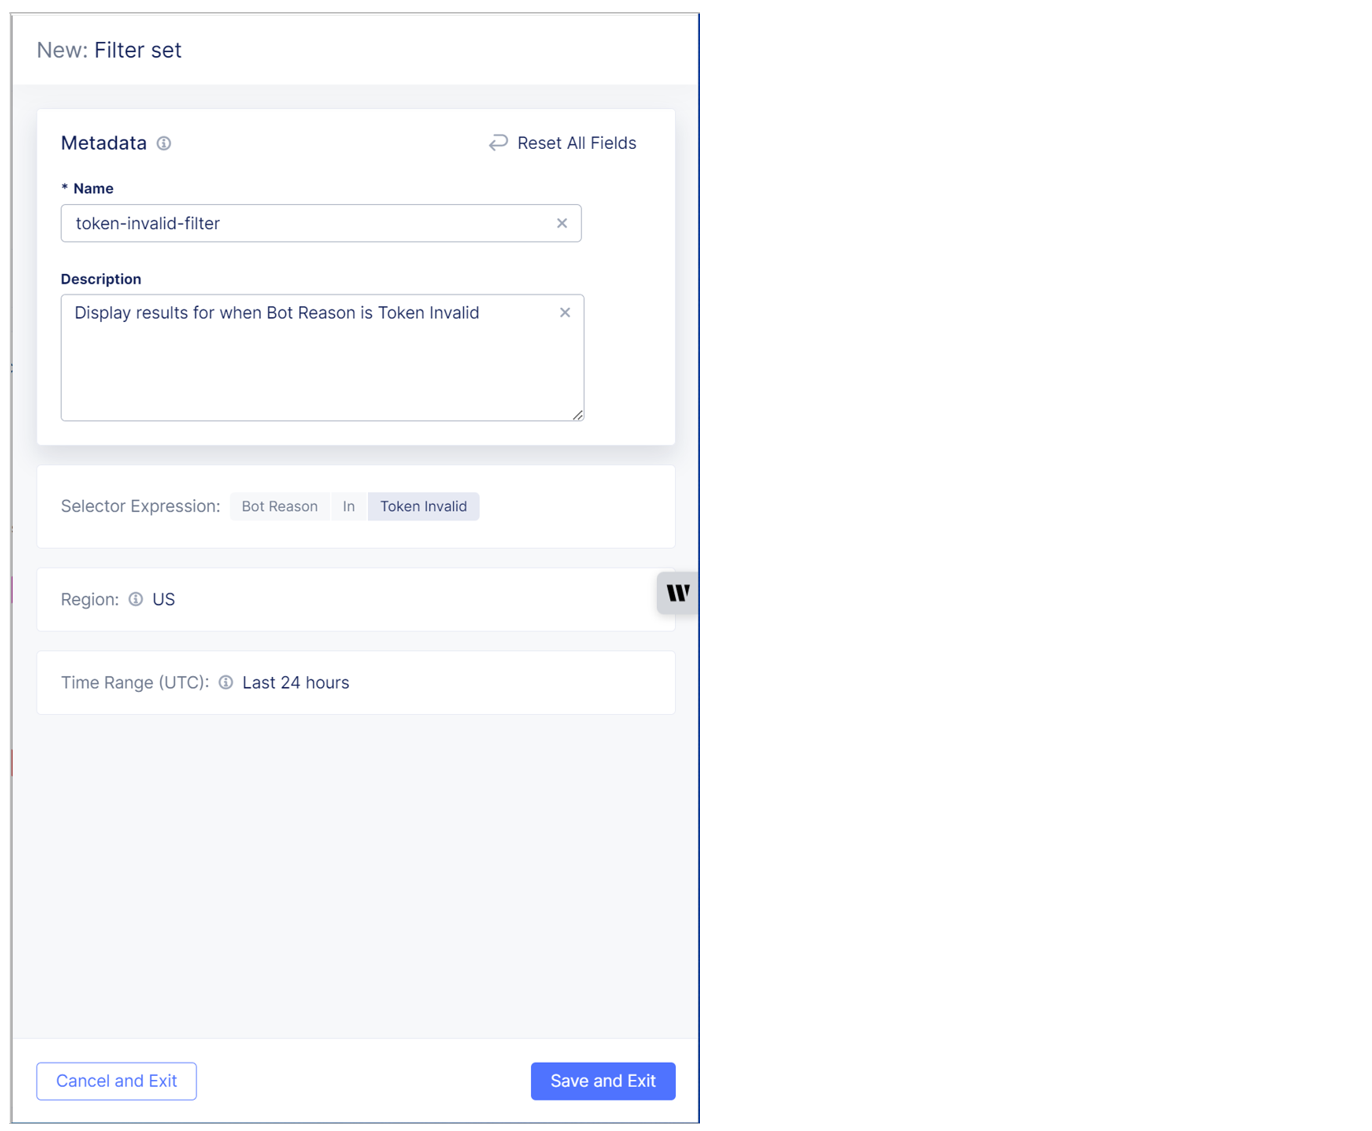
Enter a Name and Description for the filter and then select Save Filter.

Figure: Name and Description fields
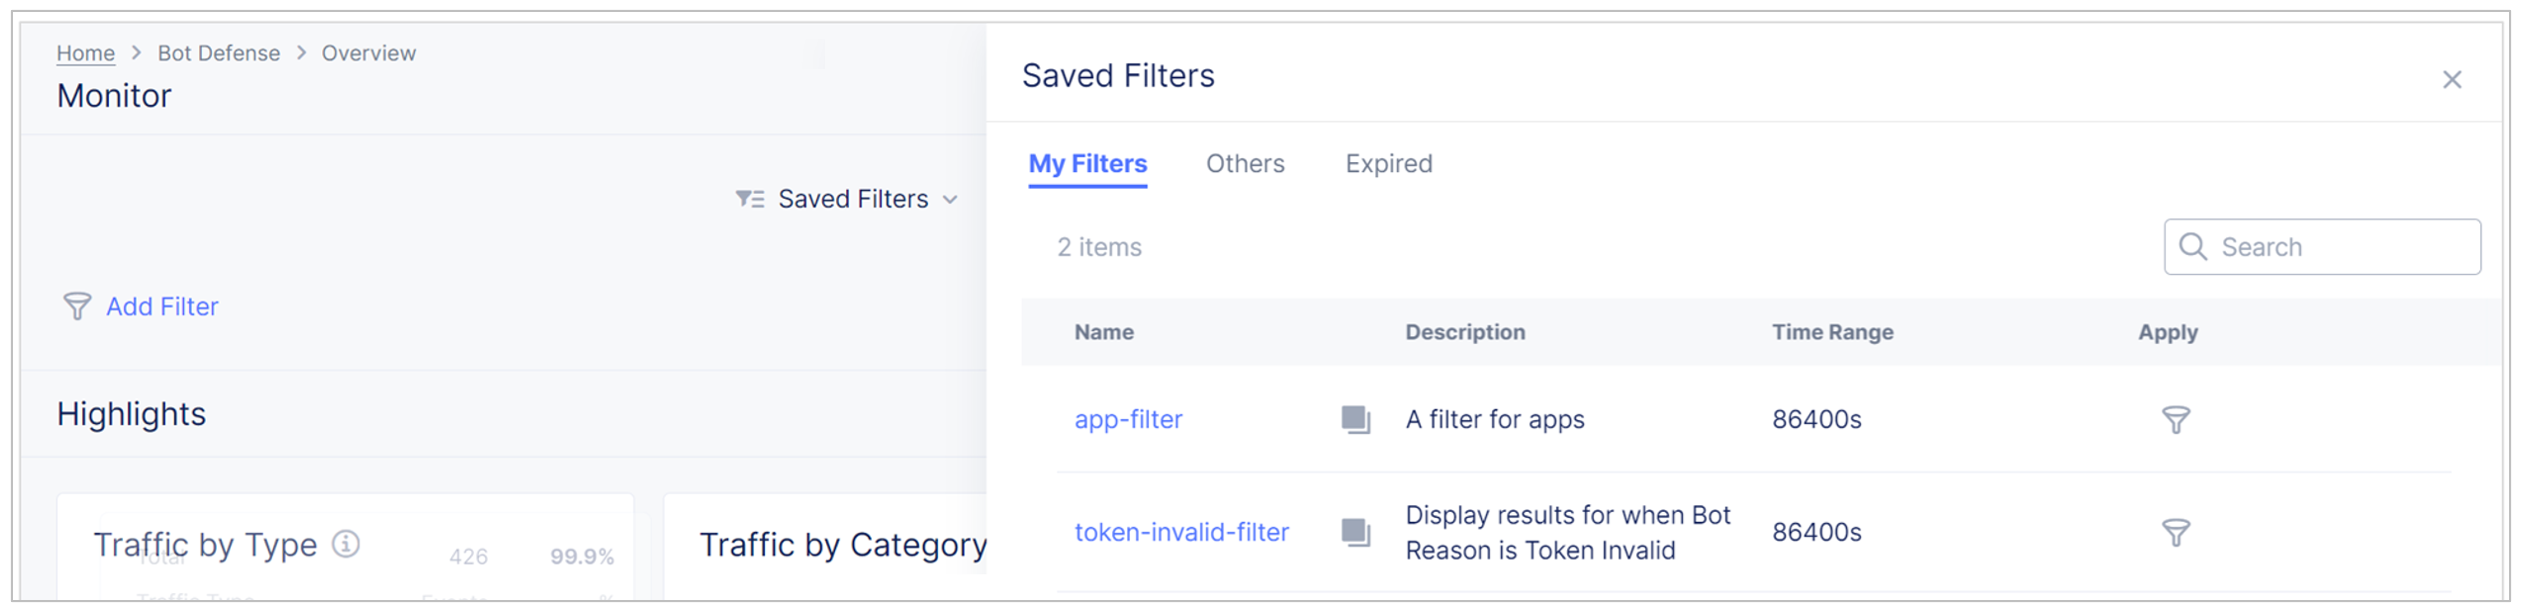
The newly saved filter is available from the Saved Filters list to view and share with other administrators.

Figure: Saved filters
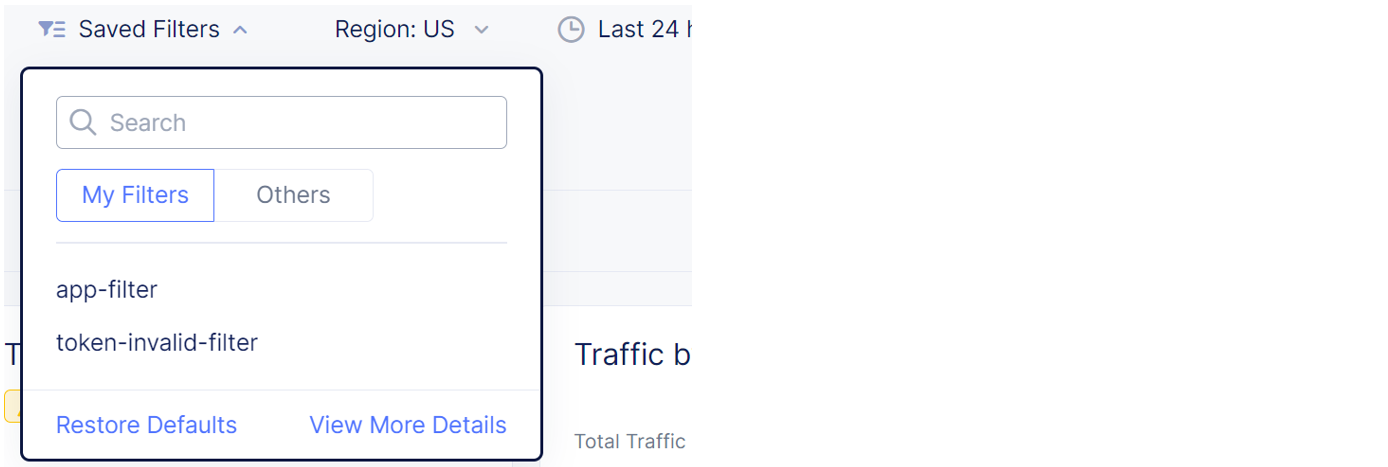
View Saved Filters
To view a previously saved filter, select Saved Filters and then select a filter from the list.

Figure: View saved filters
Note: Filters with custom date ranges older than 30 days expire and cannot be used.
You can also view filters saved by other users.
-
On the dashboard or report that you want to view, select Saved Filters.
-
Select View More Details.
-
Select Others and then select a filter from the list to view the filter.

Figure: View other users' filters
Share a Saved Filter
- From the Bot Defense navigation panel, select Manage > Saved Filters.
- From the Saved Filters list, select the name of the filter you want to share.
- Select Copy URL and provide the URL another administrator to enable them to view your filter.