Set Up L3/L4 Routed DDoS Mitigation
Objective
This guide provides instructions on how to enable Layer 3/Layer 4 DDoS monitoring and protection for your networks using the F5® Distributed Cloud DDoS Mitigation service. This delivers DDoS and advanced security services to protect against L3-L4 attacks on enterprises and hosting and service providers.
F5 Distributed Cloud DDoS Mitigation is a managed, SaaS-delivered service that will detect and mitigate large-scale, volumetric network-targeted attacks in real-time to defend your businesses and your customers against multi-vector, denial of service activity that may potentially exceed hundreds of gigabits per second in attack traffic. DDoS Mitigation provides mitigation against a variety of denial-of-service attacks across L3-L4 through multiple layers of protection, from edge firewalls prescreening traffic, to deep packet inspection with advanced scrubbing for enterprises, hosting, and service providers. Also, the service provides the following:
- DDoS mitigation as a managed service
- High capacity defense
- Centralized monitoring
- Service options to suit any environment or business requirements, including BGP or proxy routing with on-demand or always-on service options
Using the instructions provided in this guide, you will be able to enable DDoS mitigation service, set prefixes, ASNs, tunnels, and routes for which DDoS mitigation is required, and monitor the scrubbing activity. You can also enable Fast ACLs to apply rate limiting using the F5® Distributed Cloud Console (Console).
Overview
The F5 Distributed Cloud DDoS Mitigation managed service is available in one of the following operational modes:
- Always On - Customer traffic is continuously routed through the F5 network.
- Always Available - F5 Security Operations Center (SOC) or customers activate route change to the F5 network prior to or while under a DDoS attack.
Similarly, the F5 Distributed Cloud DDoS Mitigation managed workspace is available in one of the following deployment modes:
-
Routed Mode - If you have at least one publicly advertised routing subnet (Class C - CIDR /24 prefix), you can use this mode. The service leverages the Border Gateway Protocol (BGP) to advertise the route prefix through F5 carriers. Once the prefix is announced through the F5 platform and global network, all your traffic inbound to the prefix will be routed through F5 global scrubbing facilities for inspection and mitigation. You can control the route advertisement with the assistance of the SOC engineers or self-serve using the configuration options in the Console. Using this mode, you can select several configuration options to return clean traffic back to your network. These configuration options include but not limited to the following:
- One or multiple GRE (Generic Tunnel Encapsulation) tunnels
- Layer 2 connection
- Privately peering with F5 global network through the Equinix fabric and other connectivity providers
The SOC will work with you to build complete redundancy into your network by providing a primary and backup return path(s) from selected scrubbing centers.
- Proxy Mode - This is also known as load balancer mode. In case you do not have a publicly advertisable routing subnet (Class C or more specific prefix), deploy the F5 Distributed Cloud application load balancers to utilize authoritative DNS resolution to route traffic to the scrubbing centers for inspection and mitigation. This mode includes ten load balancers, but you can purchase additional load balancers in a standalone configuration, irrespective of the proxy mode deployments.
The F5 Distributed Cloud DDoS Mitigation workspace includes access to the management console for configuration and visibility. The console provides detailed real-time information on DDoS attack activity, in the form of following statistics:
- Type and size of the attack
- Attack origin
- Mitigation techniques
- Counter measures applied to suppress the attack
- Protocols being used to attack
- IP address range and ports being attacked
- Inbound attack traffic and outbound clean traffic to customer network
- Daily DDoS attack reports
The console also provides information on DDoS attack patterns for a specific time period and customizable DDoS dashboards that present relevant information based on user persona. In addition, periodic reporting is available on-demand.
Prerequisites
-
A valid Account is required. If you do not have an account, see Getting Started with Console.
-
At least one publicly advertised routing subnet with Class C prefix, in case of routed mode of deployment.
Configuration
Enabling the L3/L4 DDoS mitigation requires you to first enable the service subscription by raising a support request in the Console. As part of the request, you can specify to which network entities you want to enable DDoS detection and scrubbing. You can also perform configuration in Console to add, modify, and remove network entities such as ASNs, IP prefixes, tunnels, routes, etc.
This guide provides instructions on how to enable the service specifying your mode of operation and configuration choices. Also, the instructions cover information on how you can manage your configurations in Console and monitor the activity.
Enable DDoS Mitigation Management Workspace
Perform the following to enable the F5 Distributed Cloud DDoS Mitigation workspace:
You can request DDoS mitigation enablement by contacting sales@cloud.f5.com. The F5 SOC team will get back to you for next steps.
The following details are required by the F5 SOC to enable the workspace for you:
-
Internet Routing Registry (IRR) - Ensure that the routes are registered with assigned Authoritative IRR such as RIPE, ARIN, LAPNIC, etc.
-
IP CIDR Netblock(s) - Ensure that you possess and have complete control of all the IP Netblocks you plan to announce through the F5 network. IP Netblocks that are not owned by you cannot be announced through the F5 network unless explicitly authorized to take over control through a Letter of Authorization (LOA). The SOC may provide with an LOA template in order to advertise prefixes through the F5 network.
Note: You must have a /24 and/or less prefix length, such as /23, /22, /21, etc. The /24 prefix is the minimum advertisible Netblock that can be announced onto public carrier routes. If you utilize internal IP address blocks that are not accessible through internet, then you will not be able to announce these through F5 Distributed Cloud carriers. It is recommended to get in touch with SOC to resolve any queries.
-
Route Origin Authorizations (ROA) - Ensure that a route origination authorization for the assigned routes is created in ARIN’s RPKI repository.
-
Autonomous System Number (ASN) - Ensure that you have an ASN issued by ARIN or other registry. You will not be able to use another organizations' ASNs unless explicitly authorized to take over control through a LOA.
-
Private Peering / Direct Connectivity - Specify if you want private peering links to return clean traffic to the origin data centers via these private peering links. The SOC will enable private links accordingly.
-
AS-Path Prepends - Provide the As-path prepends required for the route announcements.
-
AS-SET (Optional) - Provide a set of aut-num objects in the AS-SET attribute. The SOC blocks all prefixes defined in the AS-SET by default until you are ready to announce. This is optional.
-
Data Centers / Routers - Specify the physical location of the data centers and routers that you want to protect.
-
Return Traffic (GRE Tunnels) - Specify if you want to return clean traffic to origin data centers via GRE tunnels.
-
Communities- Provide the SOC with a definition of all community strings required for routes to be announced.
-
Route Preferencing - Provide SOC with any specific preferred routes to configure.
The F5 SOC team will enable the F5 Distributed Cloud DDoS Mitigation workspace, set service configuration, and notify you that it is ready to be used. The service will be enabled in Always On or Always Available mode depending on your choice.
Manage Protected Entities
F5 SOC will provision configuration for tunnels, ASNs, prefixes, and routes that need to be monitored and protected against DDoS attacks. The SOC also applies Fast ACLs for applying rate limiting. In addition, you can also add, update, or remove these entities while continuously monitoring the attack trends.
Perform the steps in the following chapters to manage each of the protected entity:
Configure Tunnels
Tunnel creation includes location in which your tunnels are to be created, type of tunnel, interconnect, encapsulation, and BGP specific settings such as peer secret, and hold timer. Do the following to create tunnel object:
Step 1: Start creating tunnels.
-
Log into the Console with your credentials, and select Routed DDoS.
-
Select Manage in left column menu, and then select Tunnels.
-
Click Add Tunnel and this opens the new object creation form.
-
Enter a name for your tunnel, and optionally set labels and description.
Step 2: Configure location settings.
Do the following in the Tunnel Location section:
-
Click on the Location Name drop-down and select a destination location from the displayed list of locations.
-
Click on the Availability Zone drop-down and select a zone from the displayed list of zones. The Zone 1 is selected by default.
Step 3: Set tunnel type settings.
-
Enter Bandwidth Speed Configuration in Bandwidth Max in MB box.
-
Click on the Tunnel Type drop-down, select one of the tunnel types and perform configuration as per the guidelines provided in the following steps:
-
Select GRE Over IPv4 and set the following fields for the GRE tunnel configuration:
- Enter the IPv4 address for your endpoint in the Customer Endpoint IP field.
- Optionally, select Enable for the IPv6 Interconnect field.
- Optionally, select Enable for the Fragmentation field.
- Optionally, select Enable for the Keepalive field.
Note: The IPv6 Interconnect, Fragmentation, and Keepalive options are disabled by default.
-
Select GRE Over IPv6 and set the following fields for the GRE tunnel configuration:
- Enter the IPv6 address for your endpoint in the Customer Endpoint IP field.
- Optionally, select Enable for the IPv4 Interconnect field. This is disabled by default.
-
Select IP Over IP enable IPv4 encapsulation within IPv4 address for the tunnel.
-
Select IPv6 Over IPv6 enable IPv6 encapsulation within IPv6 address for the tunnel.
Step 4: Set BGP settings for the tunnel.
Go to Tunnel BGP Information section and perform configuration as per the following guidelines:
-
Click on the ASN drop-down and select an ASN from the list of displayed ASN objects.
-
Click on the Customer Peer Secret Override field, select one of the options from the drop-down as per the following guidelines:
-
Select Use Default Secret to use the secret set during tenant provisioning, for establishing tunnel session. This is also the default selection.
-
Select BGP Password Override to set a secret for the session. Click Configure and do the following:
- Select Blindfolded Secret or Clear Secret for the secret type. If it is clear type, enter the secret in plain text format or Base64 format, and select Apply.
- In case of Blindfolded Secret, enter the secret in the Secret to Blindfold, and select Apply.
-
Select No Secret to disable using secret for the sessions.
-
Enter a hold time value in seconds in the Holddown Timer field.
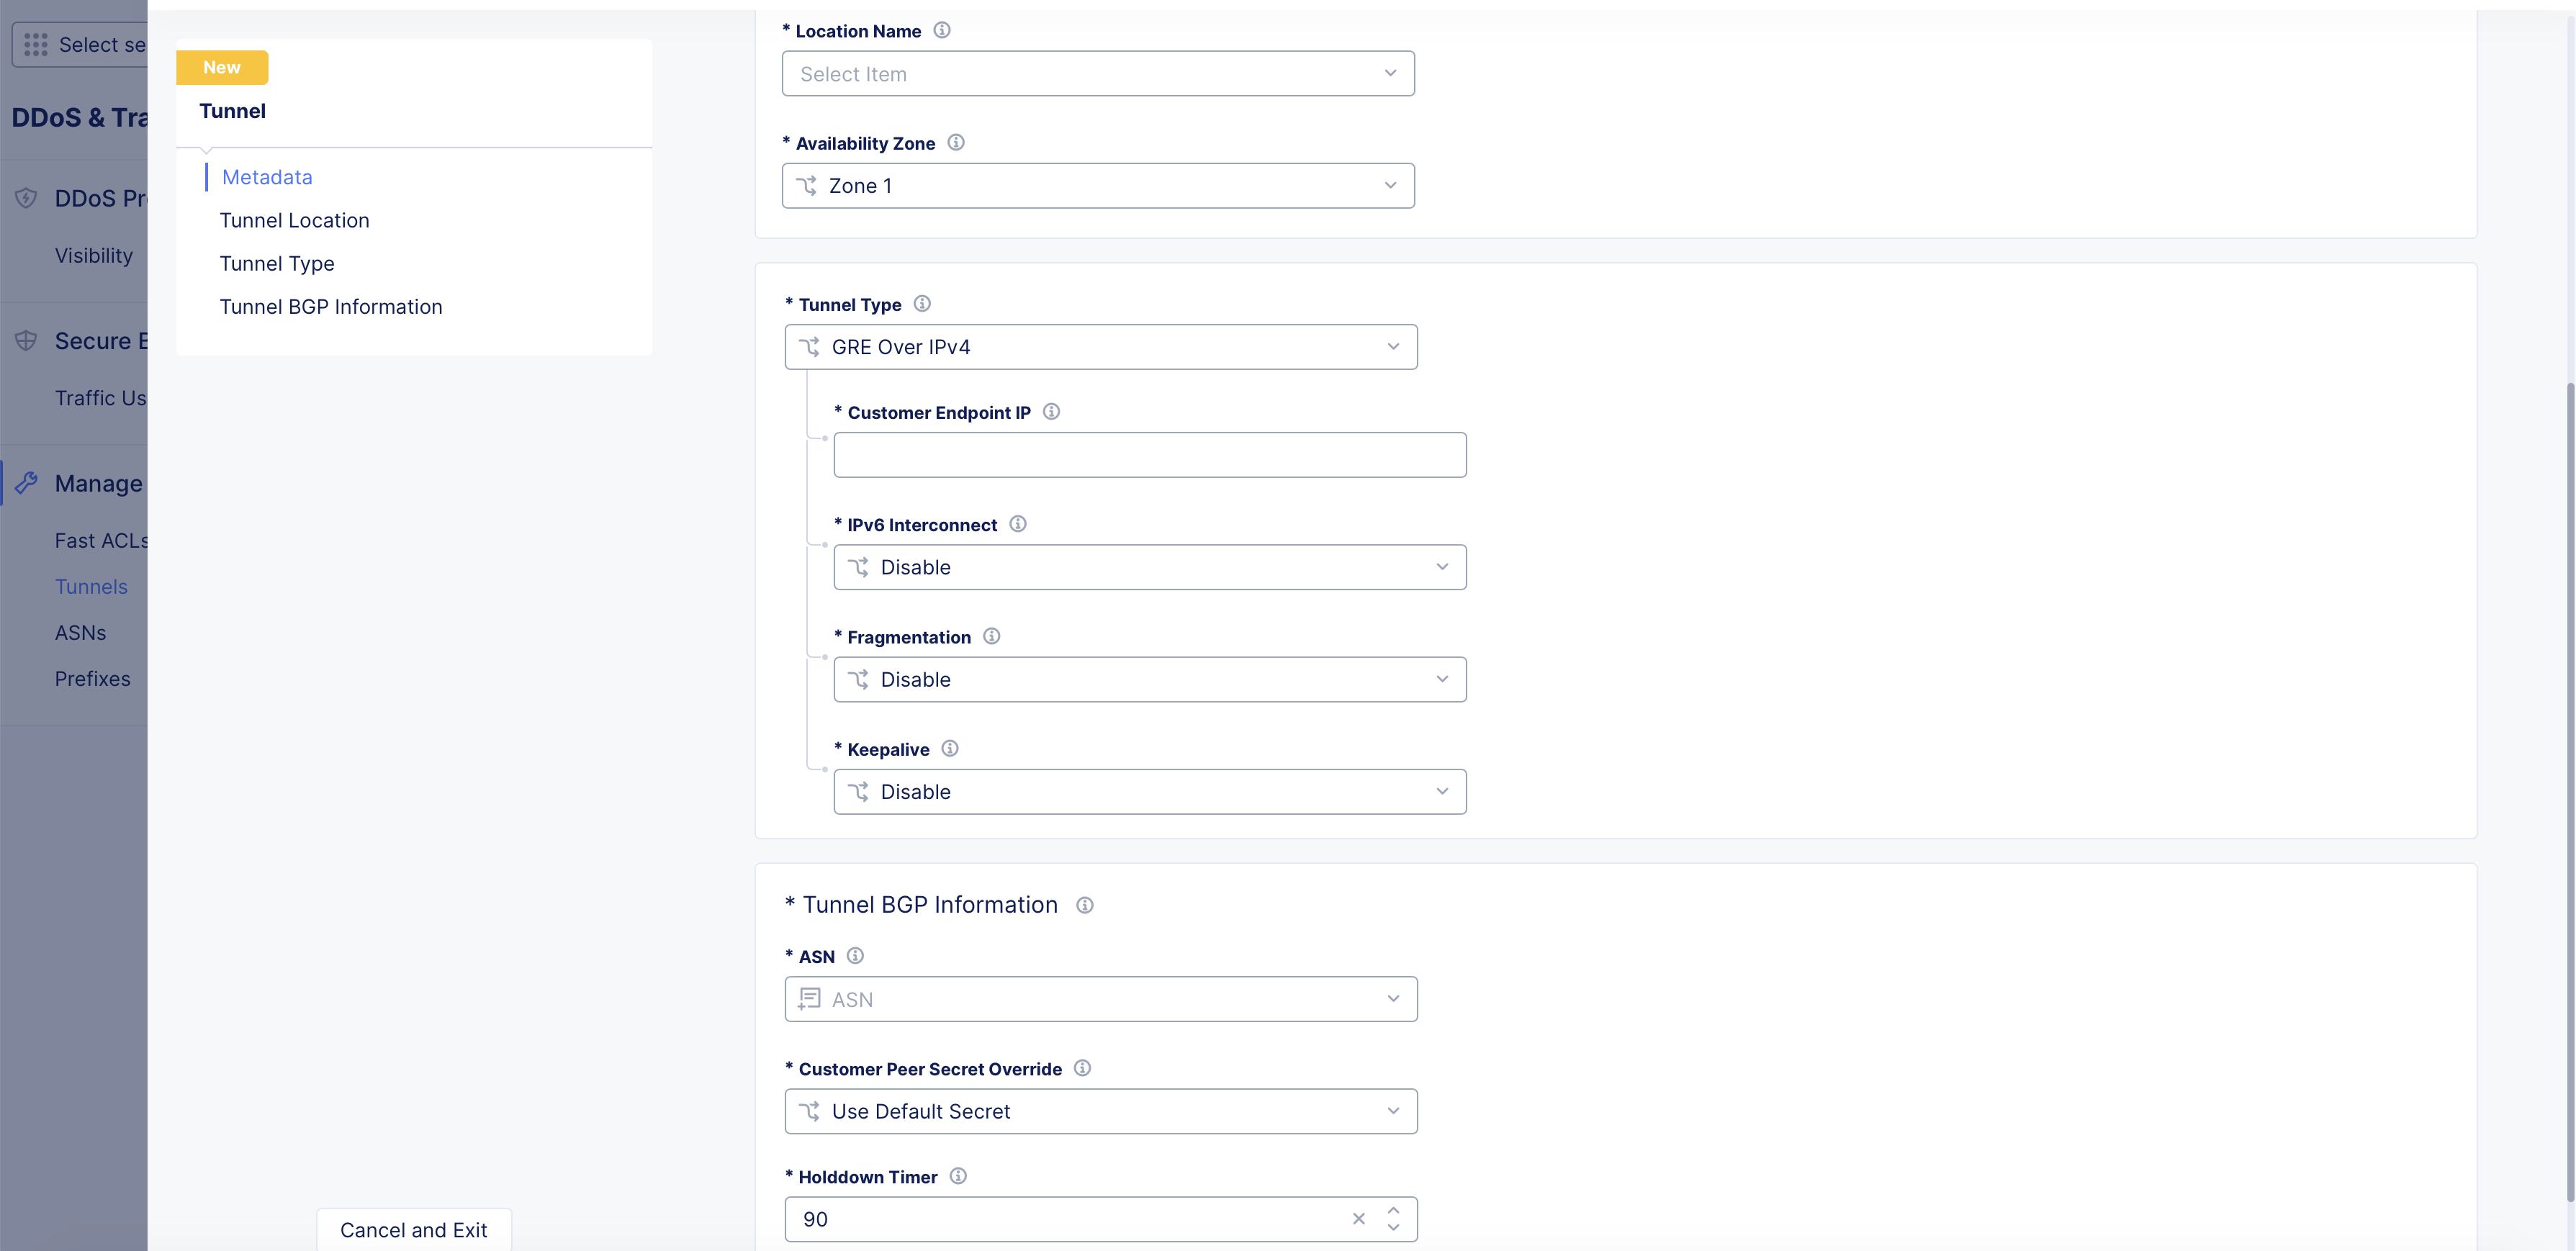
Figure: Tunnel Configuration
Step 5: Complete creating tunnel.
Select Add Tunnel button to complete creating the tunnel.
Configure ASNs
Perform the following to set ASN and associated BGP sessions:
Step 1: Start creating ASN object.
-
Select Manage in left column menu, and then select ASNs.
-
Click Add ASN and this opens the new object creation form.
-
Enter a name for your ASN object, and optionally set labels and description.
Step 2: Specify ASN number and BGP settings.
- Enter a number in the ASN field. The allowed range is 0-4294967295.
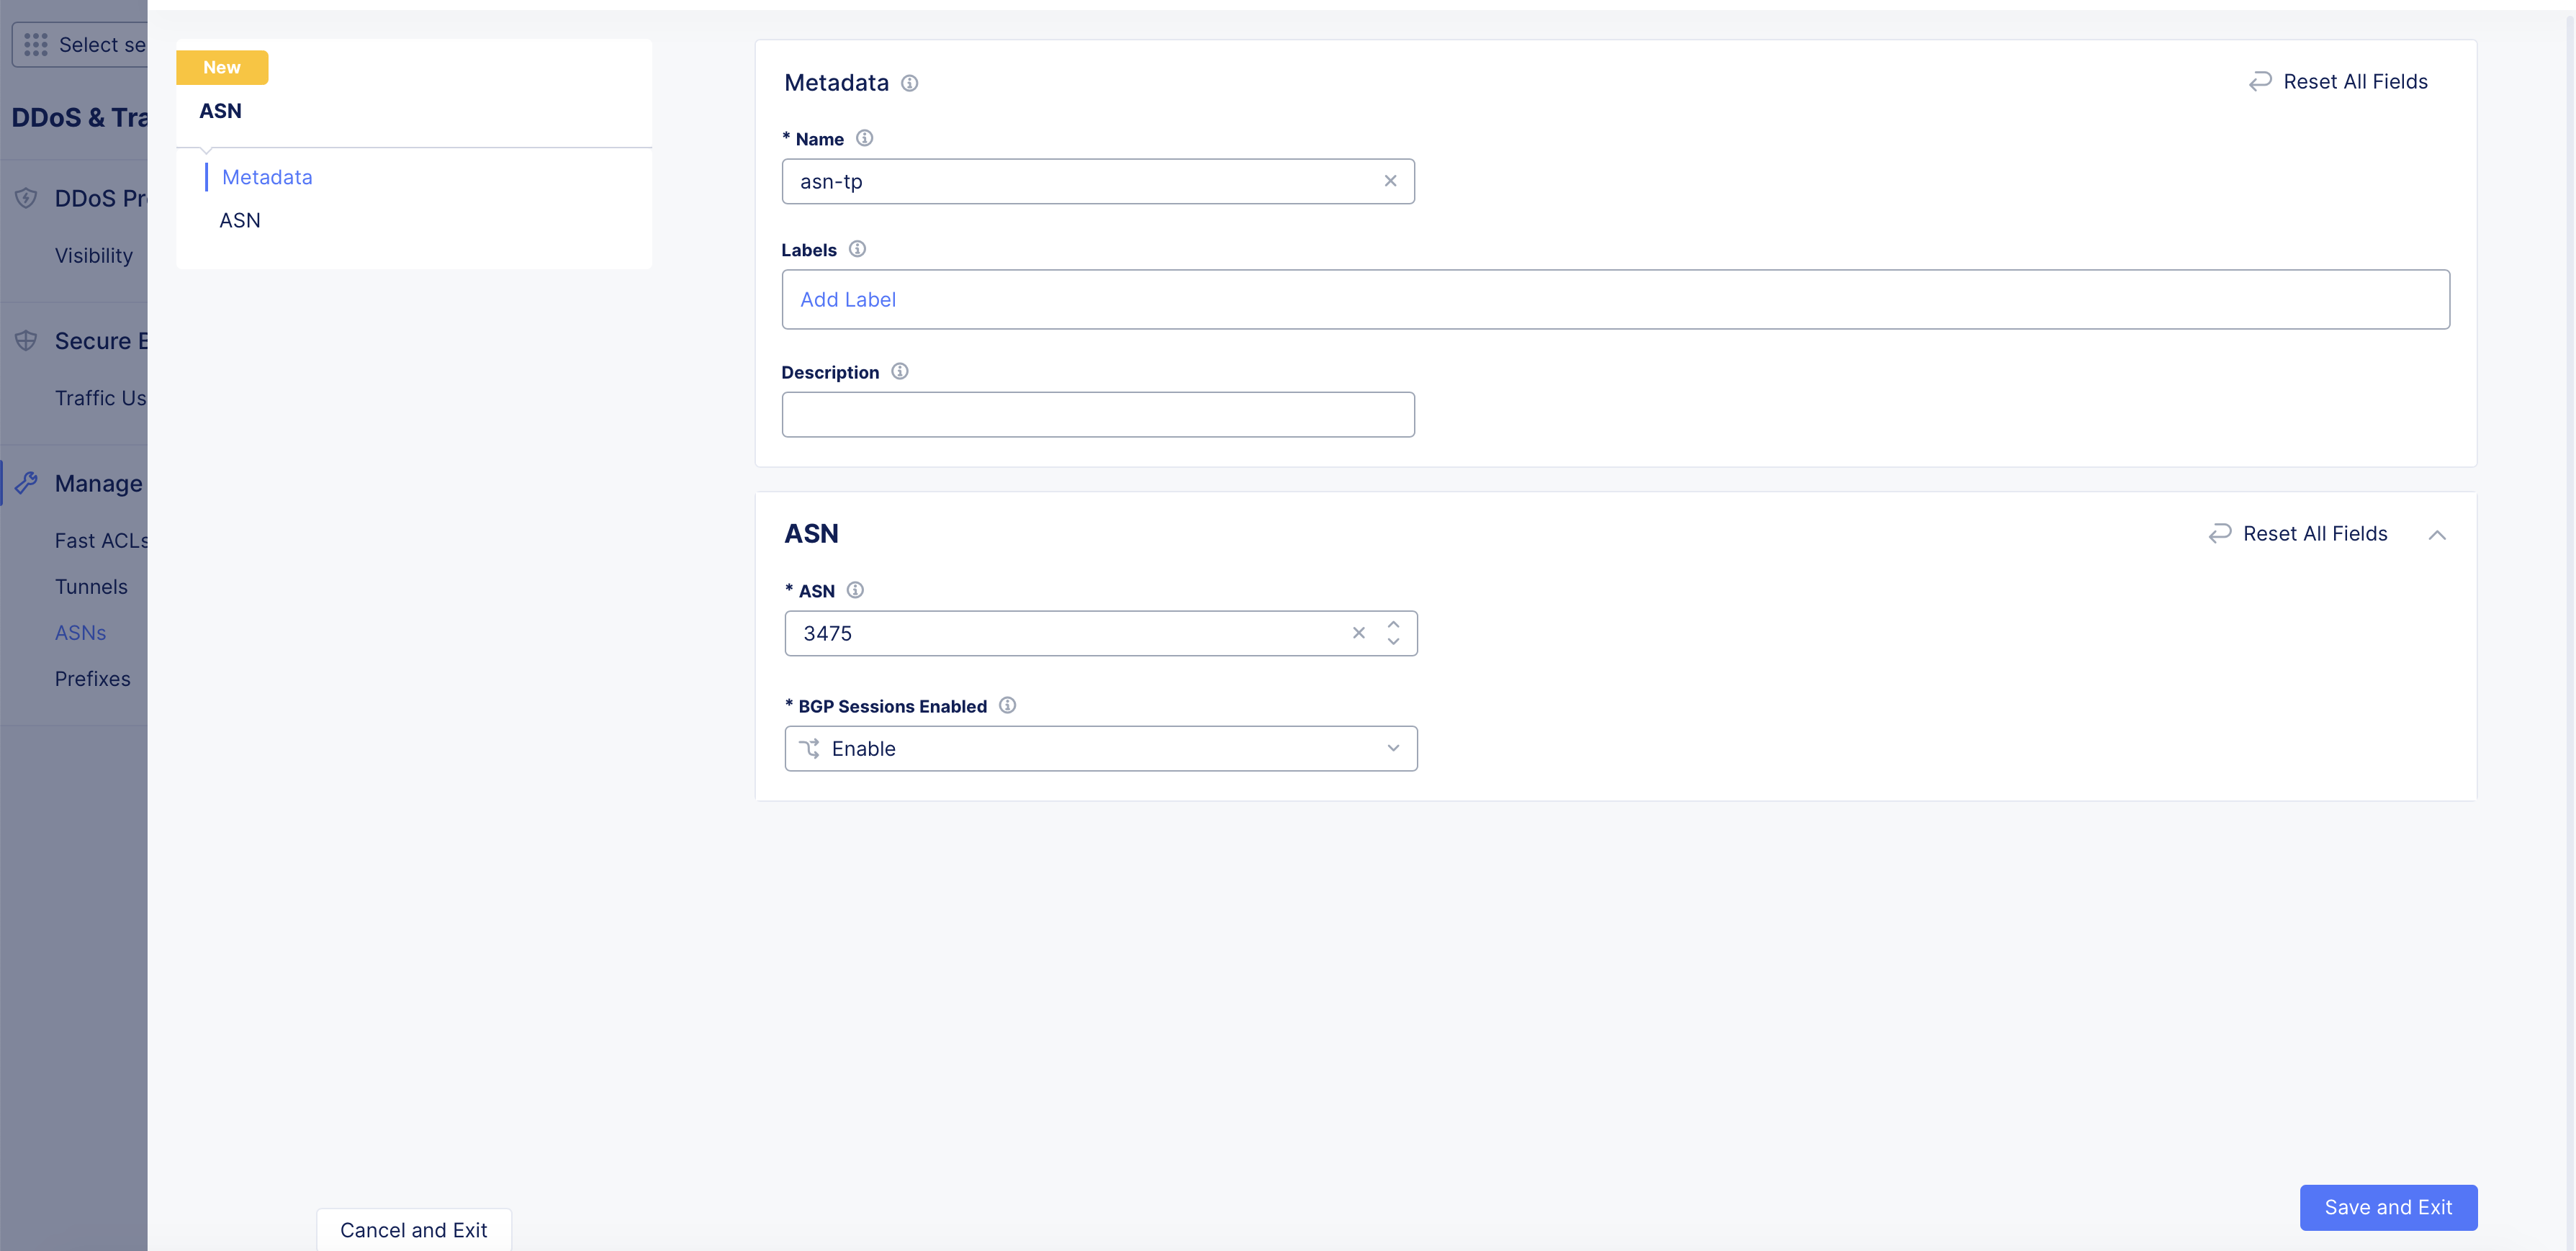
Figure: ASN Configuration
- Click on the Use a BGP Neighbor drop-down and select whether BGP sessions are to be enabled or disabled. The Enable option is selected by default.
Step 3: Complete creating ASN object.
Select Add ASN button to complete creating the ASN object.
Configure Prefixes
Prefix object creates a prefix vs ASN mapping so that you can enable ASN-based protection and mitigation for specific prefixes. Perform the following to create specific prefix and ASN mappings:
Step 1: Start creating prefix mapping.
-
Select Manage in left column menu, and then select Prefixes.
-
Click Add Prefix and this opens the new object creation form.
-
Enter a name for your prefix mapping, and optionally set labels and description.
Step 2: Configure prefix mapping settings.
- Enter an IP prefix in the Prefix field in the IP address/prefix-length format.
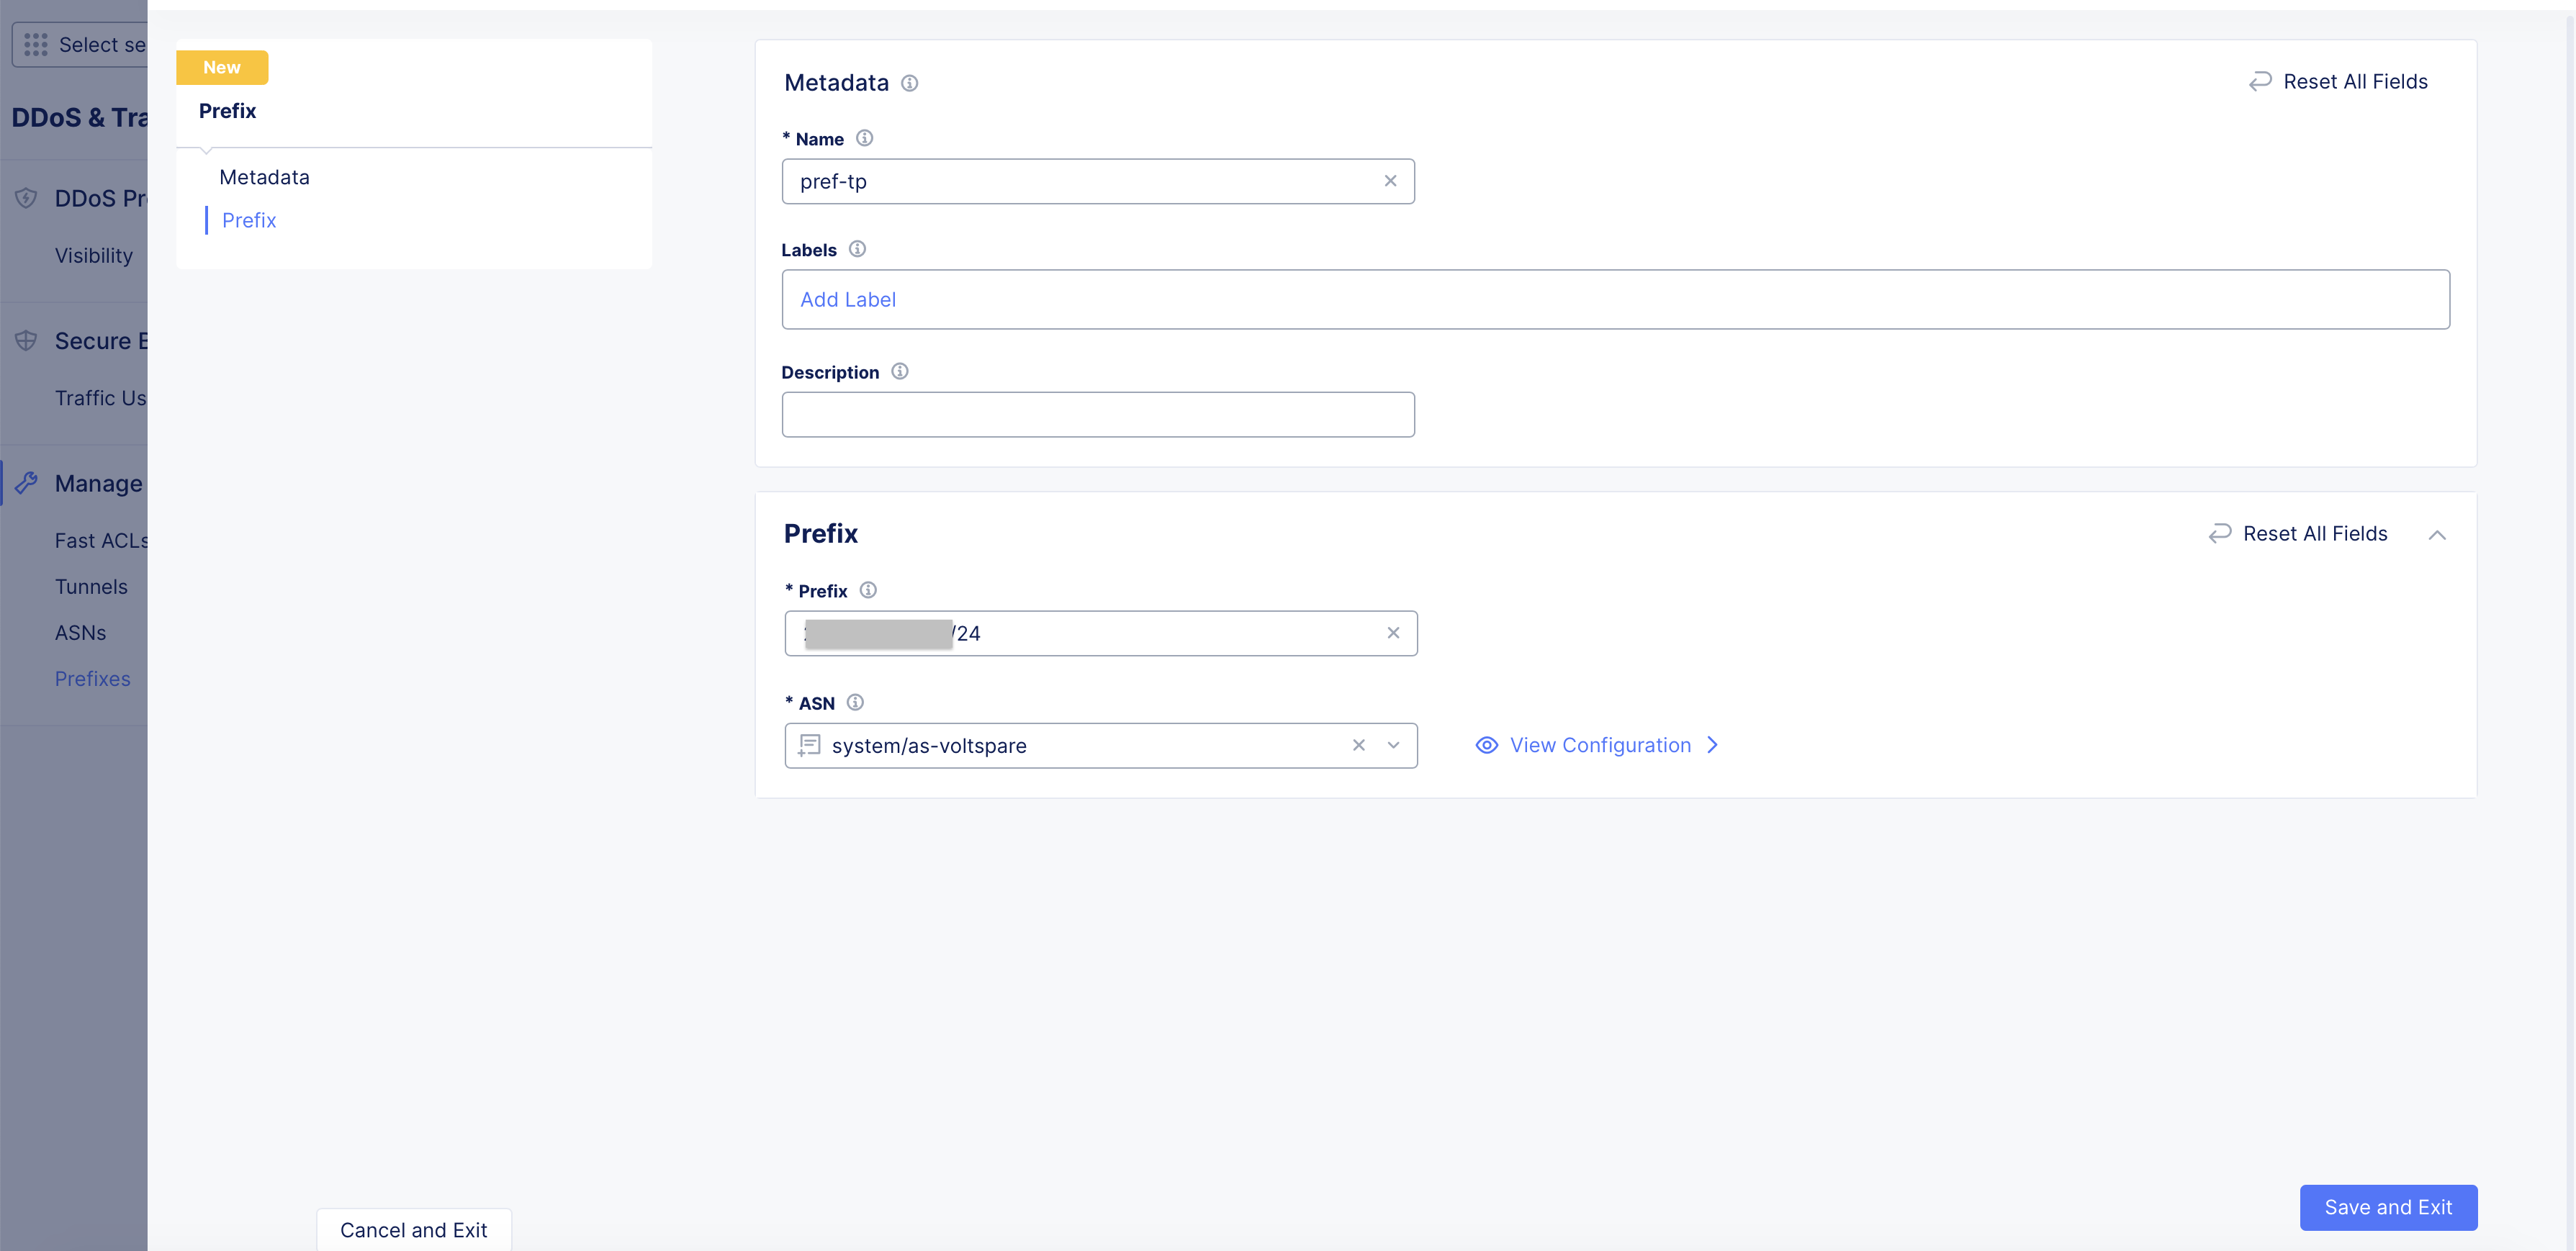
Figure: Prefix Configuration
- Click on the ASN drop-down and select ASN to be associated with this prefix.
Step 3: Complete creating prefix mapping.
Select Add Prefix button to complete creating the prefix mapping.
Configure Route Advertisement
You can configure specific prefixes for advertising using the route advertisement objects. Perform the following to advertise specific prefixes:
Step 1: Start creating route advertisement.
-
Select Manage in left column menu, and then select Route Advertisement.
-
Click Add Route Advertisement and this opens the new object creation form.
-
Enter a name for your route advertisement object, and optionally set labels and description.
Step 2: Configure prefix settings.
-
Enter an internet prefix in the Prefix field in the IP address/prefix-length format.
-
Click on the Activation Selection drop-down and select whether this prefix is to be actively advertised or not. Active advertisement is selected by default.
Step 3: Set advanced configuration.
In the Advanced configuration section, click on the Expiration drop-down and do as per the following guidelines:
- Select Expiration Time (UTC) and enter an expiration timestamp in the UTC format in the Expiration Time (UTC) field. After the expiration of this time, mitigation for this route will be deactivated.
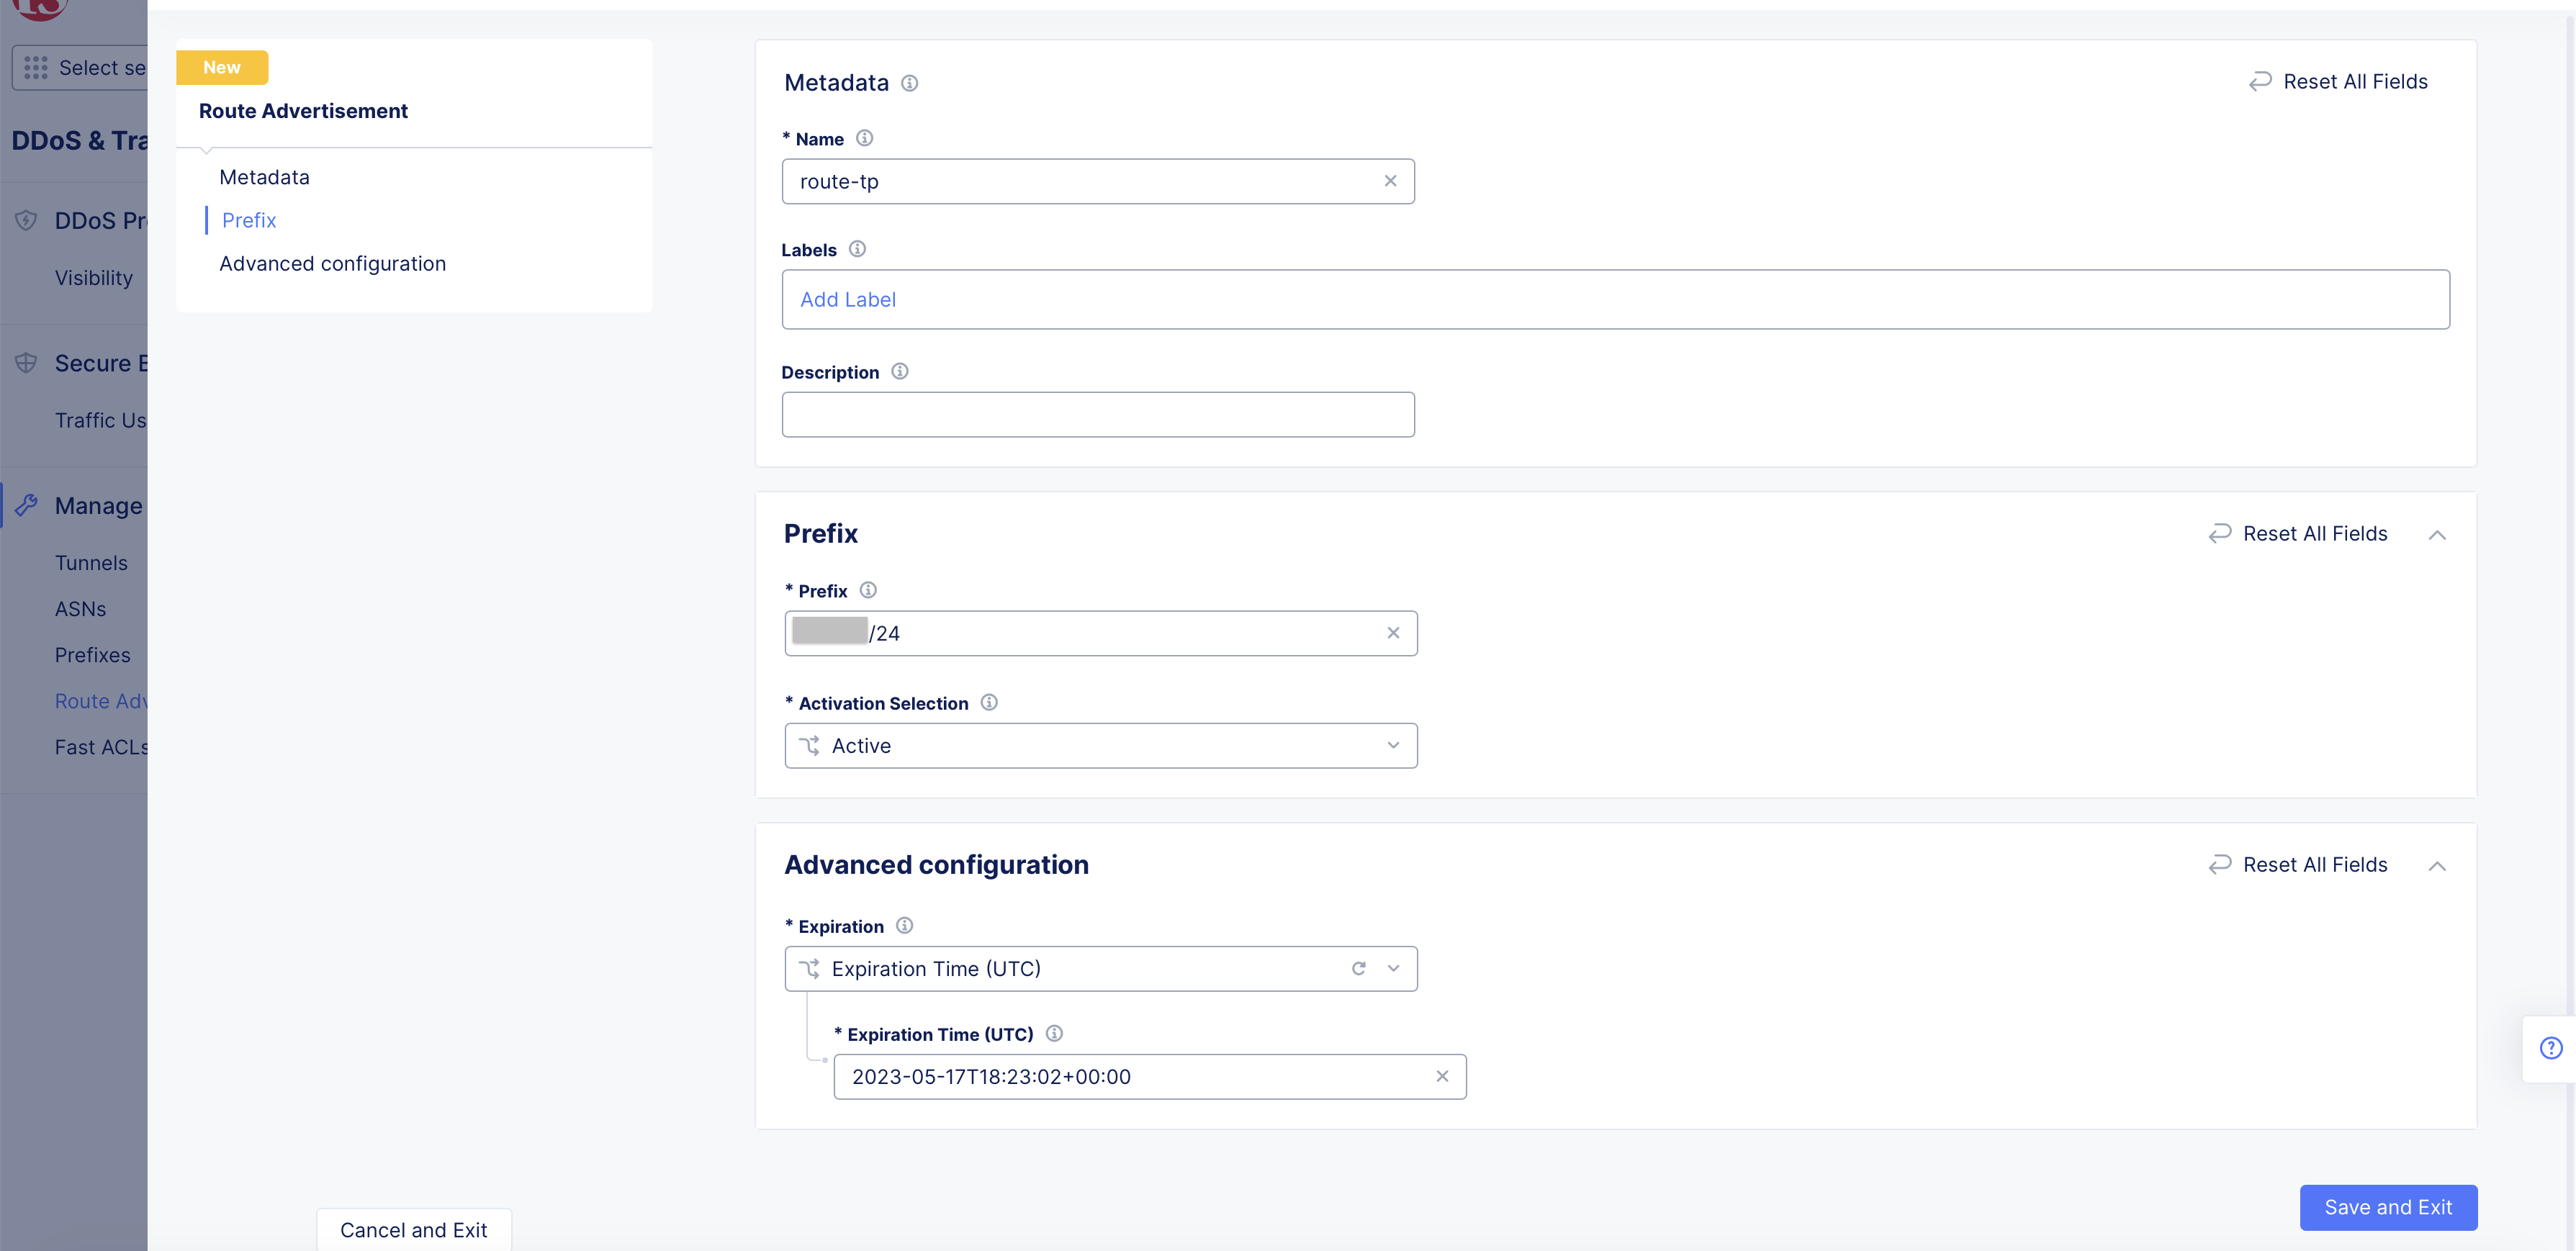
Figure: Route Advertisement Configuration
- Select Never to always keep mitigation active for this route. This is also set by default.
Step 4: Complete creating route advertisement.
Select Add Route Advertisement button to complete creating the route advertisement.
Configure Firewall Rules
Step 1: Start creating firewall rules.
-
Select Manage in left column menu, and then select Firewall Rules.
-
Select Firewall Rules.
-
Select + Add Firewall Rule and this opens the new object creation form.
-
Enter a name for your firewall rule object, and optionally set labels and description.
Step 2: Configure prefix settings.
-
Select Version.
-
Select Source Prefix, enter Prefix, default option, if All Prefixes is not selected.
-
Select Destination Prefix, enter Prefix, default option, if All Prefixes is not selected.
-
Select Protocol.
-
Select Source Port.
-
Select Port Range.
-
-
Select Destination Port, enter Port Range, default option, if All is not selected.
-
Enter Description.
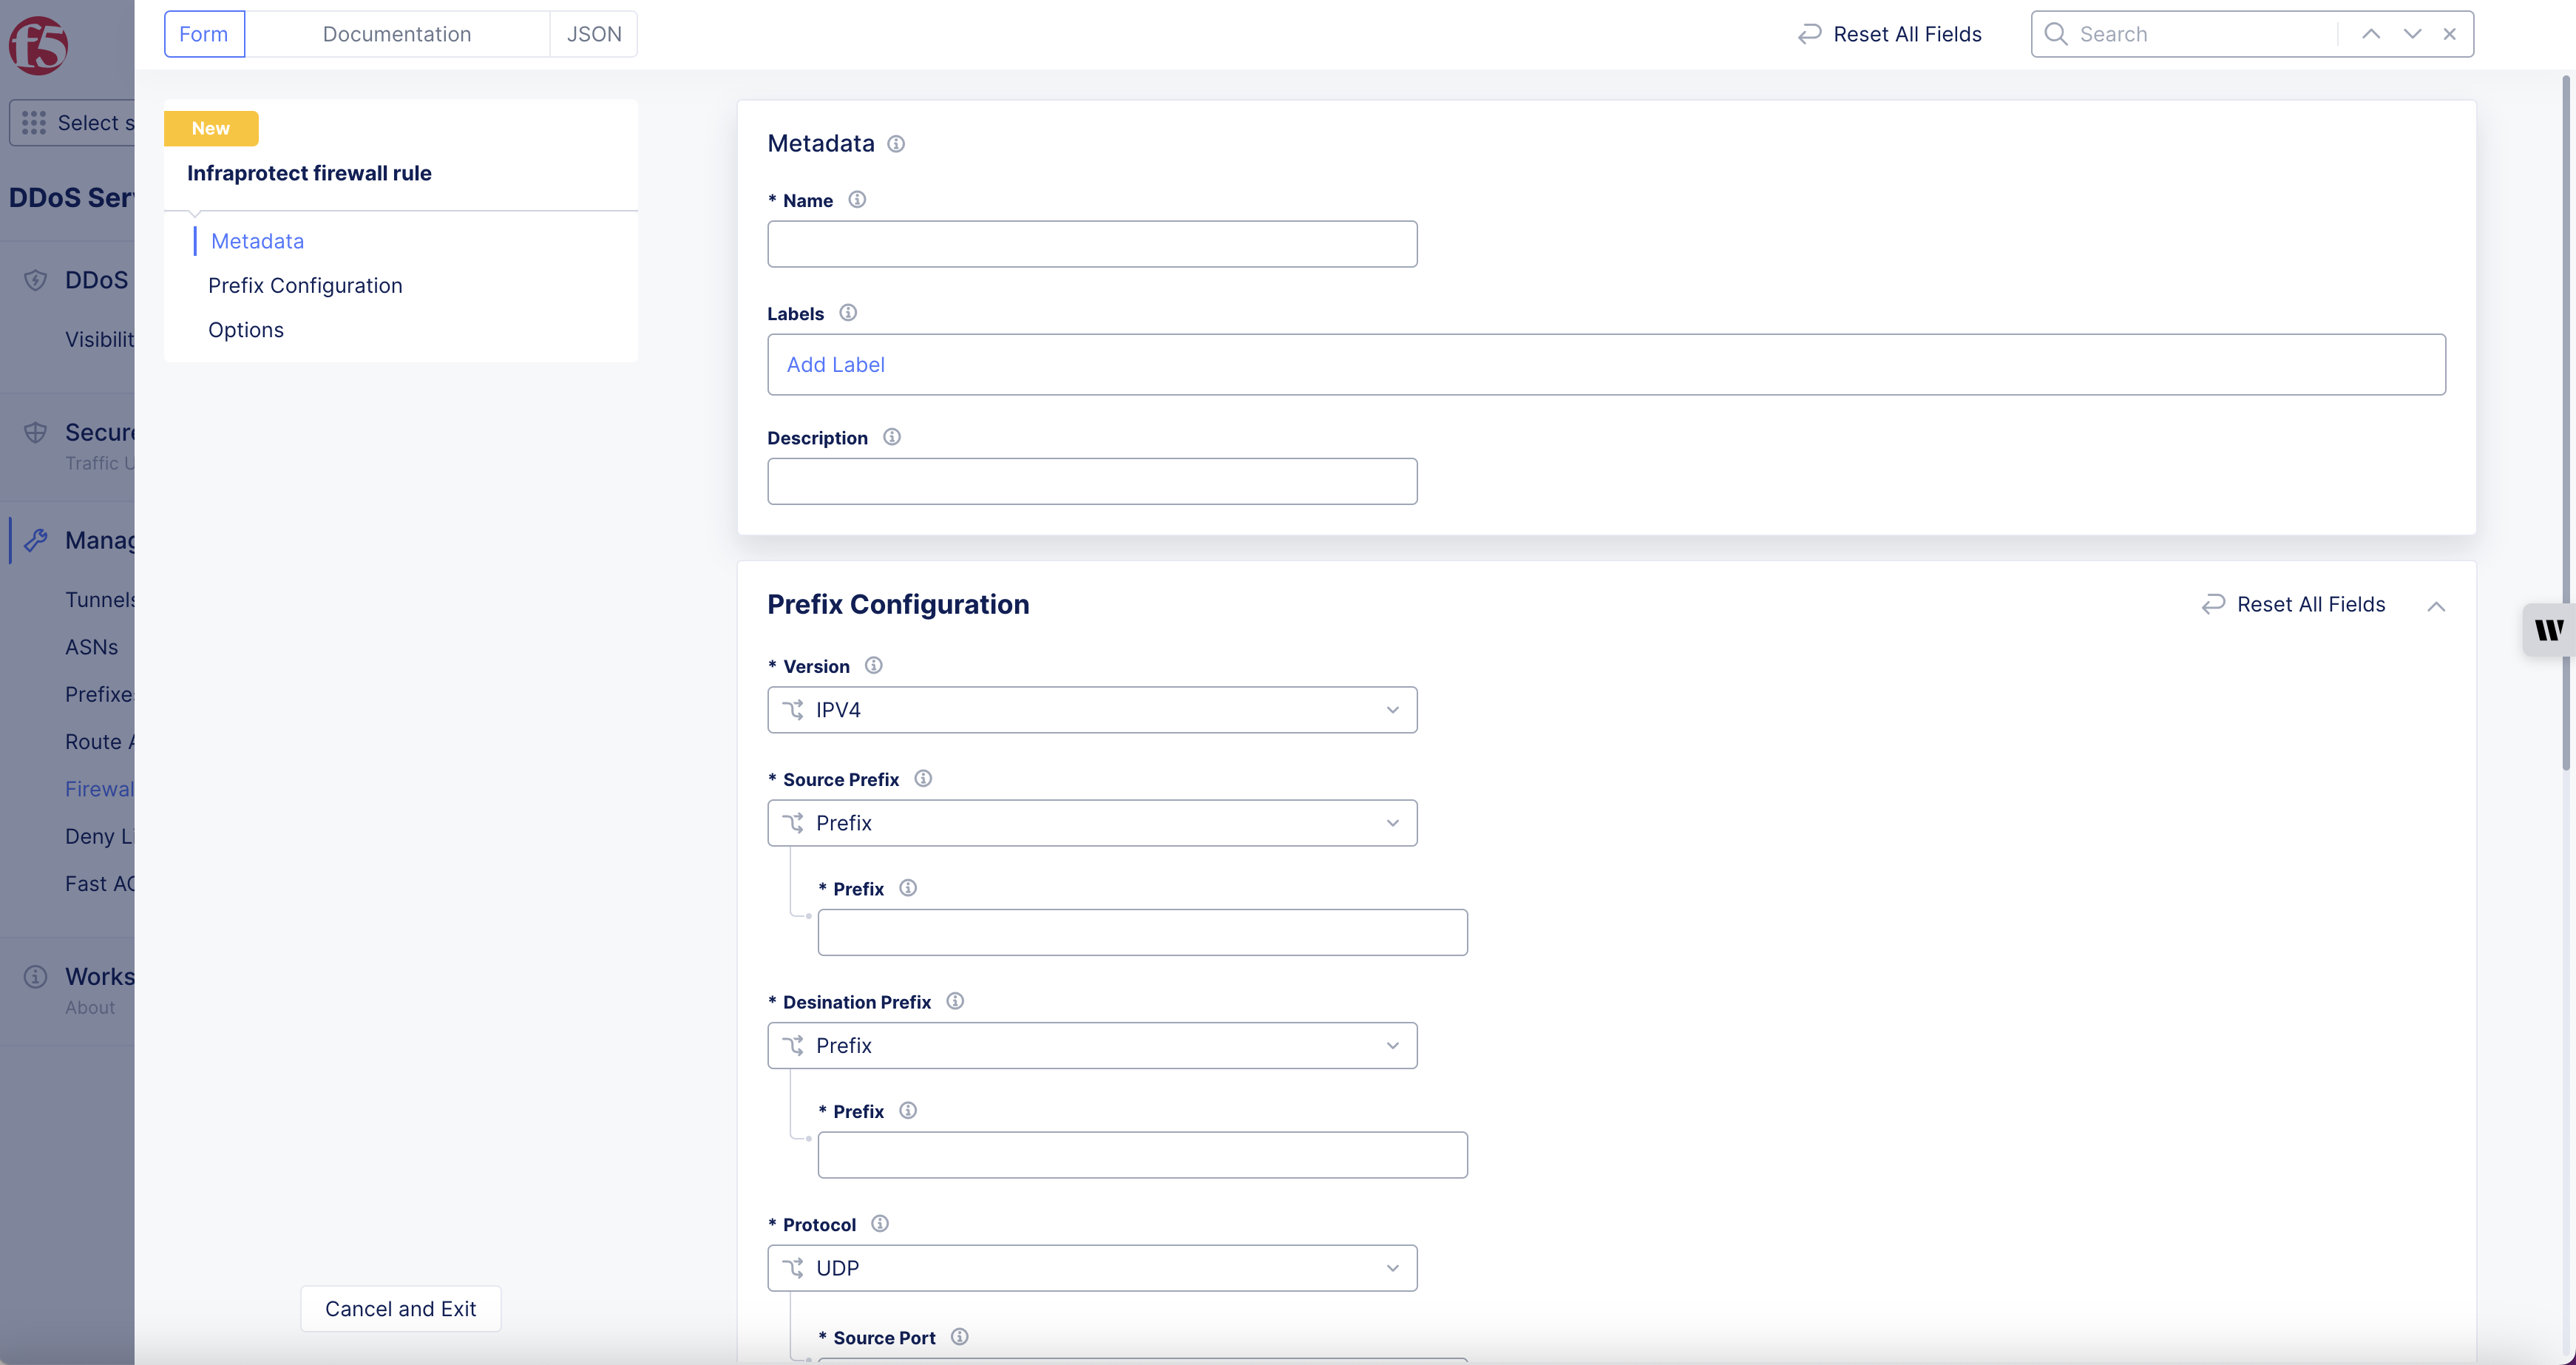
Figure: Firewall Rules Configuration
Step 3: Setup options.
-
Select Action in Options box. Deny is default.
-
Select State, Off is default.
Note: To enable firewall rule options State needs to be On.
- Select Fragments, Deny is default.
Note: Set Allow in Fragments option to allow fragments in destination.
Step 4: Complete creating firewall rules.
-
Select Add Firewall Rule button to complete creating the route advertisement.
-
Select Firewall Rules > IPv4 & IPv6 Firewall Rules to view and edit firewall rules.
Configure Deny List Rules
Step 1: Start creating deny list rules.
-
Select Manage in left column menu, select Deny List Rules.
-
Select Add Deny List Rule to open new object creation form.
-
Enter a name for your deny list object, and optionally set labels and description.
Step 2: Configure prefix settings.
-
Enter an internet prefix in the Prefix field in the IP address/prefix-length format.
-
Click on the Expiration drop-down and select when this prefix is to expire. Never is selected by default.
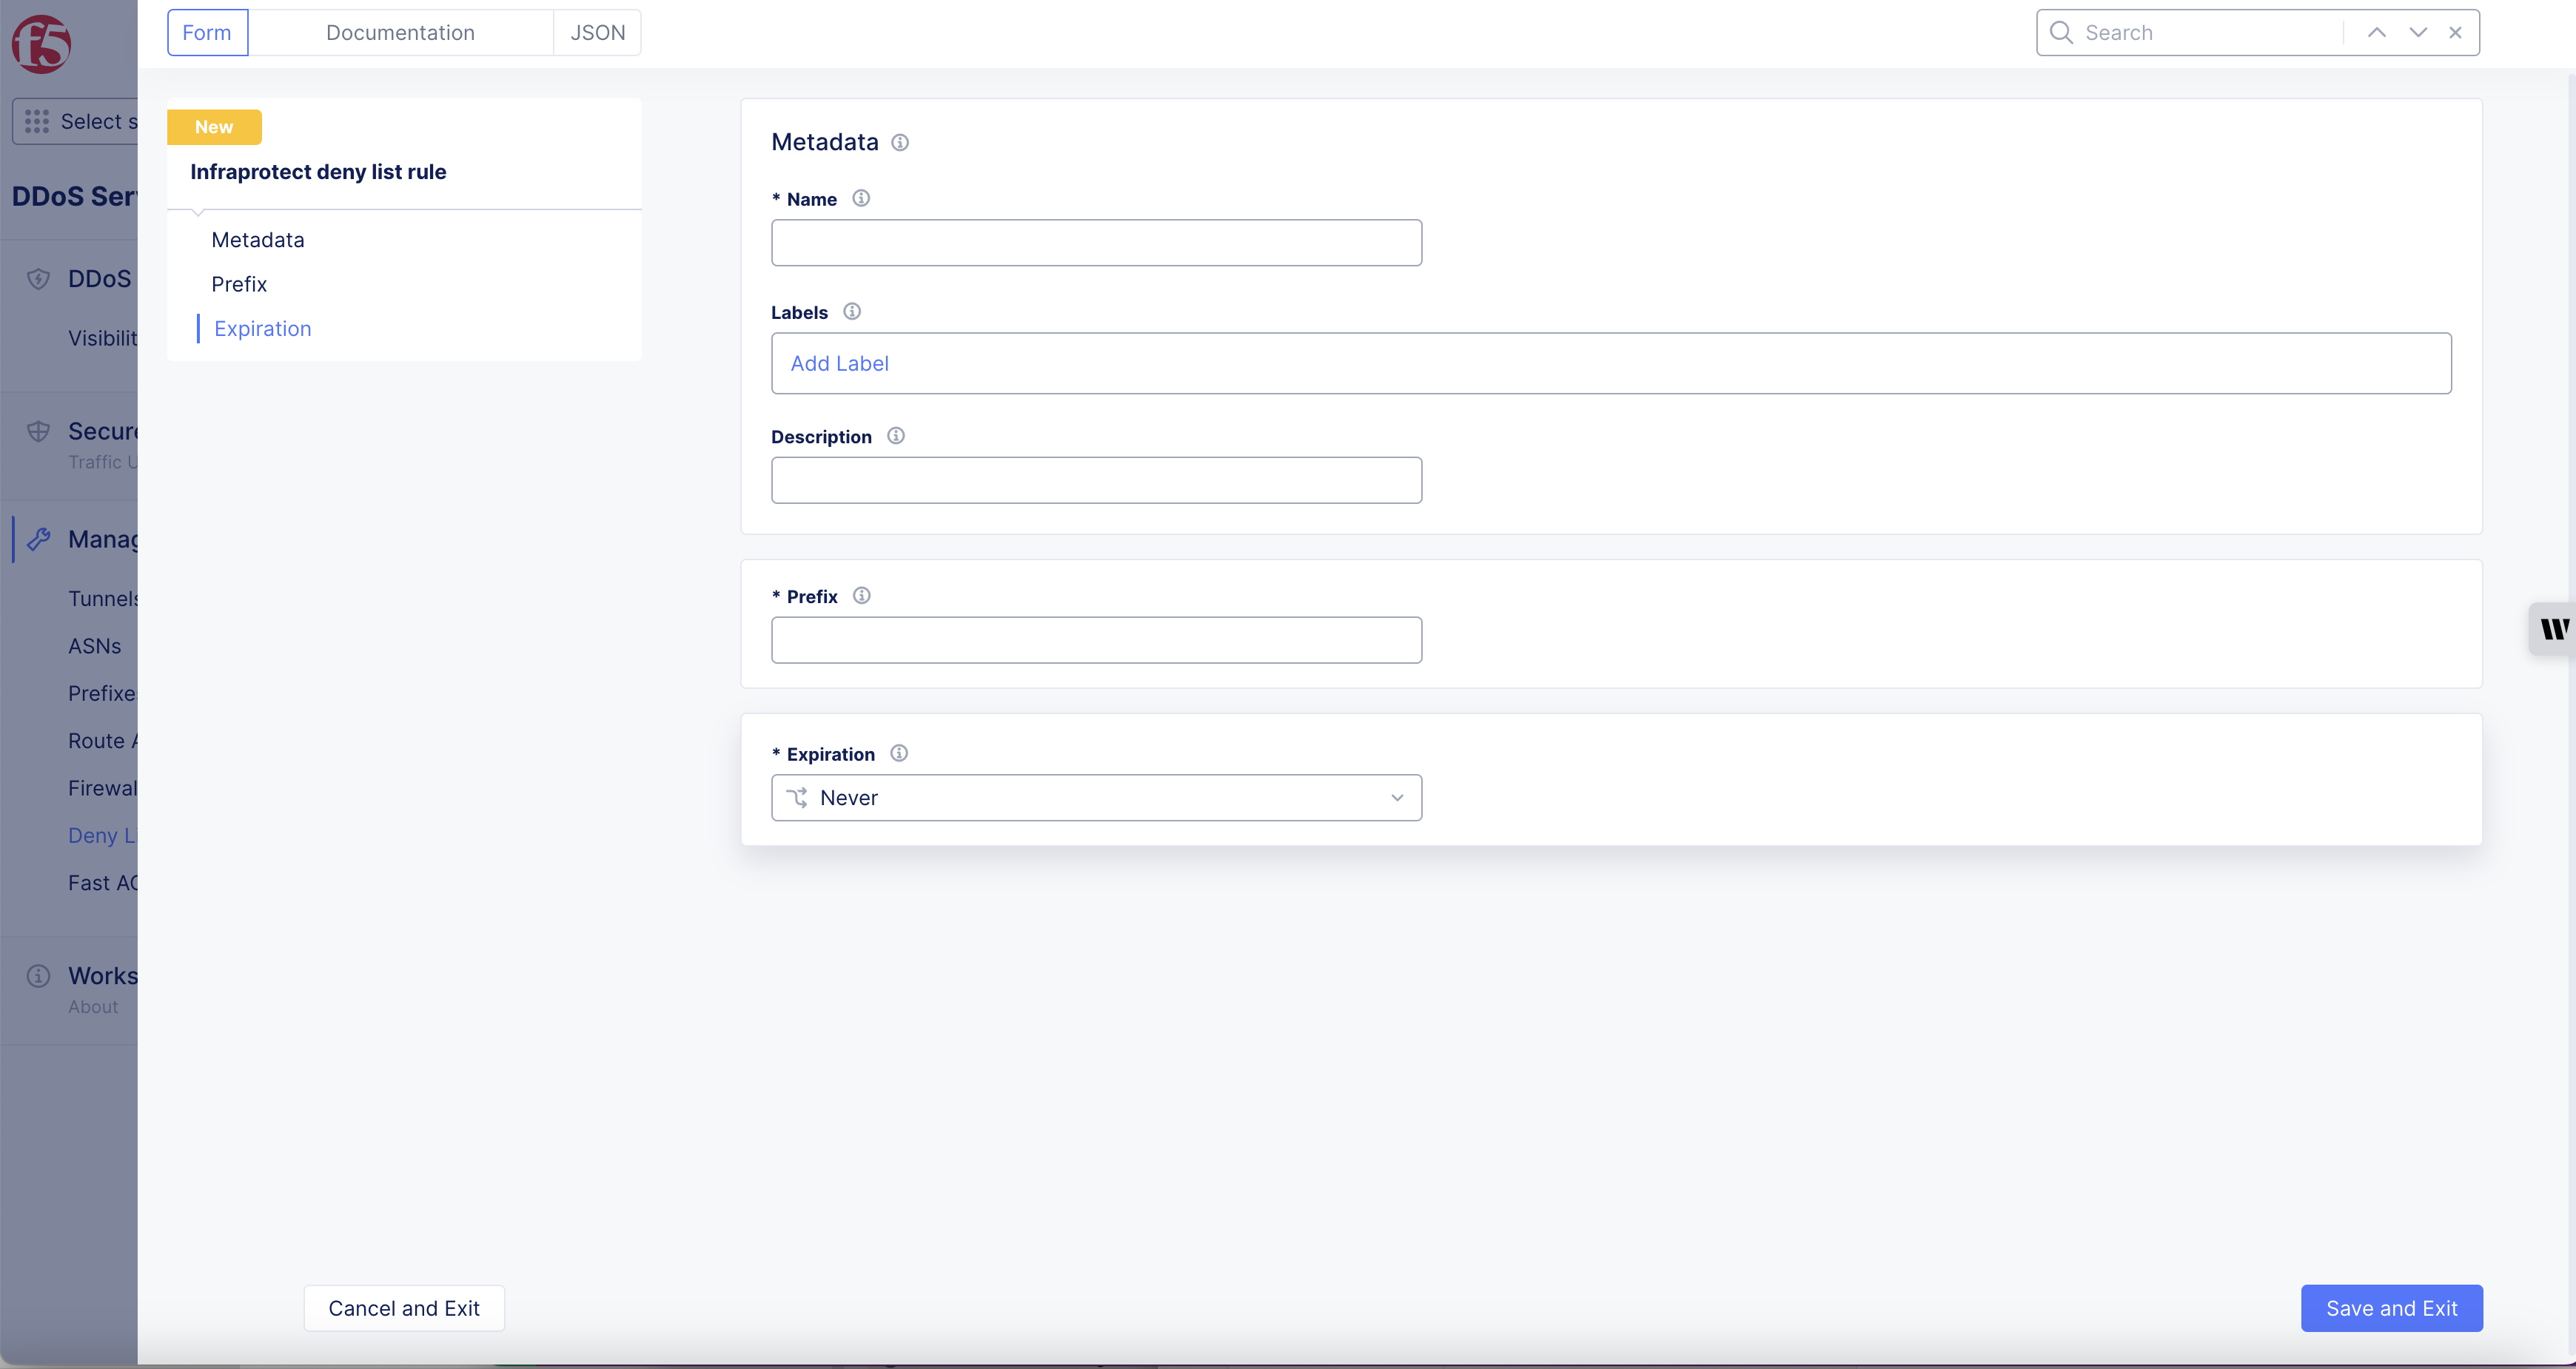
Figure: Deny List Rules Configuration
Step 3: Complete creating Deny List rules.
Select Add Deny List Rule button to complete creating the deny list rules.
Configure Fast ACLs
A Fast ACL protects from Denial of Service (DoS) attacks and can be applied to your network entities. Using the Fast ACLs, you can block traffic from specific sources, or apply rate limit to the traffic from the specific source. There are 2 types of Fast ACL objects - Fast ACLs and Fast ACLs for Internet VIPs. In the DDoS mitigation service, you can only configure the Fast ACLs for Internet VIPs object.
Note: You can add Fast ACLs object while configuring Fast ACLs for Internet VIPs. However, Fast ACLs must be already created either by you or by F5 SOC, prior to adding them to the Fast ACLs for Internet VIPs. For more information, see Fast ACLs guide.
Perform the following to configure Fast ACLs for DDoS mitigation service:
Step 1: Start creating Fast ACLs for Internet VIPs.
-
Select Manage in left column menu, and then select Fast ACLs for Internet VIPs.
-
Click Select Fast ACLs for Internet VIPs and this opens the new object creation form.
Step 2: Attach Fast ACL objects and complete setting the Fast ACL.
- In the Select Fast ACLs for Internet VIPs form, click on the drop-down in the Fast ACLs column, and select a Fast ACL object.
Note: You can use the Add Item button to add more than one Fast ACL object.
- Select Add Select Fast ACls for Internet VIPs button to complete creating the Fast ACLs for Internet VIPs.
Monitor Activities and Obtain Reports
When the network entities are provisioned, any custom settings are applied, and DDoS mitigation is activated, you can view the scrubbing activity and usage statistics using the dashboards available in the Console. The following steps provide information on how to access various dashboards and understand the information provided through the dashboards.
Explore DDoS Protection Visibility
Navigate to the DDoS protection dashboard and explore various sections:
Dashboard
In the DDoS and Transit Services page, select DDoS Protection > Visibility. The DDoS protection dashboard page opens. The following list provides information on the various sections in the dashboard.
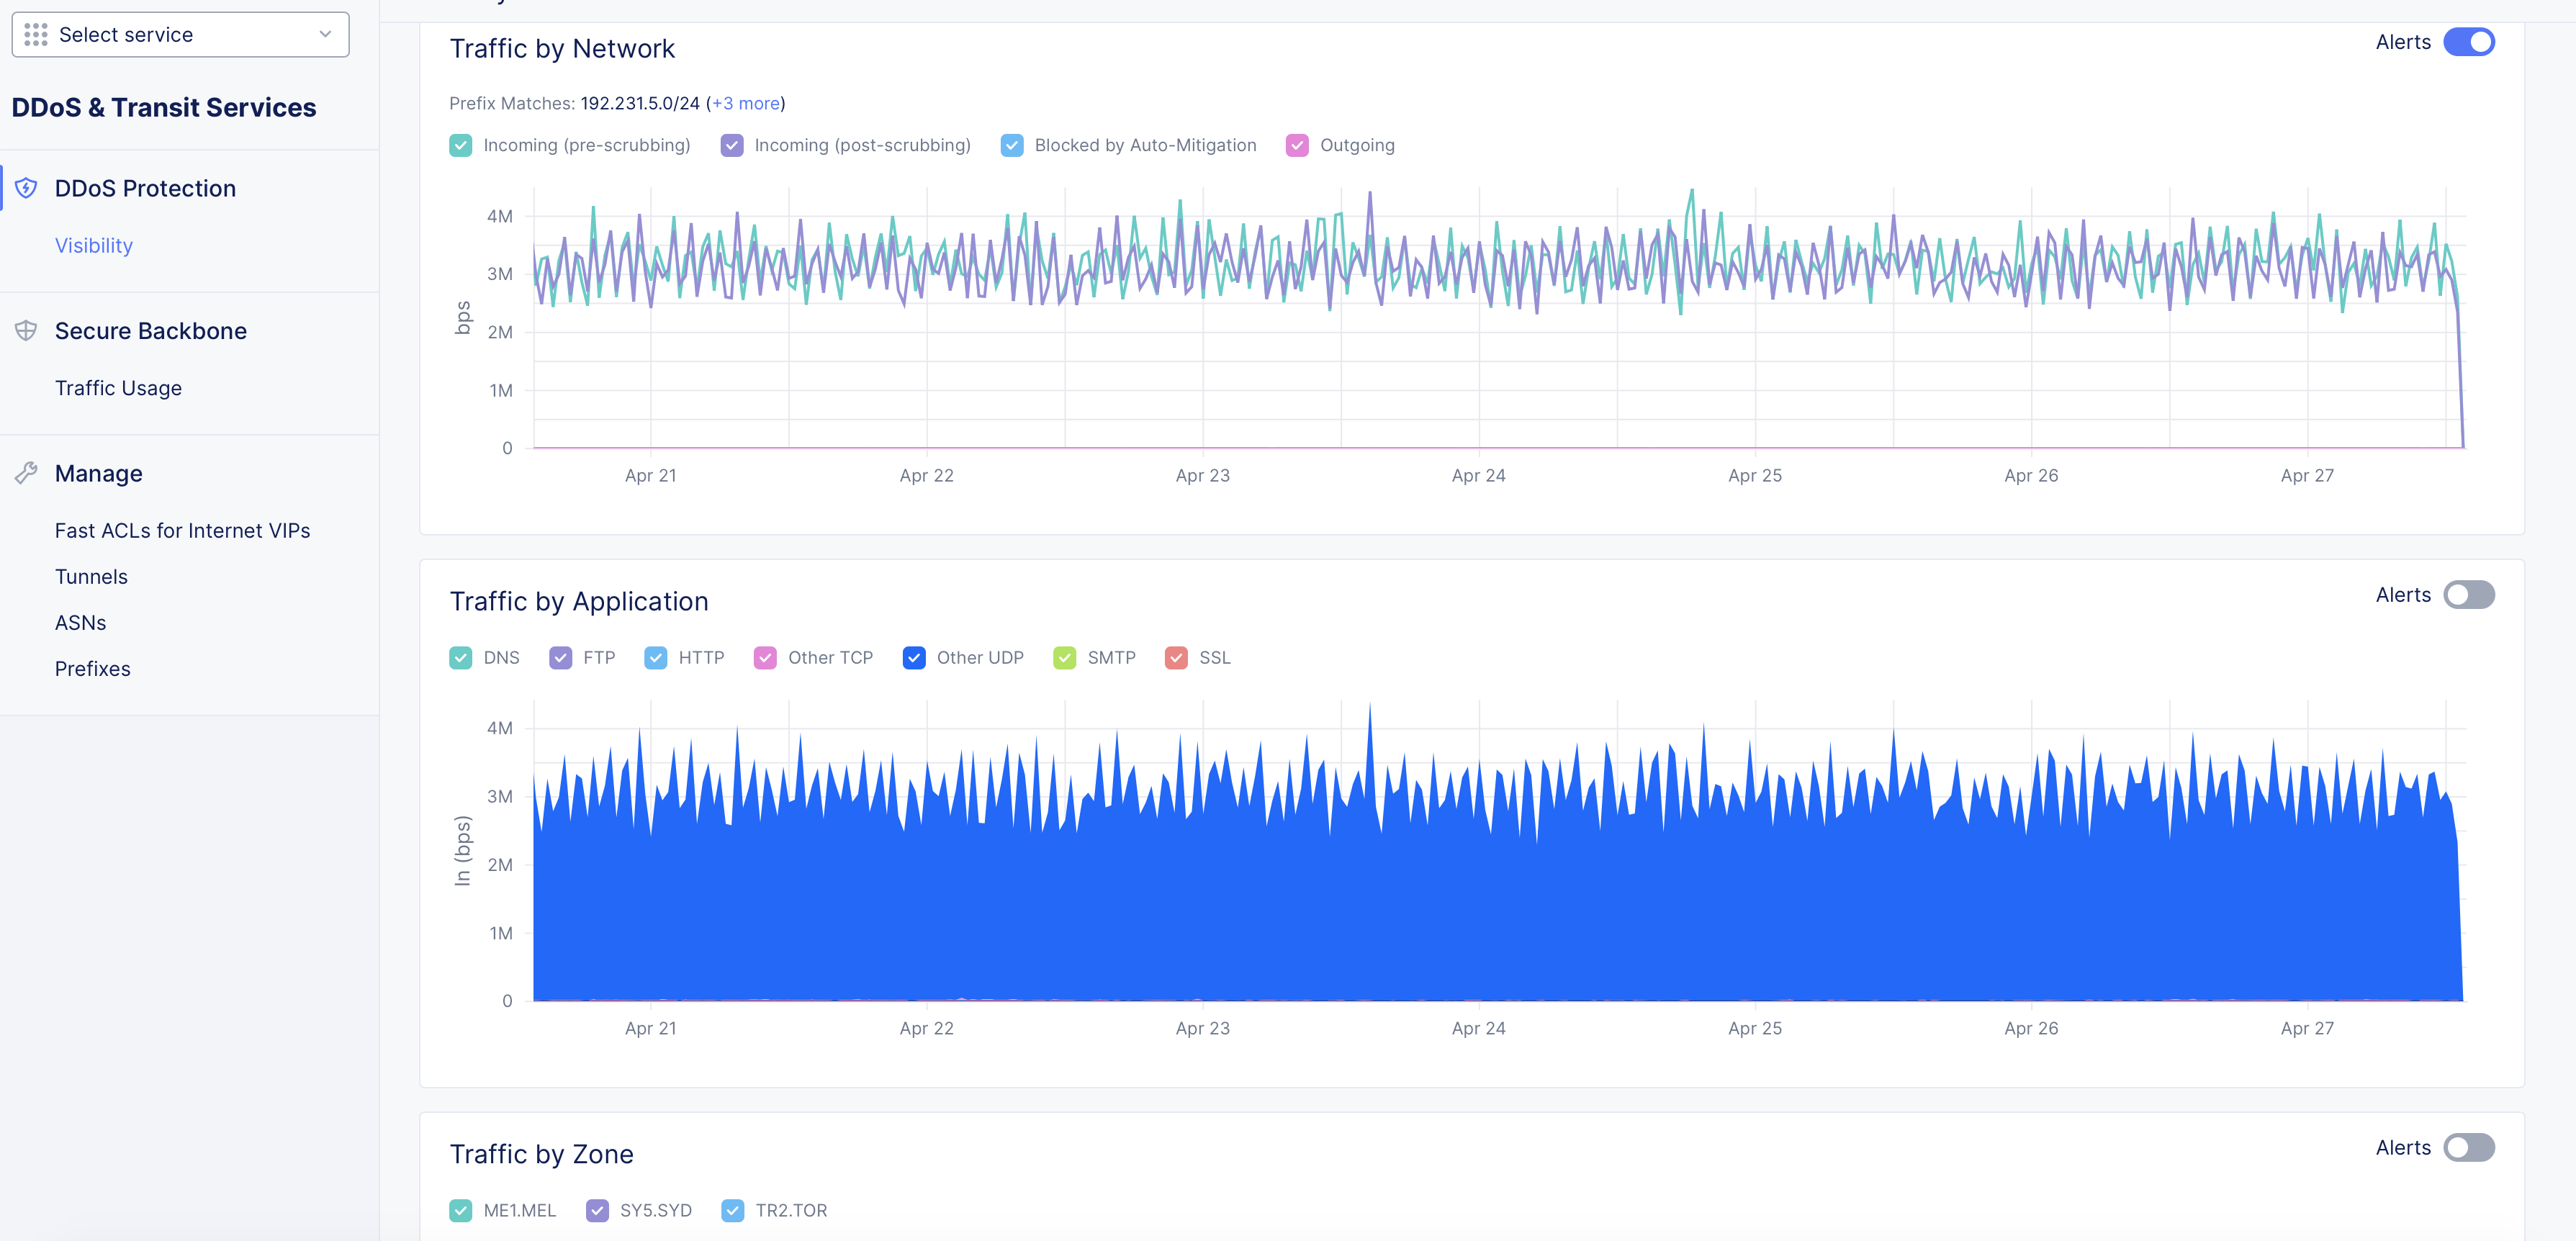
Figure: DDoS Dashboard
Traffic by Network
- The Traffic by Network section shows trend for incoming and outgoing traffic in a graph view. The graph shows Incoming (pre-scrubbing), Incoming (post-scrubbing), Blocked by Auto-Mitigation, and Outgoing traffic.
- Place the mouse pointer on any section of the graph to view the statistics for that particular date.
- Select or unselect any of the incoming, outgoing, or blocked traffic to apply filters on the graph accordingly.
- Click on +more in the value of Prefix Matches field to view various prefixes for which the mitigation is applied.
- Switch the Alerts toggle off to hide alert trends in the graph. This is turned on by default.
Traffic by Application
- The Traffic by Application section shows graph for traffic of various application protocols such as DNS, FTP, HTTP, etc.
- Place the mouse pointer on any section of the graph to view the statistics for that particular date. Both incoming and outgoing traffic in Kbps are displayed for each protocol traffic.
- Select or unselect any of the application protocols to apply filters on the graph accordingly.
- Switch the Alerts toggle on to display alert trends in the graph.
Traffic by Zone
- The Traffic by Zone section shows graph for traffic of various location zones.
- Place the mouse pointer on any section of the graph to view the statistics for that particular date. Both incoming and outgoing traffic in Kbps are displayed for each zone.
- Select or unselect any of the zones to apply filters on the graph accordingly.
- Switch the Alerts toggle on to display alert trends in the graph.
Dashboard Filters
The dashboard contents are dependent on the controls in the right-justified, top bar of options.
- The network traffic drop-down determines traffic from which network is shown in the dashboard. The default network is voltend_routed.
- The time drop-down allows you to specify the time period for the data shown, including both quick-pick options like Last 7 days and the ability to specify a custom time period. The time drop down also allows you to set a refresh interval.
- The data measurement drop-down allows you to specify whether to display the graph in bits per second (bps) or packets per second (pps). The default measurement is Show bps.
- The Refresh button allows you to update the contents of the dashboard manually.
Events
Click on the Events tab to open the events page and explore the functionality using the following guidelines:
-
The events are displayed in a table view with each row having event name, creator, source IP, start time, end time, and actions. There is also a Chart ctab to view the events in a bar chart.
-
Click on any event to open the event's specific monitoring page. The Alerts tab is displayed by default.
- Click on the Mitigation Annotations tab to view the annotation details related to the event. These details include creator, description of event, and created time.
- Click on the Pcap tab to view the packet capture information. You can also add a capture using the Add Pcap option.
- Click on the Event Details tab to view the details related to event such as creator, title, created time, attachments, and actions. Actions include editing the information and deleting it. You can also add an event detail using the Add Event Detail option to add a specific event information.
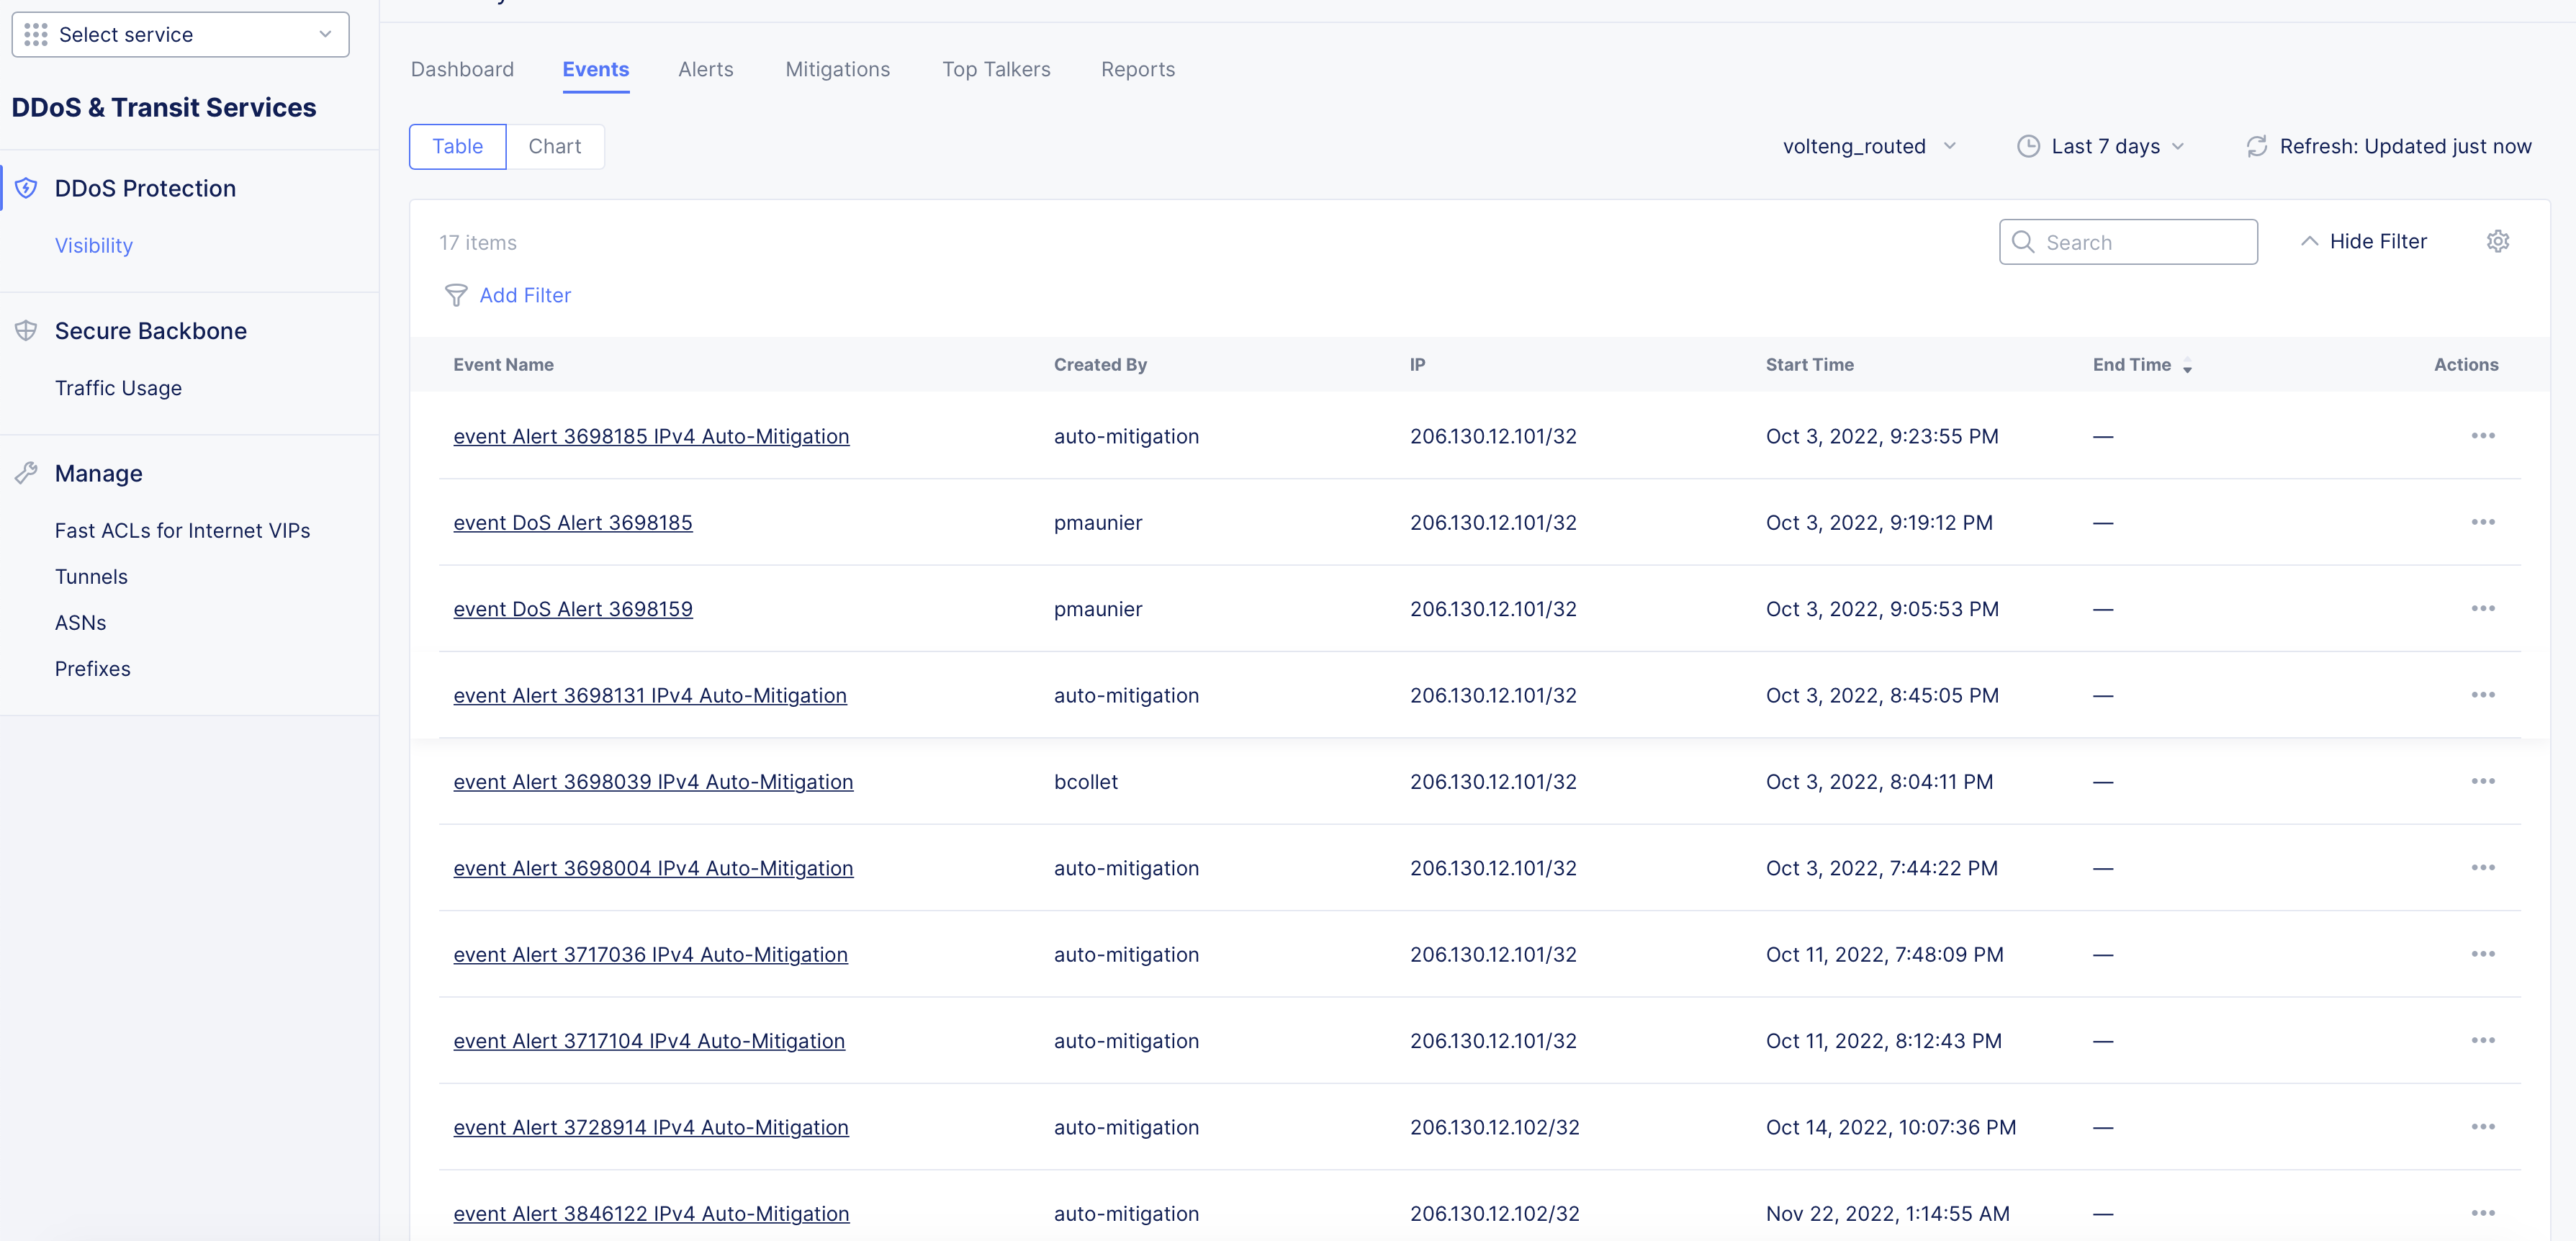
Figure: DDoS Events View
- Click ... in the Actions column against any event to view detail of the event, add detail to it, or add a packet capture. The View Details option will load the Event Details page of monitoring view specific to that event.
Note: Similar to dashboard filters, events view also has the network traffic filter, time interval selector, and refresh options located on the top of the page. You can use these filters to adjust the view as per your need.
Alerts
Click on the Alerts tab to open the alerts page and explore the functionality using the following guidelines:
-
The alerts are displayed in a table view with each row having alert number, source IP, start time, end time, bandwidth, alert type, and associated event.
-
Click on any alert number to view the prefixes and ports related to that alert in a modeless window.
-
Click Edit button in the Events column for any alert to change the event assignment to that alert.
Note: Similar to dashboard filters, alerts view also has the network traffic filter, time interval selector, and refresh options located on the top of the page. You can use these filters to adjust the view as per your need.
Mitigations
Click on the Mitigations tab to open the mitigations page and explore the functionality using the following guidelines:
-
Mitigations are displayed in a table view with each row having mitigation, source IP, network, status (ongoing or not), and start time.
-
Click on a mitigation to open its specific monitoring page. The Dashboard tab is displayed by default.
-
Dashboard shows the mitigation breakdown in terms of total and invalid packets in a graph. Place mouse pointer anywhere on the graph to view total and invalid packets in bits per second on that date. Use the controls on top right for switching measurement unit, time interval, refresh, and sort filter. Using the sort filter, you can adjust the graph to display based on maximum (peak) traffic, average traffic, or ignore short spikes in traffic.
-
Click on the Blocked IPs tab to view the blocked IPs and their log count.
-
Click on the Annotations tab to view the announcement or notification in the form of an annotation.
-
Click on the Details tab to view the details related to the mitigation such as description, prefixes, etc.
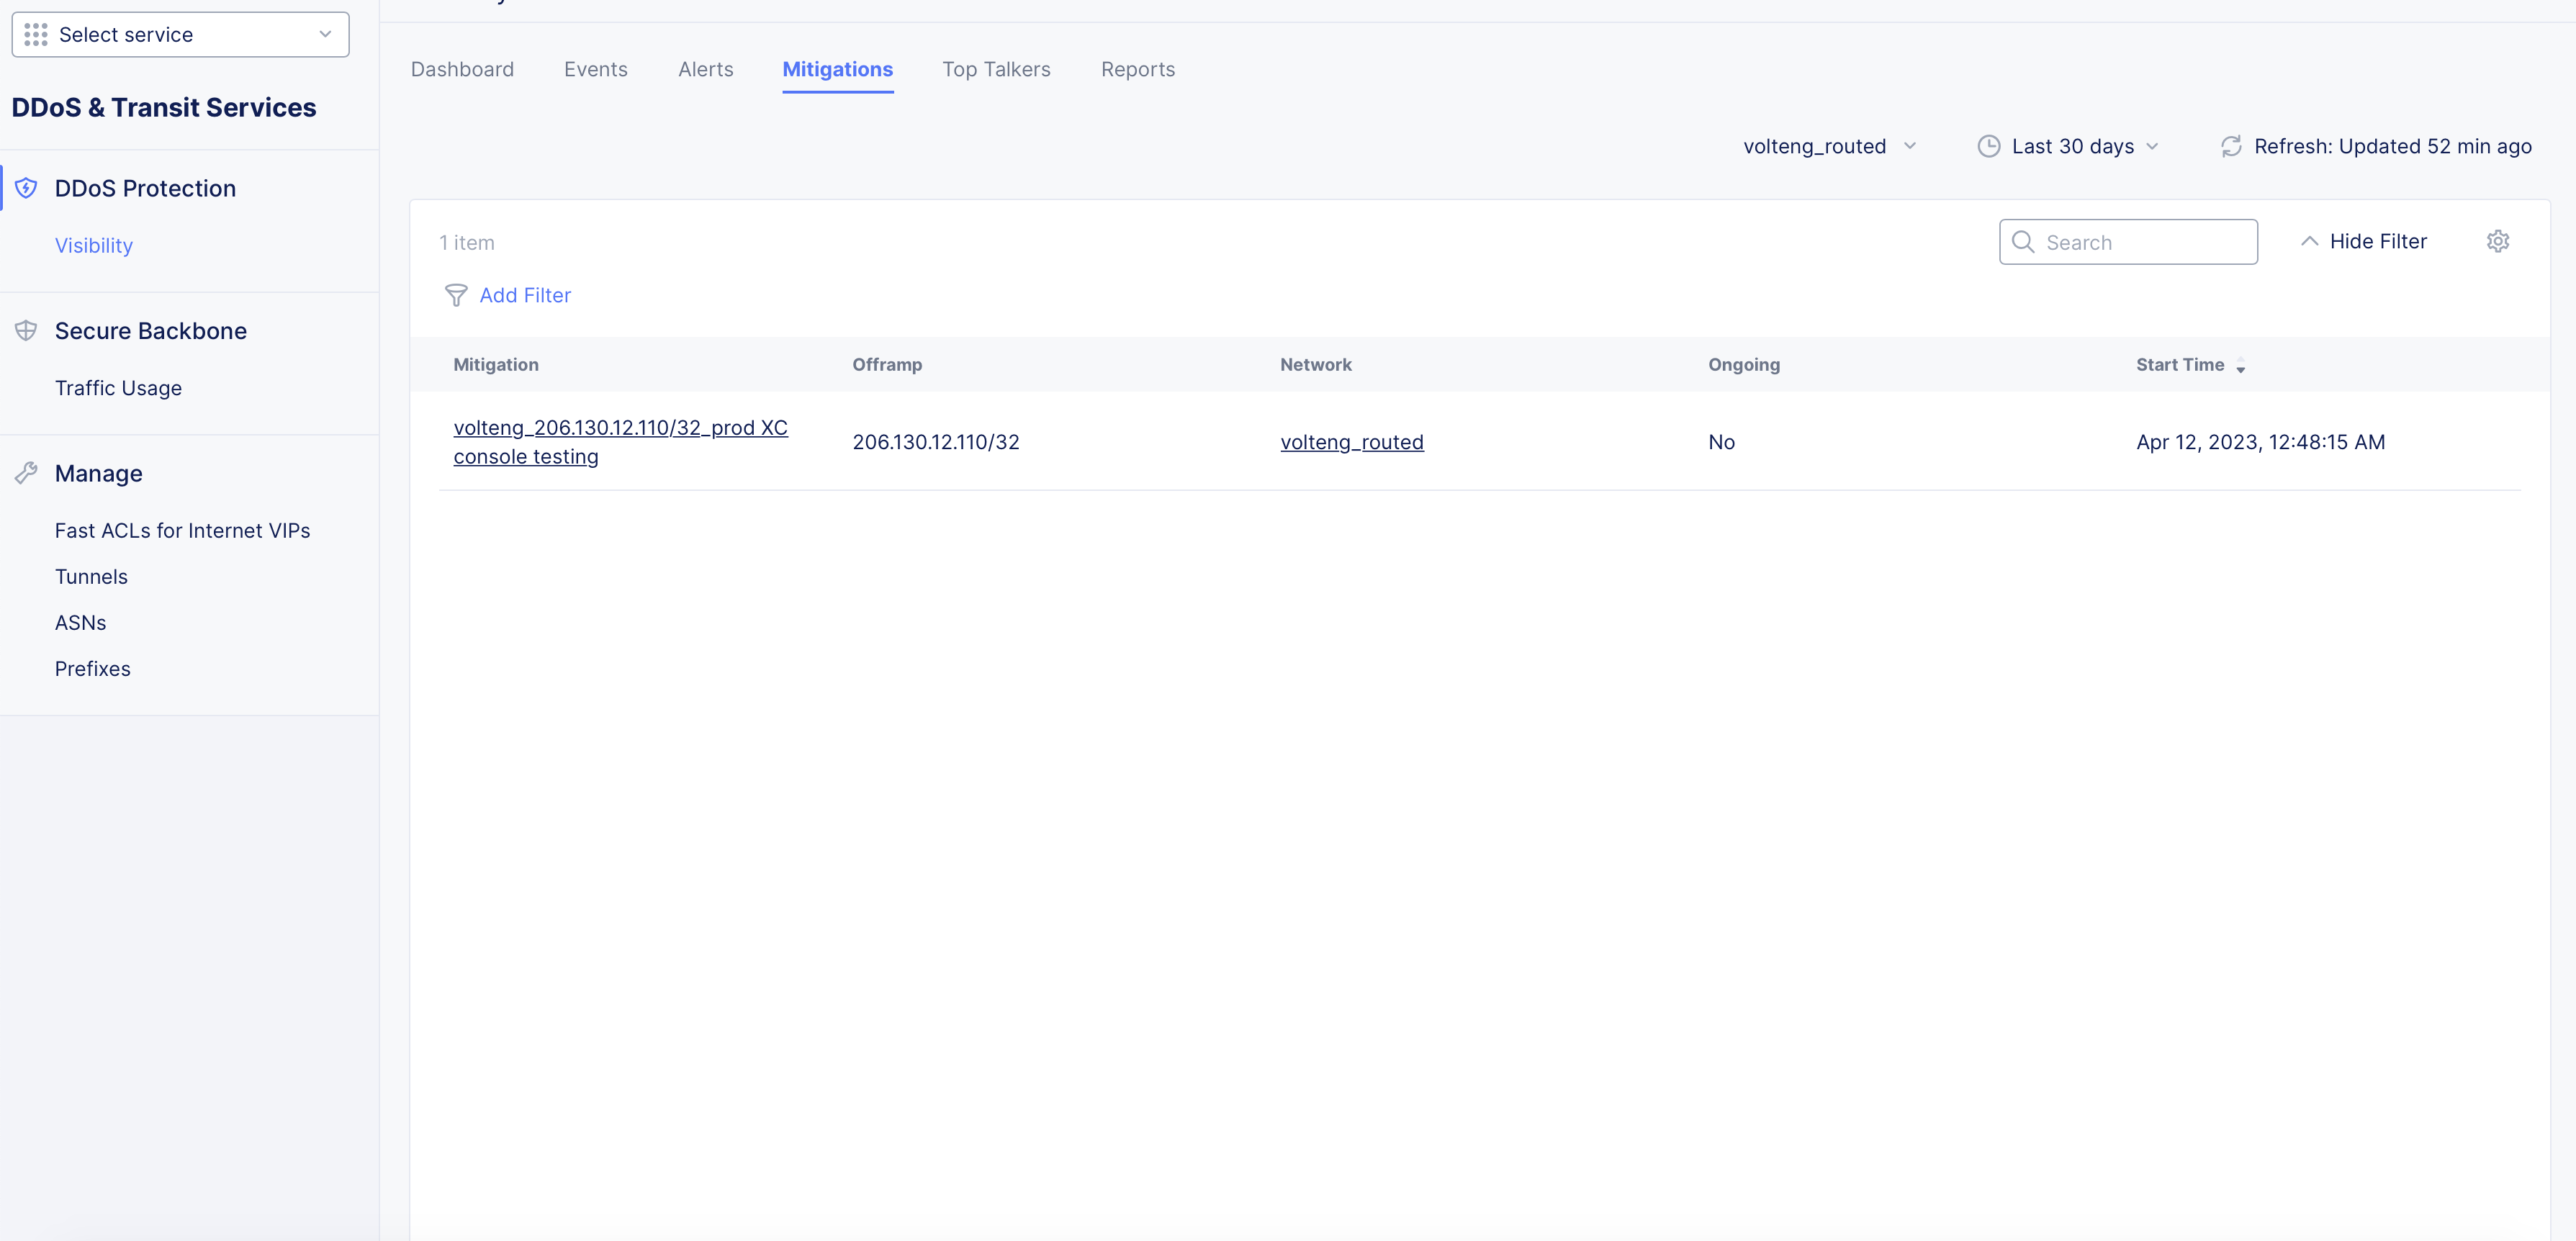
Figure: DDoS Mitigations Monitoring View
Note: Similar to dashboard filters, events view also has the network traffic filter, time interval selector, and refresh options located on the top of the page. You can use these filters to adjust the view as per your need.
Top Talkers
Click on the Top Talkers tab. Top talkers are the sources from which most traffic is sent and identified by source IP addresses. Top talkers are displayed in a table view with each row having source IP, incoming traffic, and outgoing traffic columns. The incoming and outgoing traffic are displayed in bits per second (bps).
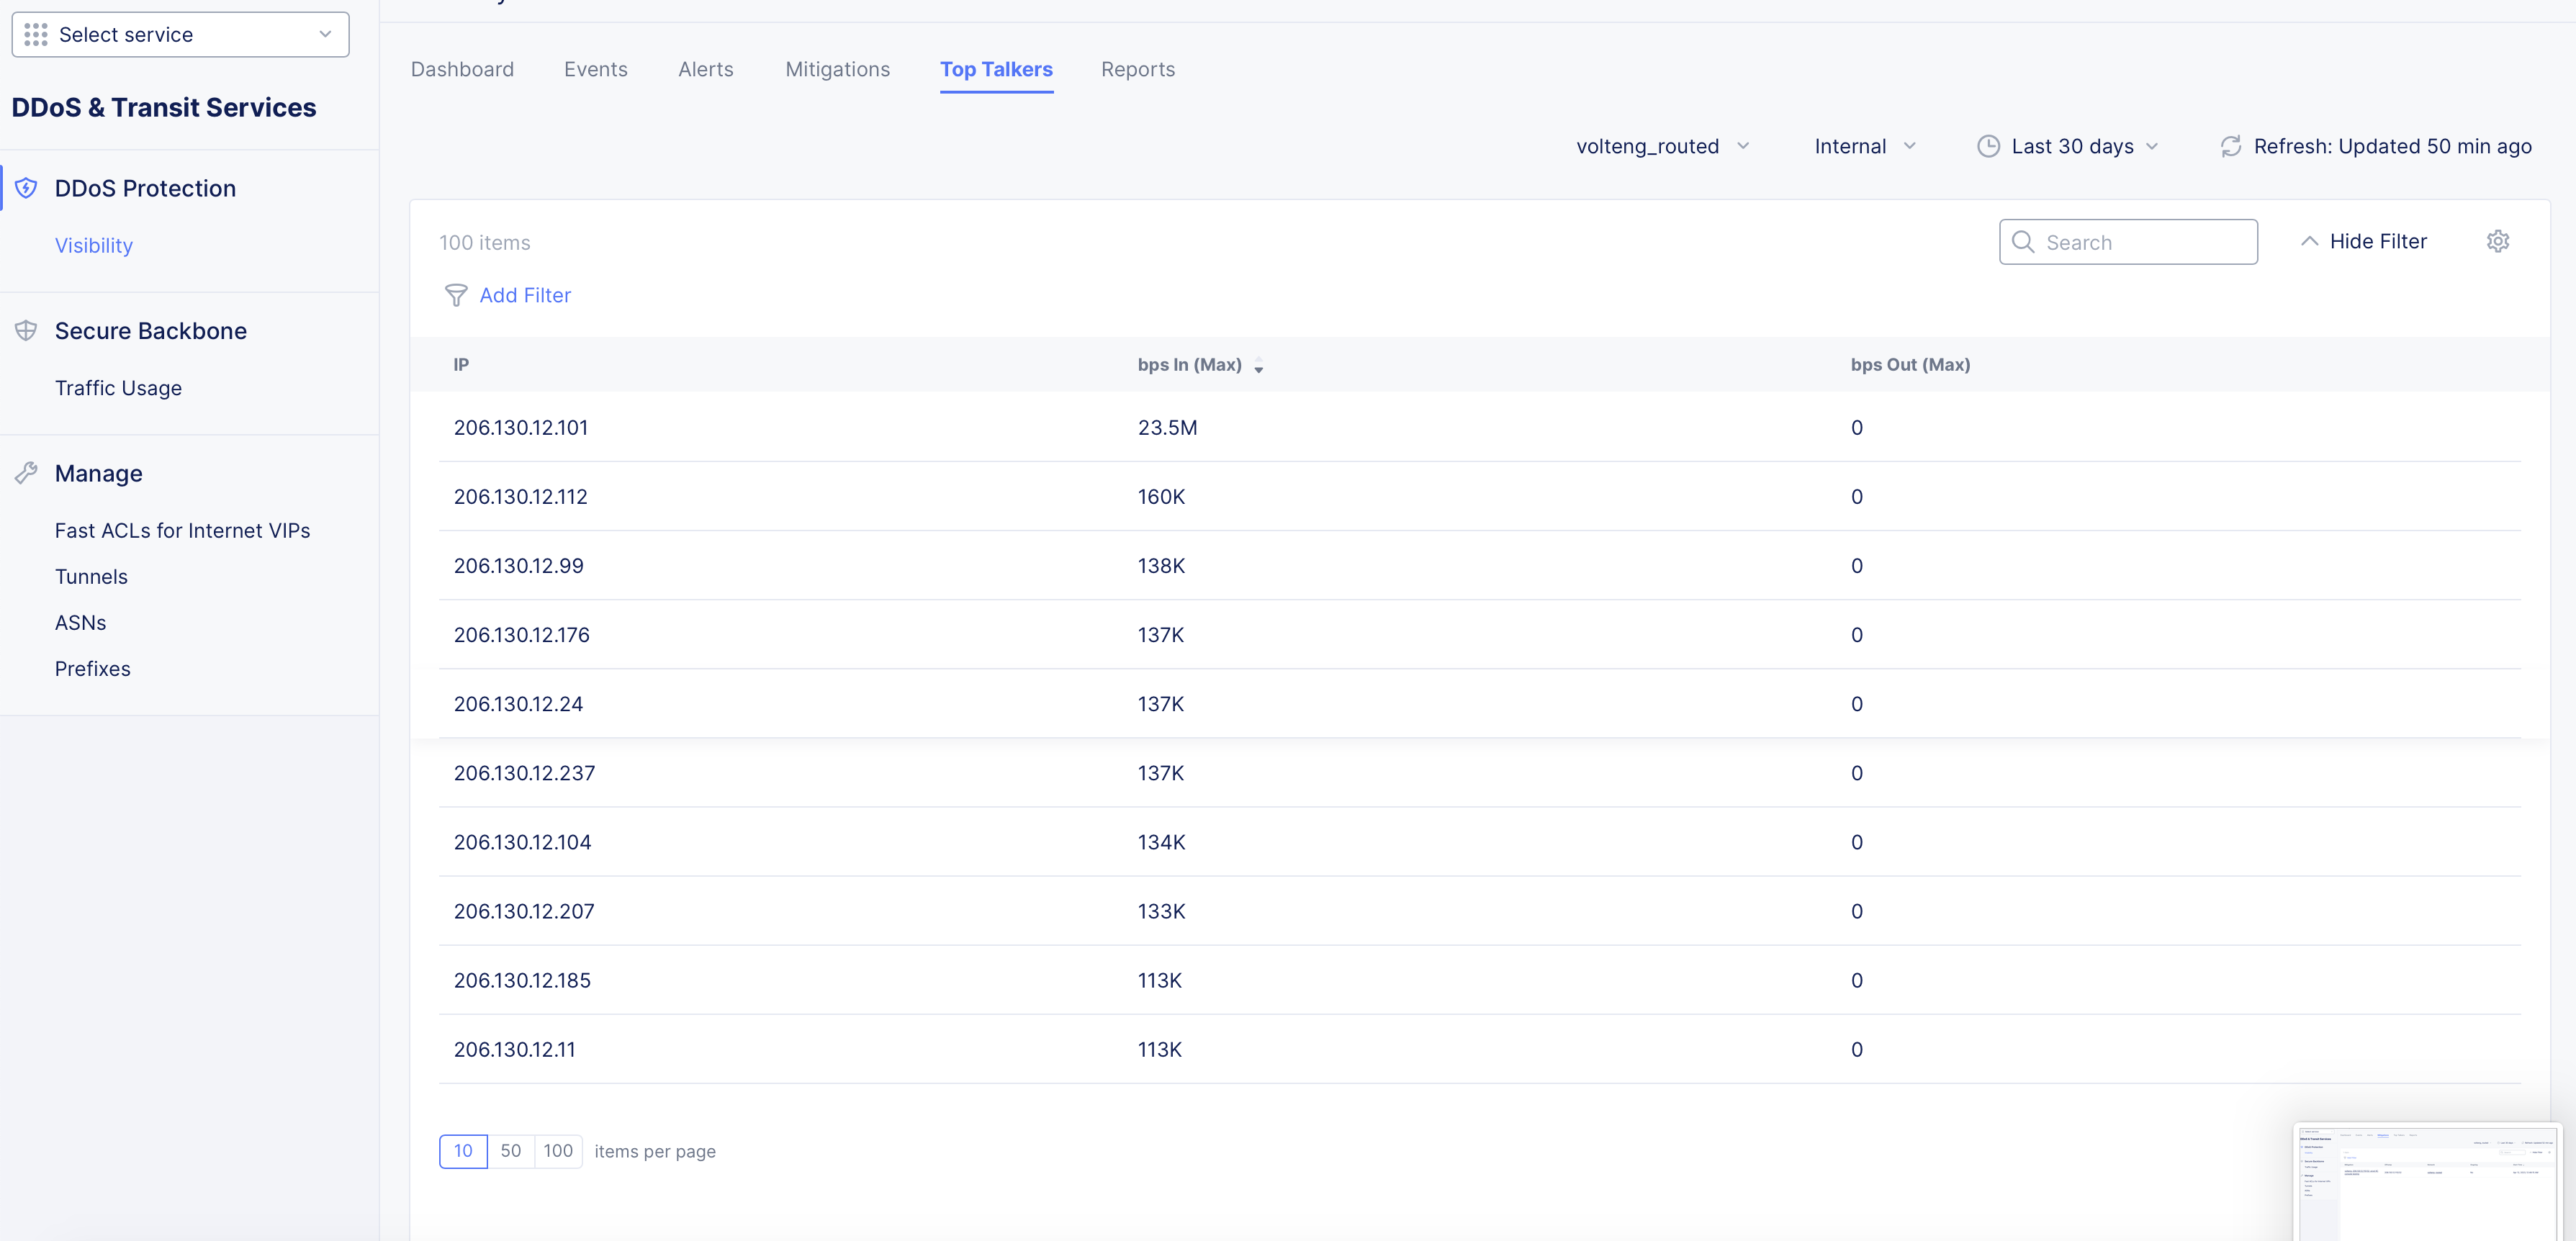
Figure: Top Talkers View
Note: Similar to dashboard filters, events view also has the network traffic filter, internal vs external traffic filter, time interval selector, and refresh options located on the top of the page. You can use these filters to adjust the view as per your need.
Reports
Note: The reports are enabled and made available only upon requesting the F5 Distributed Cloud SOC team.
Click on the Reports tab to view reports that you can analyze to gain more insights on your network protection. The reports are displayed in a table view with each row having report name, report type, date of report generation, and attachment of the report itself.
Note: The reports view has the time interval selector and refresh options located on the top of the page. You can use these filters to adjust the view as per your need.
Explore Backbone Traffic Usage
The F5 Distributed Cloud DDoS Mitigation service also provides monitoring support for your usage of F5 Distributed Cloud Secure Backbone.
Navigate to Secure Backbone > Traffic Usage and go through the following list to learn more about the traffic usage:
Interface List
-
The Traffic Usage monitoring view loads the Interface List page by default and shows traffic usage for backbone interfaces utilized for your DDoS mitigation protection. The interface list is a table showing interfaces with each row having interface name, outbound traffic, and inbound traffic columns.
-
The inbound and outbound traffic are shown as graphs. Place the mouse pointer on anywhere on the graph of an interface to view the traffic in bits per second (bps) on the date of mouse pointer placement for that interface.
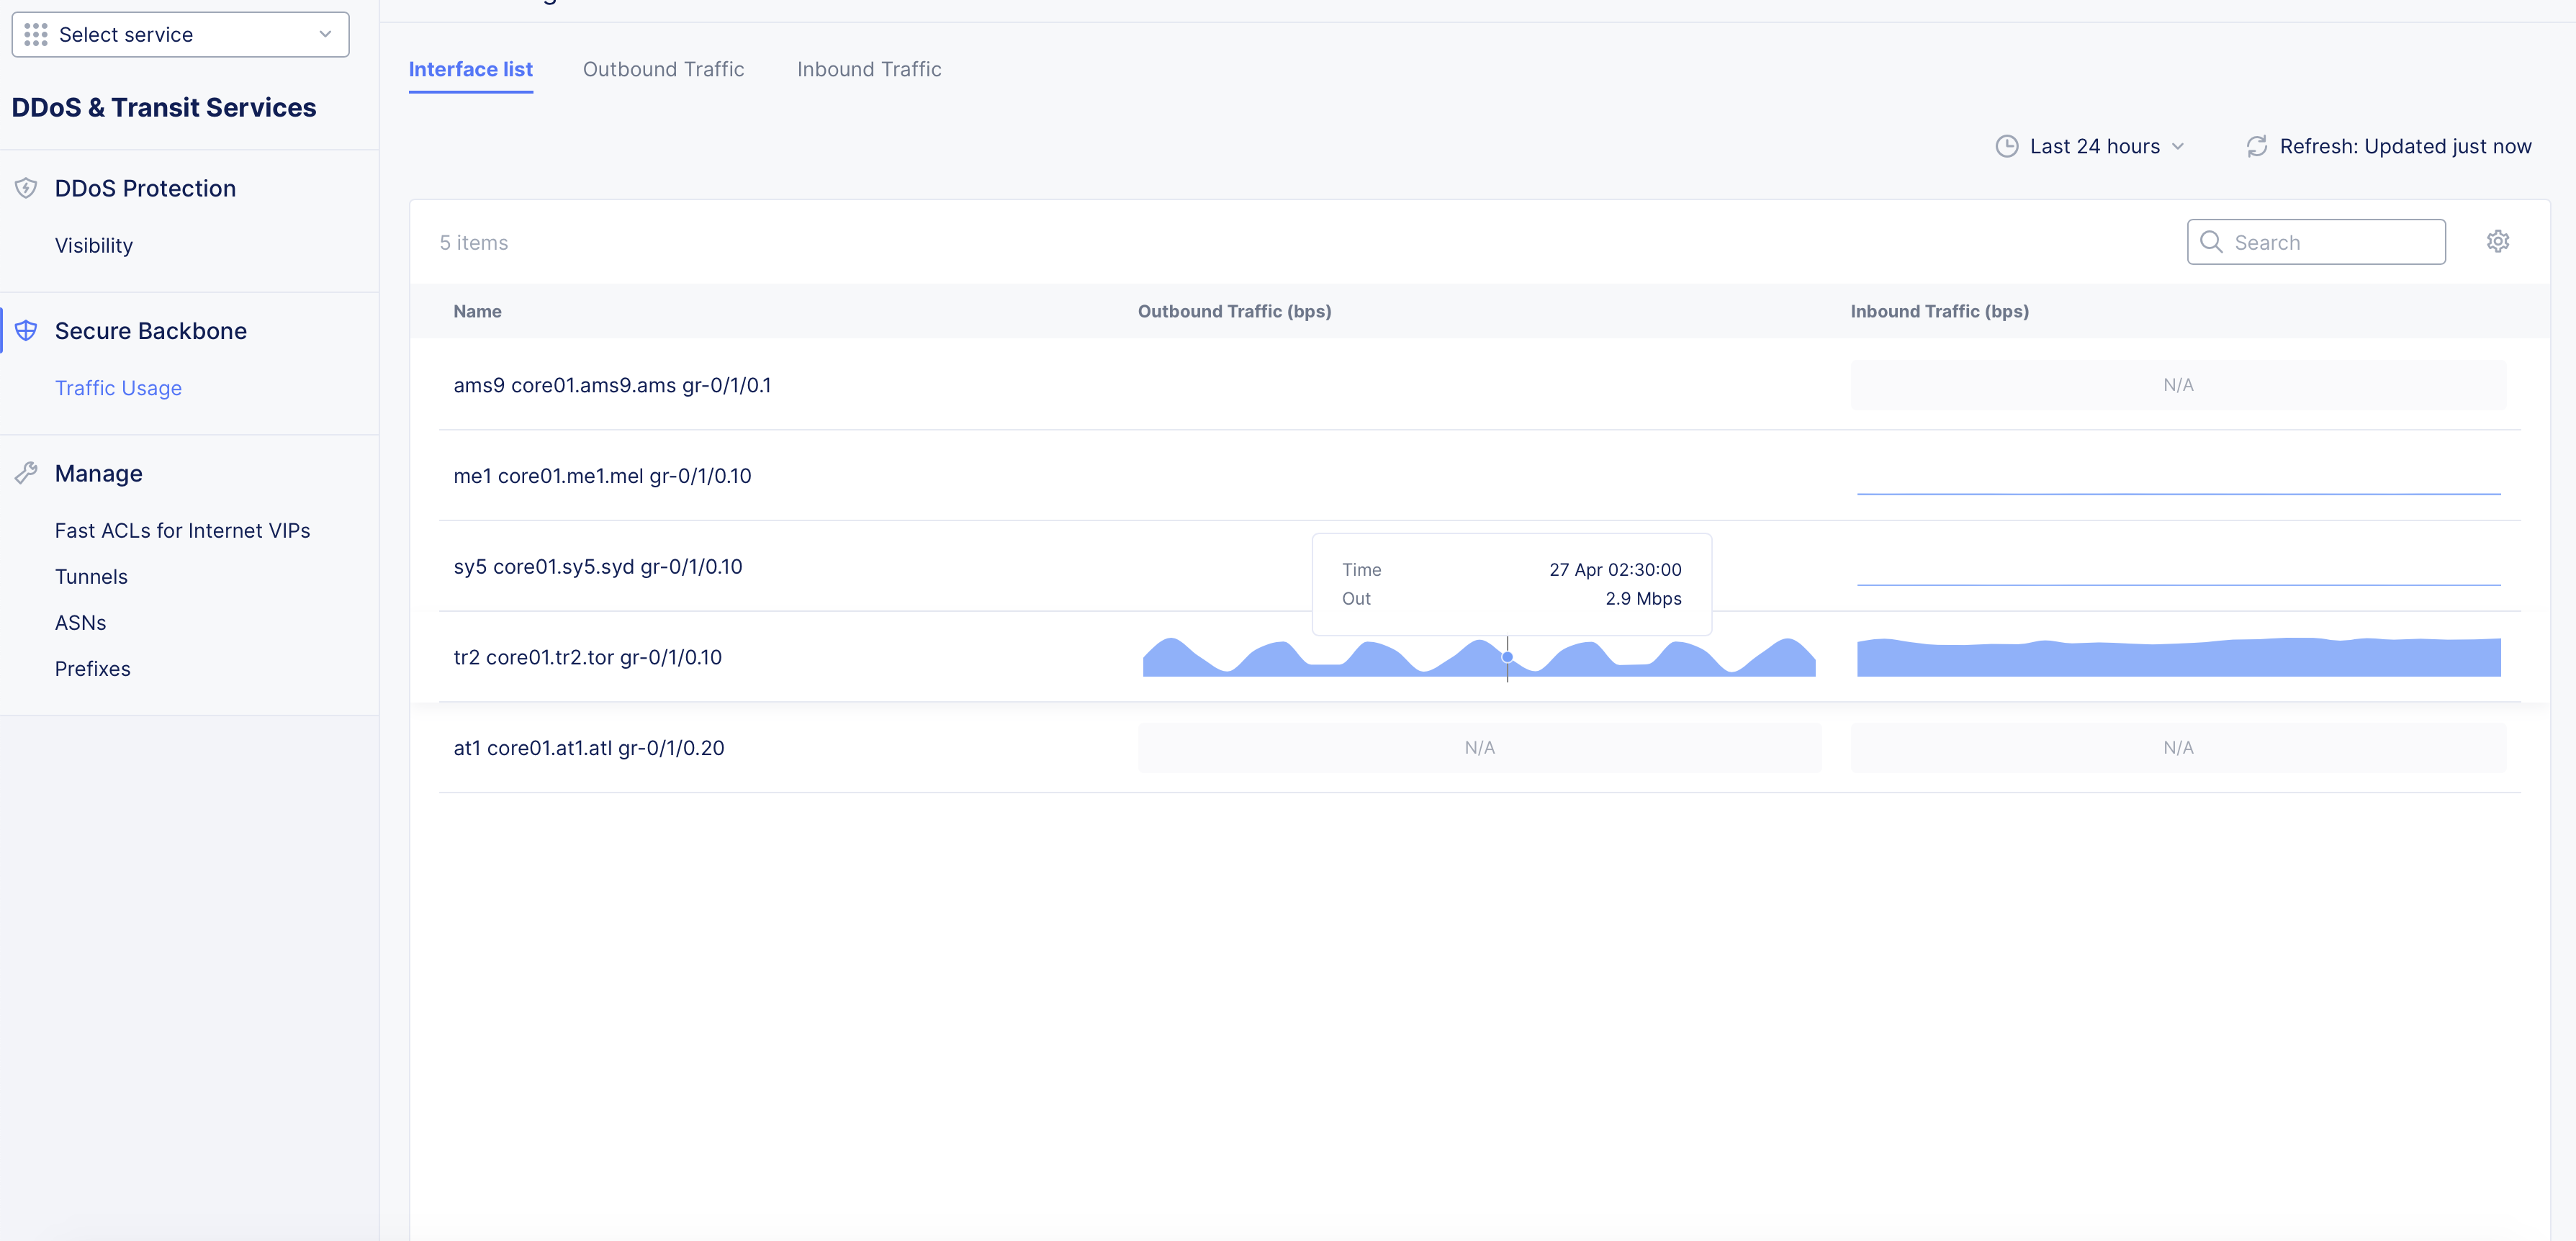
Figure: Traffic Usage by Interfaces
- Click anywhere on the inbound or outbound traffic graph of a specific interface to switch to their respective pages filtered to display data for that interface.
Outbound Traffic
-
Click on the Outbound Traffic monitoring view to view the outbound traffic graph for all the interfaces. Switch between the BPS and PPS tabs to display the graph in bits per second or packets per second measurements.
-
Switch between Area Chart or Line Chart drop-down located on the top right of the graph to change the chart accordingly.
-
Place the mouse pointer on anywhere on the graph to view the traffic in bits per second (bps) on the date of mouse pointer placement.
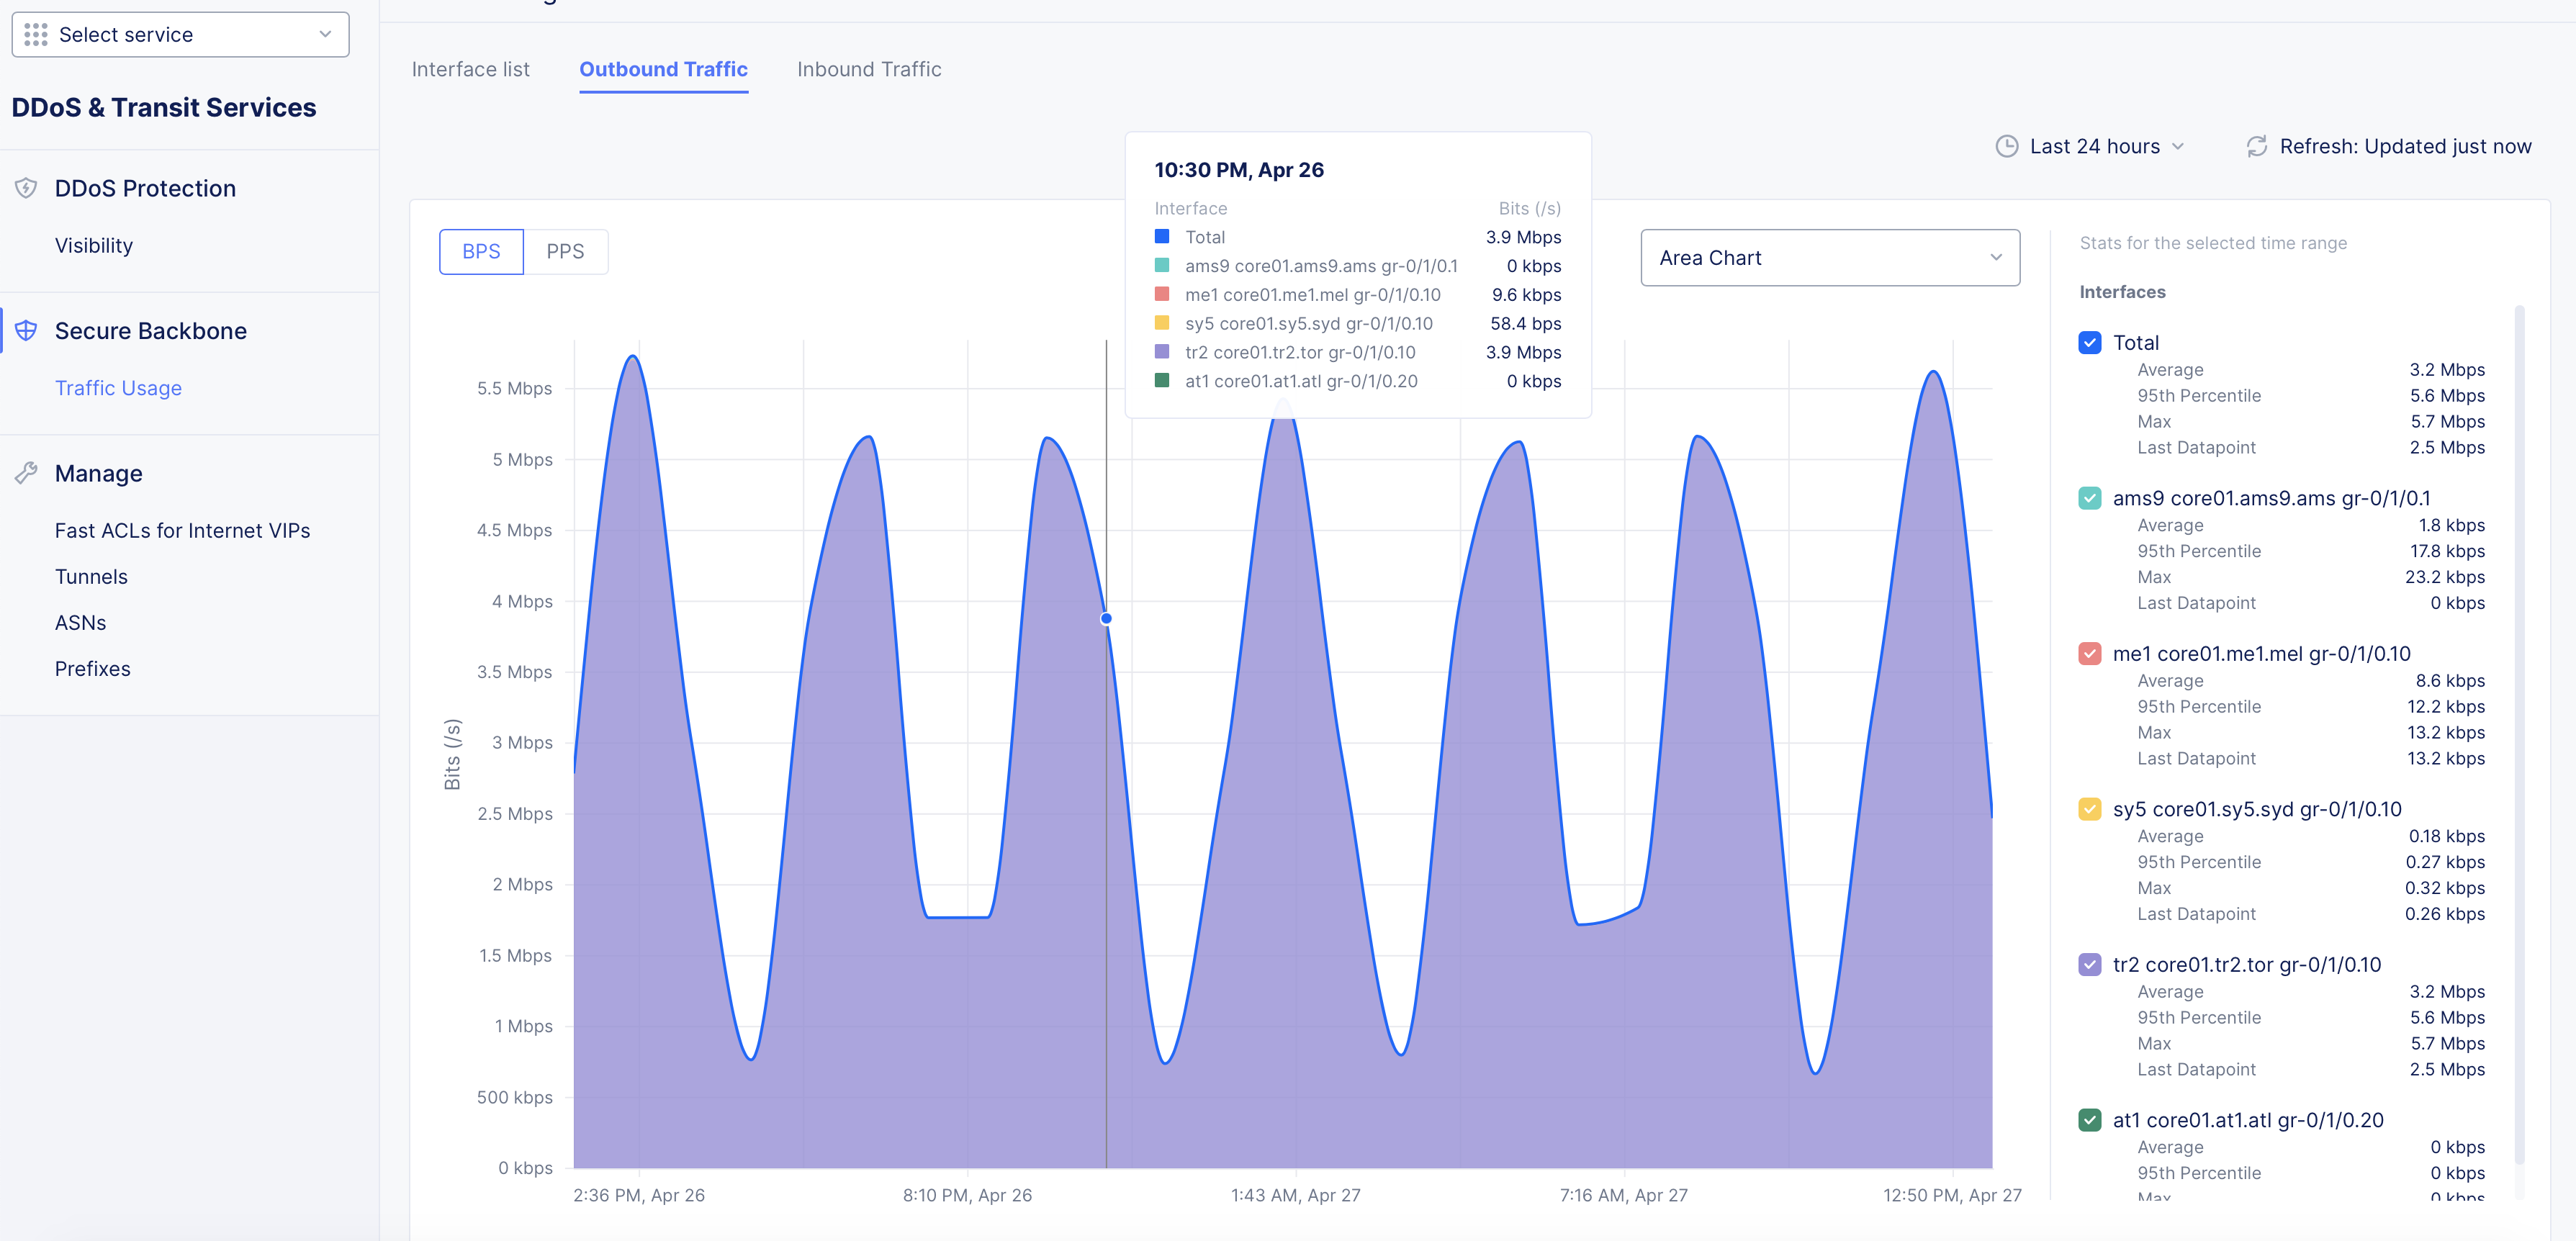
Figure: Traffic Usage by Outbound Interfaces
- Select or unselect interfaces on the right side of the graph to filter the graph to show information for specific interface(s).
Inbound Traffic
-
Click on the Inbound Traffic monitoring view to view the inbound traffic graph for all the interfaces. Switch between the BPS and PPS tabs to display the graph in bits per second or packets per second measurements.
-
Switch between Area Chart or Line Chart drop-down located on the top right of the graph to change the chart accordingly.
-
Place the mouse pointer on anywhere on the graph to view the traffic in bits per second (bps) on the date of mouse pointer placement.
-
Select or unselect interfaces on the right side of the graph to filter the graph to show information for specific interface(s).
Note: The traffic usage has the time interval selector and refresh options located on the top of the page. You can use these filters to adjust the view as per your need.
Concepts
API References
On this page:
- Objective
- Overview
- Prerequisites
- Configuration
- Enable DDoS Mitigation Management Workspace
- Manage Protected Entities
- Configure Tunnels
- Configure ASNs
- Configure Prefixes
- Configure Route Advertisement
- Configure Firewall Rules
- Configure Deny List Rules
- Configure Fast ACLs
- Monitor Activities and Obtain Reports
- Explore DDoS Protection Visibility
- Explore Backbone Traffic Usage
- Concepts
- API References