Enable API Endpoint Discovery and Schema Learning
Objective
This document provides instructions on how to enable markup and analysis of API endpoints for your application. F5® Distributed Cloud Services discover API endpoints for your application services and performs behavioral analysis on the various logs collected from the endpoints using advanced machine learning. This feature provides endpoint learning, including request and response schemas and sensitive data detection. It also provides show inventory and shadow sets and OpenAPI Specification (OAS) generation. A Probability Distribution Function (PDF) for metrics related to each endpoint is generated. The analysis is performed periodically, and the PDFs are updated accordingly. To learn more about behavioral analysis, see Behavioral Firewall.
There are three main types of APIs:
-
Inventory: These API endpoints are defined per the user's API Definition and are known as APIInventory. -
Discovered: These API endpoints are discovered by Console using AI/ML and are based on traffic to them. These may contain theInventoryAPIs and more. The discovered API limit is 5000 endpoints per application. -
Shadow: These APIs endpoints are discovered but not in inventory.
Using the instructions provided in this document, you can enable the API endpoint markup for your application, inspect the discovered API endpoints, and monitor the related PDFs in Distributed Cloud service mesh. Two methods are available to enable this feature: simple and advanced.
Sensitive Data
Sensitive Data which is part of API Discovery is a feature that helps identify and locate sensitive data within the requests and responses of API endpoints.
Sensitive Data Discovery scans requests and responses for sensitive data, such as personally identifiable information (PII), credit card numbers, and social security numbers. Once detected, the feature identifies the specific fields in which the sensitive data is located.
Sensitive Data Discovery works by analyzing the content of requests and responses as they pass through API endpoints. The feature uses a combination of regular expressions and predefined patterns to identify sensitive data as a part of periodic discovery learning process. When the feature detects sensitive data, it logs the occurrence, the endpoint where the data was found, and the specific field in which the data was located.
There is also the functionality of masking sensitive data by Data Guard which is part of the Create Web Application Firewall guide.
API Endpoint Learning
The API endpoint is a tuple of URL and method for the API. There could be absolute paths or there could be variables in the path such as namespace/$namespace where $namespace indicates the namespace name. These types of URLs are called collapsible URLs, and Distributed Cloud learns such kind of URLs and presents them in the collapsed format.
Enabling the API endpoint markup and analysis results in the following benefits:
- Dynamic discovery of all the API endpoints of your application.
- Determining which APIs are supposed to be between a set of services and enhancing security to allow only those APIs.
- Obtaining insights such as which API is most hit and the associated request size.
The PDFs are obtained for the following metrics:
- Request size and response size
- Latency with data and without data
- Request rate
- Error rate
- Response throughput
Discovered APIs are learned periodically, and they only include paths with 2xx/3xx response codes. Paths to static files (like images, PDF, and more) are excluded from discovered APIs. Within the load balancer configuration form, you can purge up to seven days worth of inactive Discovered APIs (using the Purge Duration for Inactive Discovered APIs option).
API Schema Learning
Distributed Cloud also learns the schema structure of APIs by analyzing sampled request and response data examples for each API. Reverse-engineering the schema is supported for JSON and x-url-form-encoded formats.
The following are learned for each field:
- Regex that represents this field with high probability.
- Masked personally identifiable information (PII) data for the field, if applicable. Only email addresses that contain Latin letters are detected and masked.
If a GraphQL API endpoint is discovered, the learned schema is presented in native GraphQL format.
The system also provides option to download the Swagger specification for the learned API schemas at the following levels:
- HTTP Load Balancer
- App Type (in the service mesh page)
- Per API
The downloaded Swagger file is a JSON file. Within the Swagger file, the data is structured to show the correlation between discovered endpoints and domains.
API Attributes Discovery
The API Attributes column on the main monitoring page provides improved visibility and monitoring of API endpoints, including the detection of API types. The types include GraphQL, gRPC, SOAP, XML-RPC, as well as Login endpoints. This feature helps users proactively identify potential weaknesses in their API endpoints, allowing them to take appropriate actions to mitigate the risks.
API endpoints that have been inactive for at least 45 days are listed as Unused. These unused APIs endpoints (which are also known as zombie APIs) are counted from the Inventory APIs with a valid response code of 2xx or 3xx.
API endpoints with discovered dynamic objects, such as /api/v1/report/{dyn}, may be assigned the Private Resource API attribute if each user accesses unique data through these objects. This label helps identify endpoints handling user-specific data, such as personal records or documents, which could be vulnerable to BOLA attacks if improperly secured.
API Authentication Discovery
The API Authentication Discovery feature identifies and baselines the authentication state of the APIs within your environment. A lack of authentication of API calls is considered a risk for APIs. It is extremely important to have visibility into state and type within these APIs.
Distributed Cloud Console has built-in sensors to detect authentication types and their location in an API call. Once these are detected, they are associated with an endpoint and displayed in endpoint details under the Authenticated State column. This information is presented in a table. You can sort through this table to filter and sort by authentication state or type.
Discovered authentication types can be based on HTTP authentication (for example, Basic or Bearer authentications) or API-Keys (such as tokens in headers, cookies, or query parameters).
HTTP authentication types are identified from Authorization or Proxy-Authorization headers and their declared authentication scheme. The following list holds the types of authentication types that can be discovered when a specific known authentication scheme is detected:
- Basic
- Bearer
- Digest
- Negotiate
- OAuth 1.0
The detected authentication type, when other authentication schemes are detected, will be HTTP.
JSON Web Token Discovery
A JSON Web Token (JWT) is used to carry information related to the identity and characteristics (in other words, claims) of a client. This information is signed by the server. Distributed Cloud Console discovers the header, payload, and signature in JWTs and identifies useful fields for downstream analyses and visibility. The benefits of this include detecting sensitive data in JWT payloads and defining API endpoint risk score and vulnerabilities.
Endpoint Vulnerabilities and Remediation
In addition, Distributed Cloud Console provides a dynamic way to track and manage API endpoint vulnerabilities. This feature enables you to categorize vulnerabilities into four distinct statuses: open, under review, resolved, and ignored. This categorization aids in identifying new issues, monitoring ongoing reviews, and recognizing resolved items. After a vulnerability is addressed or set to ignored, it is automatically moved to the Archived tab.
Prerequisites
-
F5 Distributed Cloud Services Account. If you do not have an account, see Getting Started with Console.
-
One or more applications deployed on a Distributed Cloud Services CE Site with services configured. See App Management for more information. See the CE Site deployment guides.
Simple Method
This method enables API discovery and learning on a specific load balancer only. No learning is shared among any load balancers.
Step 1: Find an HTTP Load Balancer.
-
In Console homepage, select the
Multi-Cloud App Connectservice. -
Select the namespace.
-
Select
Overview>Applications. -
Scroll down to
Load Balancerslist. -
Select load balancer
Name.
Note: How to find an HTTP Load Balancer in
Web App & API Protectioninstructions below.
-
In Console homepage, select
Web App & API Protection. -
Select
Overview>Security. -
Scroll down to
Load Balancerslist. -
Select load balancer
Name.
Step 2: Enable API Discovery in Load Balancer.
-
In
Load Balancersmain list select.... -
Select
Manage Configuration>Edit Configuration. -
Select
API Protectionfrom left panel. -
In
API Discoverydrop-down menu, selectEnable. -
From the
Learn From Traffic With Redirect Responsedrop-down menu, select an option for traffic redirect response learning. -
In the
Purge Duration for Inactive Discovered APIs from Trafficfield, enter a number to represent the number of days worth of inactive Discovered APIs to purge.
Note: The Purge Duration for Inactive Discovered APIs field allows you to enter the number of days worth of inactive Discovered APIs to purge. However, it is important to note that this duration is not based on an exact 24-hour cycle. Inactive APIs are removed from visibility only after the next discovery cycle is completed. The purge process depends on the periodic discovery cycles conducted by the system, which typically take approximately 2 to 4 hours to complete. As a result, there might be a delay between selecting a purge duration and the removal of inactive endpoints.
Step 3: Optionally, configure API Discovery policy.
After enabling API Discovery on a delivery resource (for example, an HTTP load balancer), you can optionally configure an API Discovery policy to customize how endpoints are discovered and classified. API Discovery policies provide a flexible way to adjust discovery behavior when default detection does not fully reflect the structure or intent of your APIs. This is common in environments with legacy endpoints, non-standard content types, or custom authentication schemes. If no policy is associated, API Discovery operates using the system’s default discovery behavior. See the information below for more information.
Policy Overview
An API Discovery policy defines how API Discovery evaluates traffic for one or more delivery resources. A policy can be attached to a single delivery resource, or shared across multiple delivery resources that require the same discovery behavior. This allows consistent discovery behavior across environments while avoiding duplicate configuration.
Using an API Discovery policy, you can:
- Explicitly include endpoints that should be treated as APIs
- Explicitly exclude endpoints that should be ignored or archived as non-API
- Define a default behavior for traffic that does not match any rule
- Describe custom authentication parameters used by your APIs
An API Discovery policy consists of four sections:
- Metadata
- Discovery rules
- Default behavior of the rule set
- Custom authentication types
Metadata
This section contains descriptive information about the policy:
- Name: Required. Used to identify and reuse the policy.
- Labels. Optional. Used for organization and filtering.
- Description: Optional. For additional context.
Metadata does not affect discovery behavior.
Discovery Rules
Discovery rules define explicit inclusion or exclusion conditions. Rules are evaluated sequentially, from top to bottom. The first matching rule determines the outcome. Each rule includes:
-
Rule type:
- Inclusion: Explicitly include matching endpoints in API Discovery.
- Exclusion: Exclude matching endpoints from API Discovery.
-
Criteria, such as:
- HTTP header
- Path pattern
-
Match type, depending on the selected criteria:
- Exact match
- Substring search
- Regex value (platform validated). For HTTP Header–based rules, you can also specify whether the rule applies to request traffic or response traffic.
Default Behavior Of the Rule Set
The default behavior defines how API Discovery handles traffic that does not match any rule. Available options:
- Inclusive (Default): Traffic that does not match any rule is evaluated using the system’s default discovery behavior.
- Exclusive: Traffic that does not match any rule is ignored by API Discovery. This allows you to choose between refining discovery using explicit rules (Inclusive), or strictly controlling discovery using a whitelist approach (Exclusive).
Custom Authentication Types
This section allows you to define custom authentication parameters used by your APIs. You can specify:
- Parameter type: For example, header or query parameter.
- Parameter name: These settings help API Discovery better understand authentication patterns and improve endpoint classification accuracy.
Policy Behavior and Priority
See the following important notes:
- API Discovery policies express explicit customer intent.
- Rule evaluation follows a top-down, first-match-wins model.
- Default discovery behavior is applied only if no rule matches.
- Policies can be reused and shared across multiple delivery resources.
- Policy changes take effect in subsequent discovery cycles.
Use an API Discovery policy when:
- Your APIs use non-standard or ambiguous content types (for example, XML or HTML).
- You want to exclude legacy, internal, or auxiliary endpoints.
- You need consistent discovery behavior across multiple delivery resources.
- Default discovery behavior does not fully match your environment.
Example 1: Version-based filtering (Path Pattern)
Scenario: Discover only v2 APIs while excluding legacy v1 endpoints.
Discovery rule:
- Exclusion: Path pattern /api/v1/*
Default behavior:
- Inclusive
Result:
- Endpoints under
/api/v1/*are archived as non-API. All other endpoints (including/api/v2/*) follow the default discovery behavior.
Example 2: Content-Type based filtering (HTTP Header)
Scenario: Discover only JSON-based APIs and exclude XML-based endpoints.
Discovery rule:
- Exclusion
Header: Content-Type Match type: Substring Value: application/xml
Default behavior:
- Inclusive
Result:
- Requests with
Content-Type: application/xmlare excluded from discovery. All other traffic (for example,application/json) is discovered normally.
Advanced Method
This method enables API discovery and learning to be shared among multiple load balancers. You must create an app type object first, and then assign it to each to load balancer.
Create App Type Label
To enable API endpoint markup for your application services, it is required to first enable the associated machine learning model for those services using the app type object.
The app type object is created in the shared namespace. The load balancers of that app type in different namespaces need to be assigned with the label of the app type object.
Perform the following to create app type and enable generating the anomaly model.
Step 1: Navigate to App Types configuration page.
-
Select the
Shared Configurationservice. -
Navigate to
Security>AI & ML>App Types.
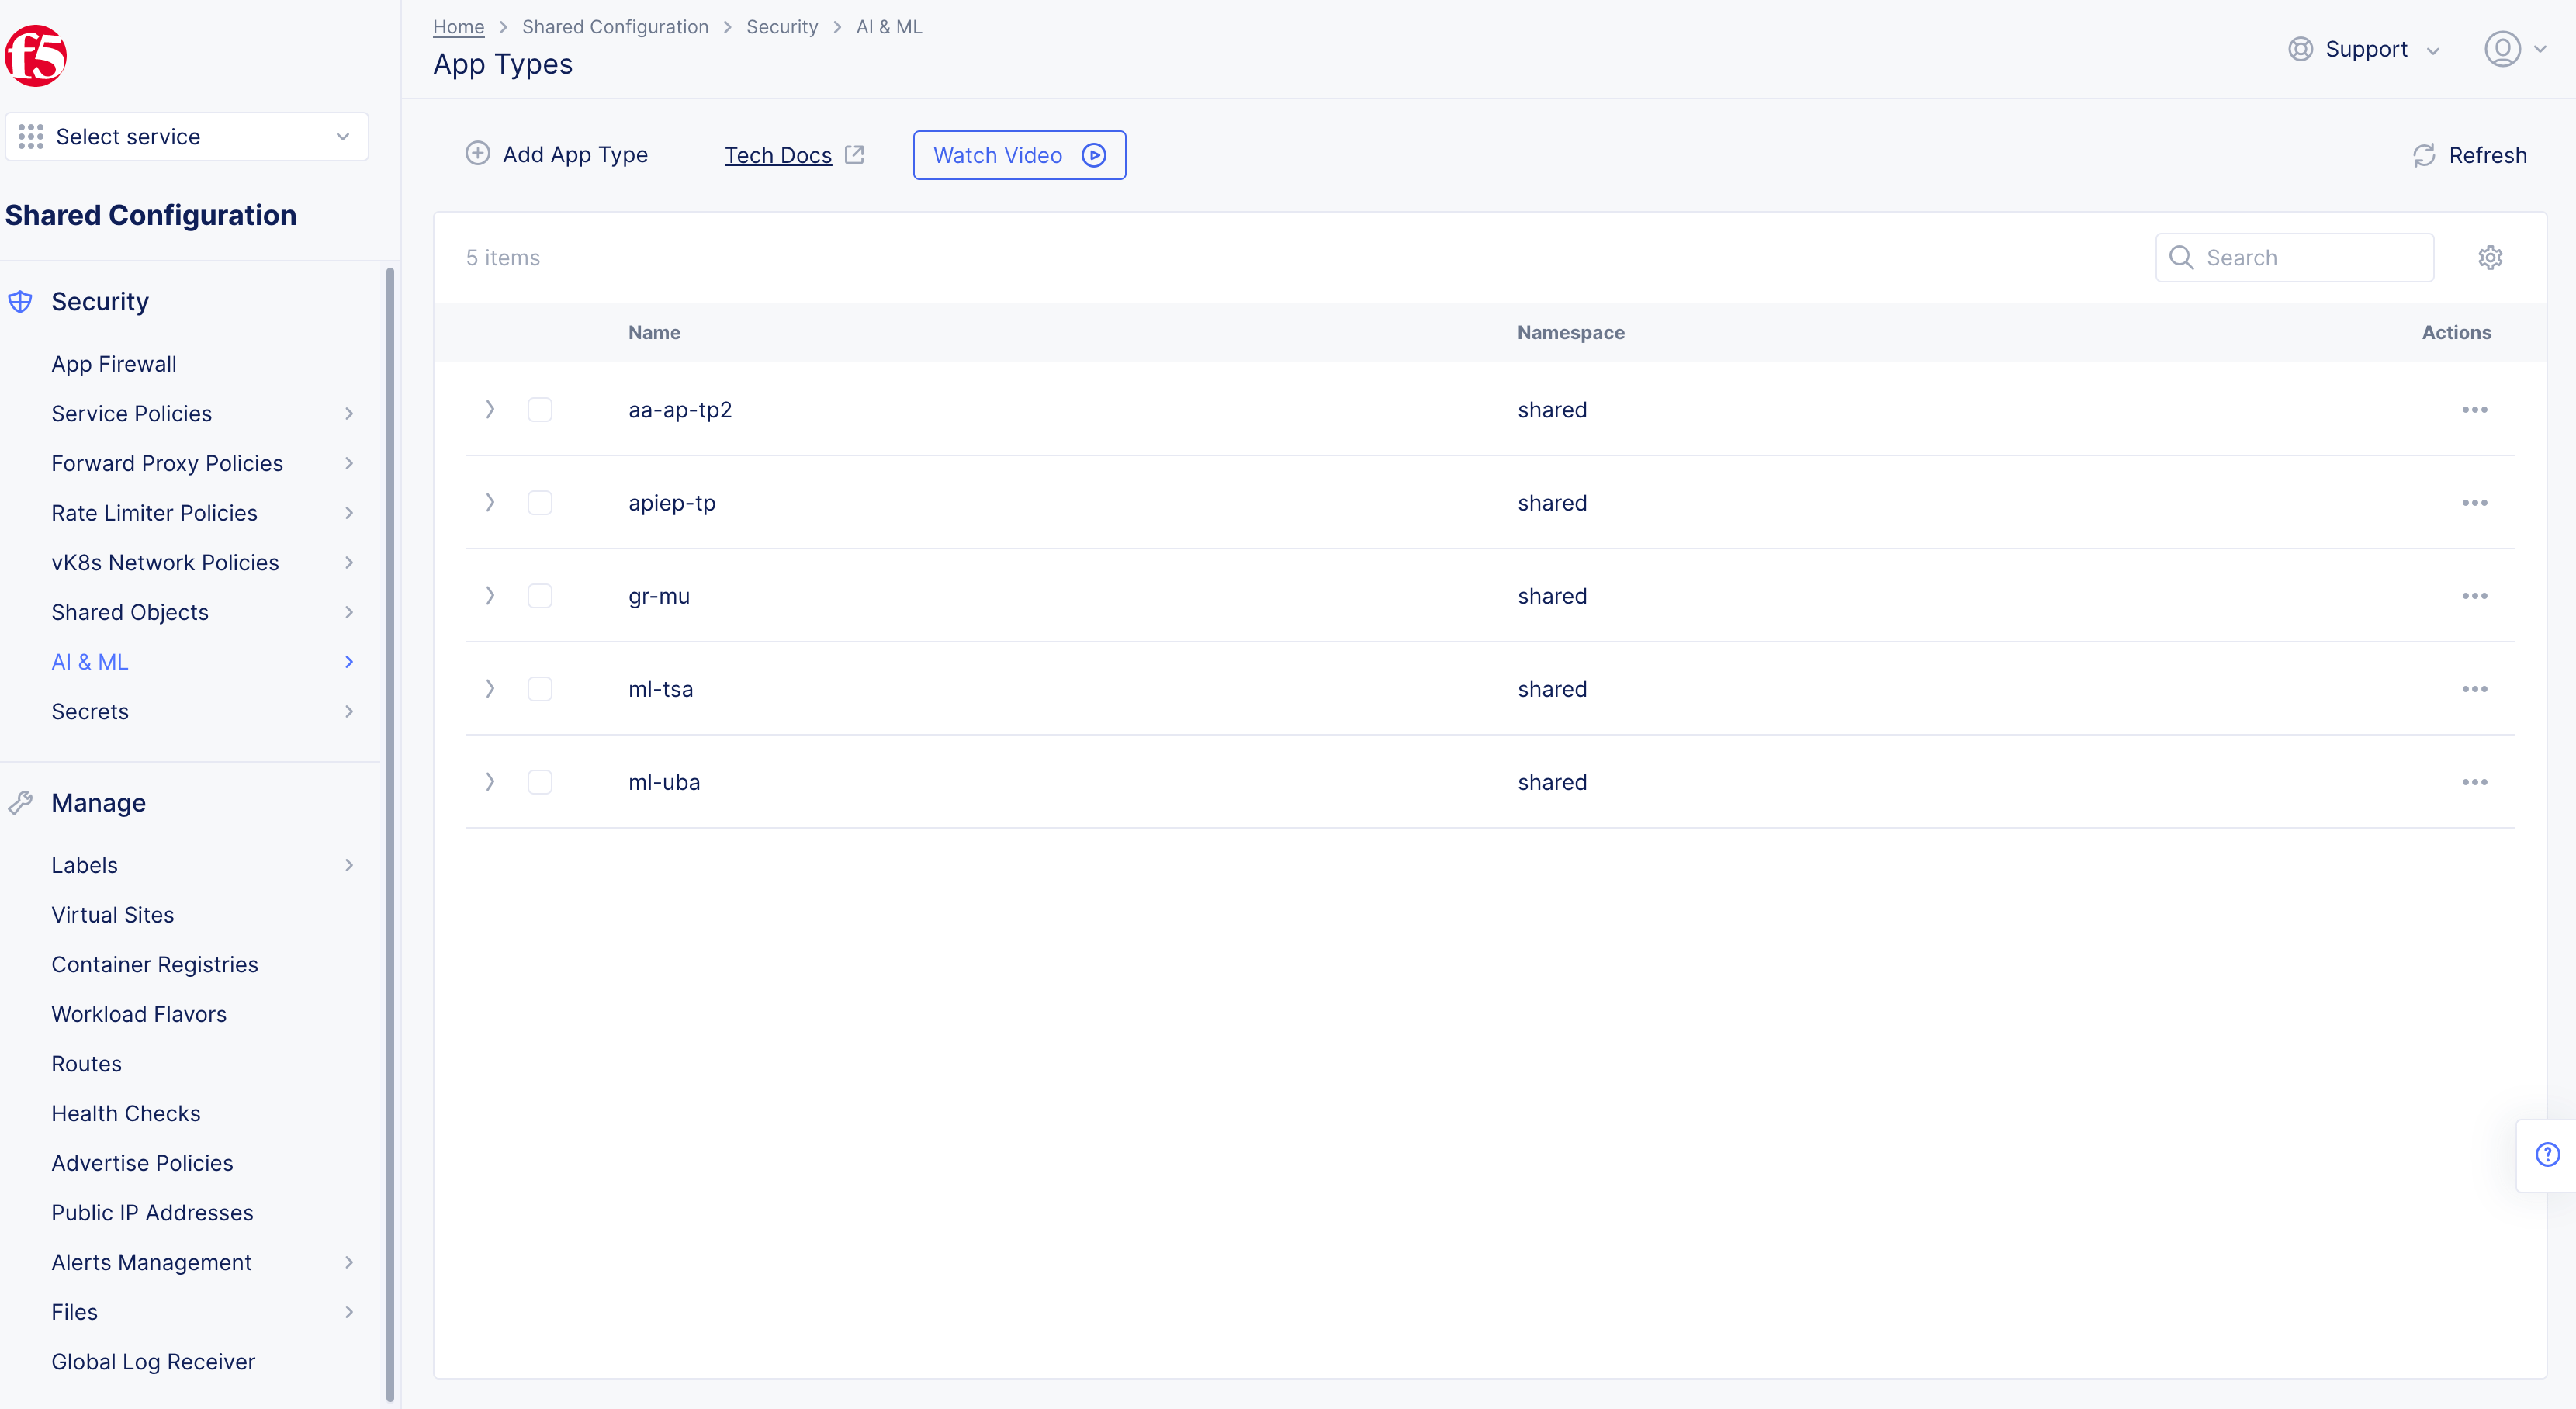
Figure: Navigate to App Type Configuration
Step 2: Configure app type object settings.
- Select
Add App Typeand then complete the configuration in the app type object creation form using the following guidelines:
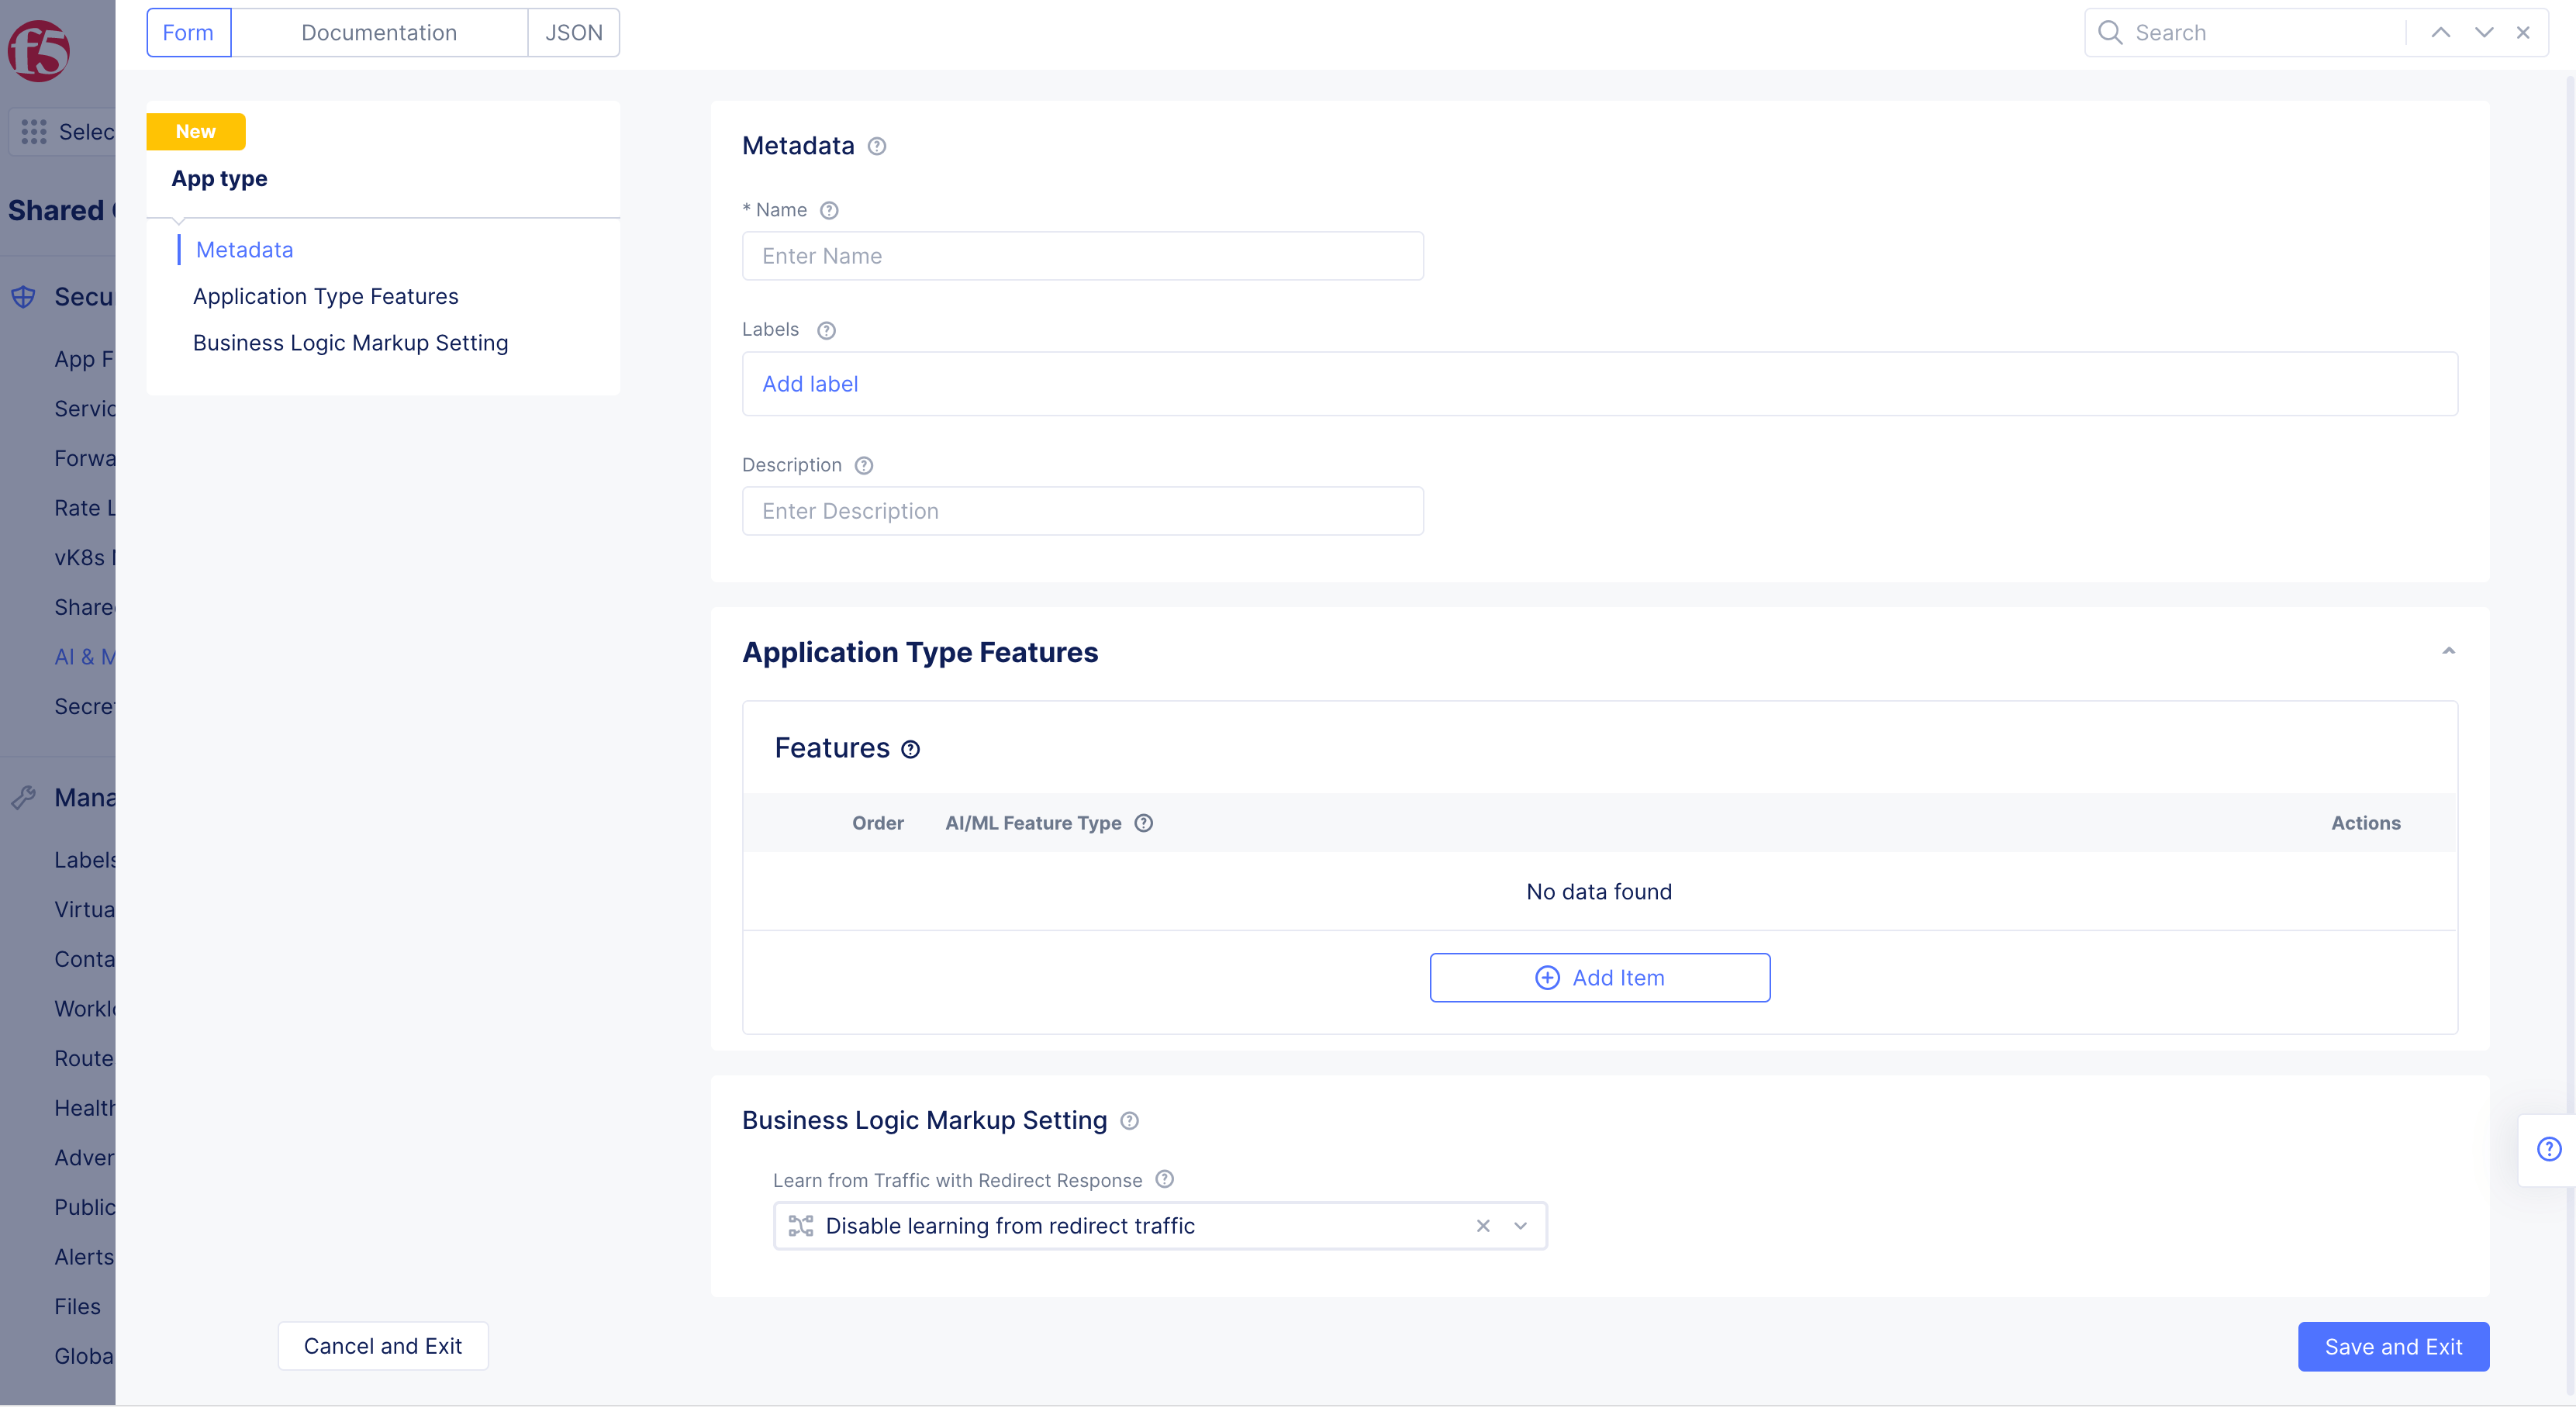
Figure: App Type Feature Configuration
-
Enter a name for the app type. This is the value for the app type label to be assigned to the load balancers for which the API discovery needs to be enabled.
-
Select
Add iteminApplication Type Featuressection. -
Select
API DiscoveryinAI/ML Feature Typedrop-down menu.
Note: Paths matching the following patterns are excluded from Discovery API: ".css", ".js", ".jpg", ".jpeg", ".gif", ".png", ".webp", ".svg", ".ico", ".woff*", ".pdf", "socket.io", ".exe", and ".ini".
-
Select
Add itemagain, and selectPer API Request Analysisfor theAI/ML Feature Typefield. -
Optionally, select
Enable learning from redirect trafficin theBusiness Logic Markup Settingsection. This enables the AI engine to learn the endpoints from redirected traffic. -
Select
Save and Exitto complete creating the app type object.
Assign App Type Label to Load Balancers
After creating the app type, you need to assign the app type label to the load balancers for which you want to enable API endpoint markup.
Note: Enabling API endpoint markup for all load balancers in a namespace requires you to apply the app type label to all load balancers in that namespace.
Perform the following to assign the app type label to your load balancers.
Step 1: Navigate to load balancer management.
-
Select the
Multi-Cloud App Connectservice. -
Select the desired namespace from the
Namespacedrop-down menu. -
Navigate to
Manage>Load Balancers>HTTP Load Balancers. -
Select
...>Manage Configurationfor the load balancer for which the app type label needs to be assigned.
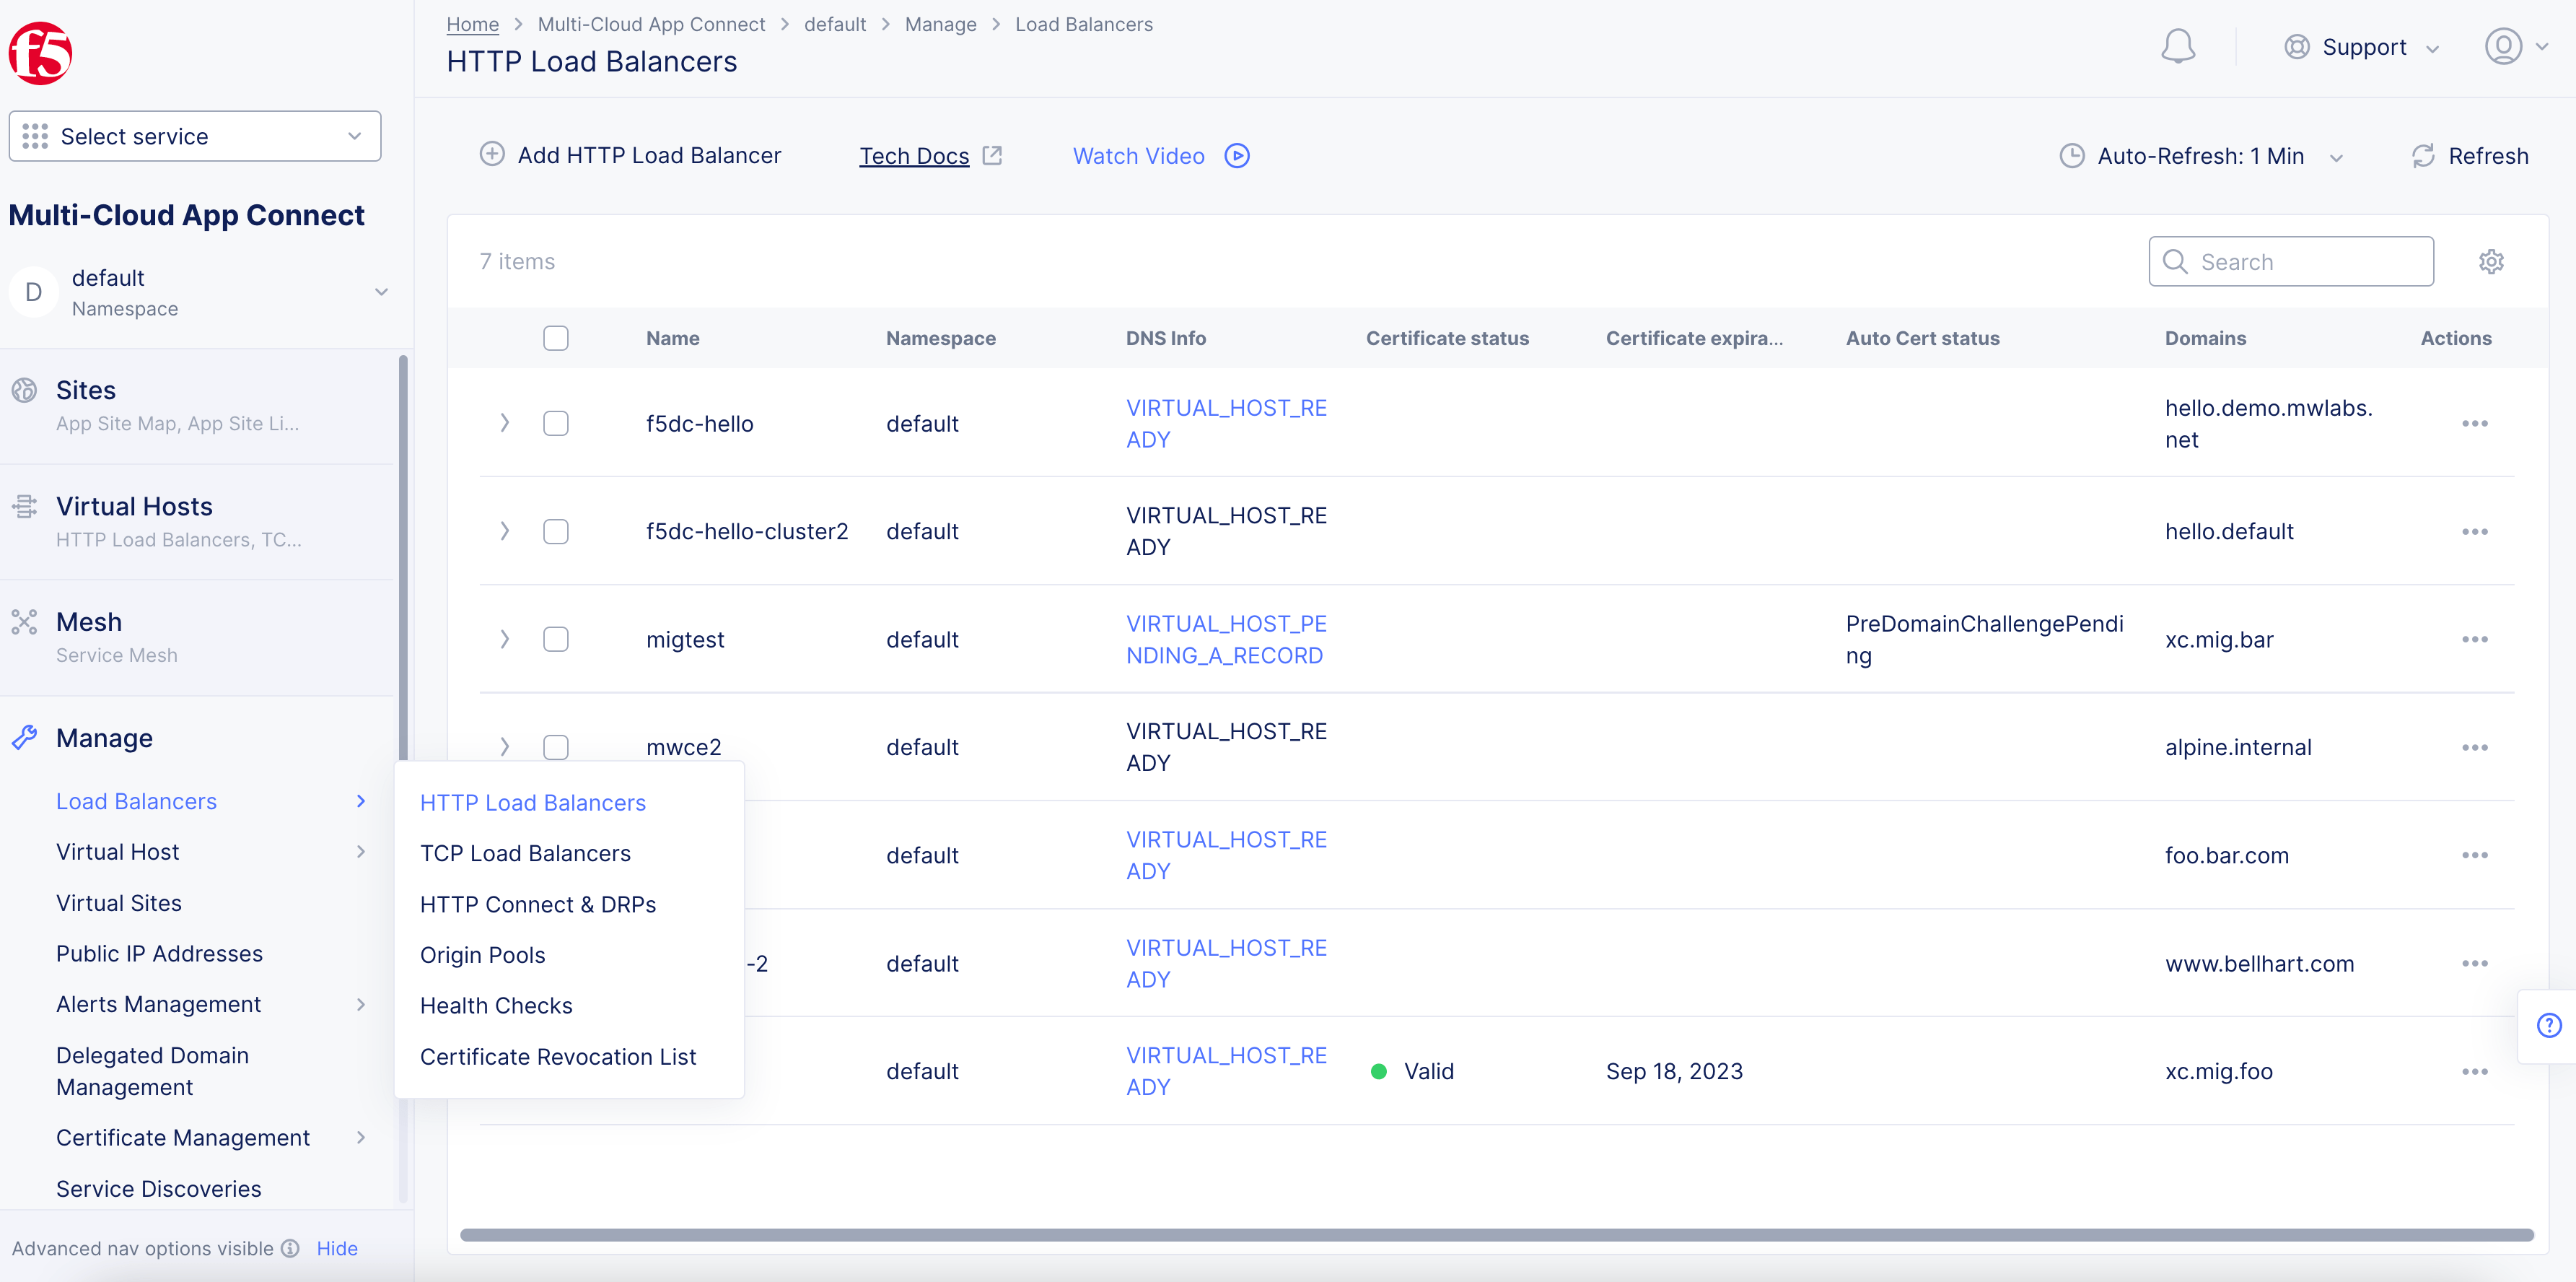
Figure: Navigate to Load Balancer
- Select
Edit Configuration.
Step 2: Assign the app type label.
-
Select
ves.io/app_typefor theLabelsfield and type. -
Type the name of the app type object created in the previous step, and select
Assign Custom Valueto add the app type label.
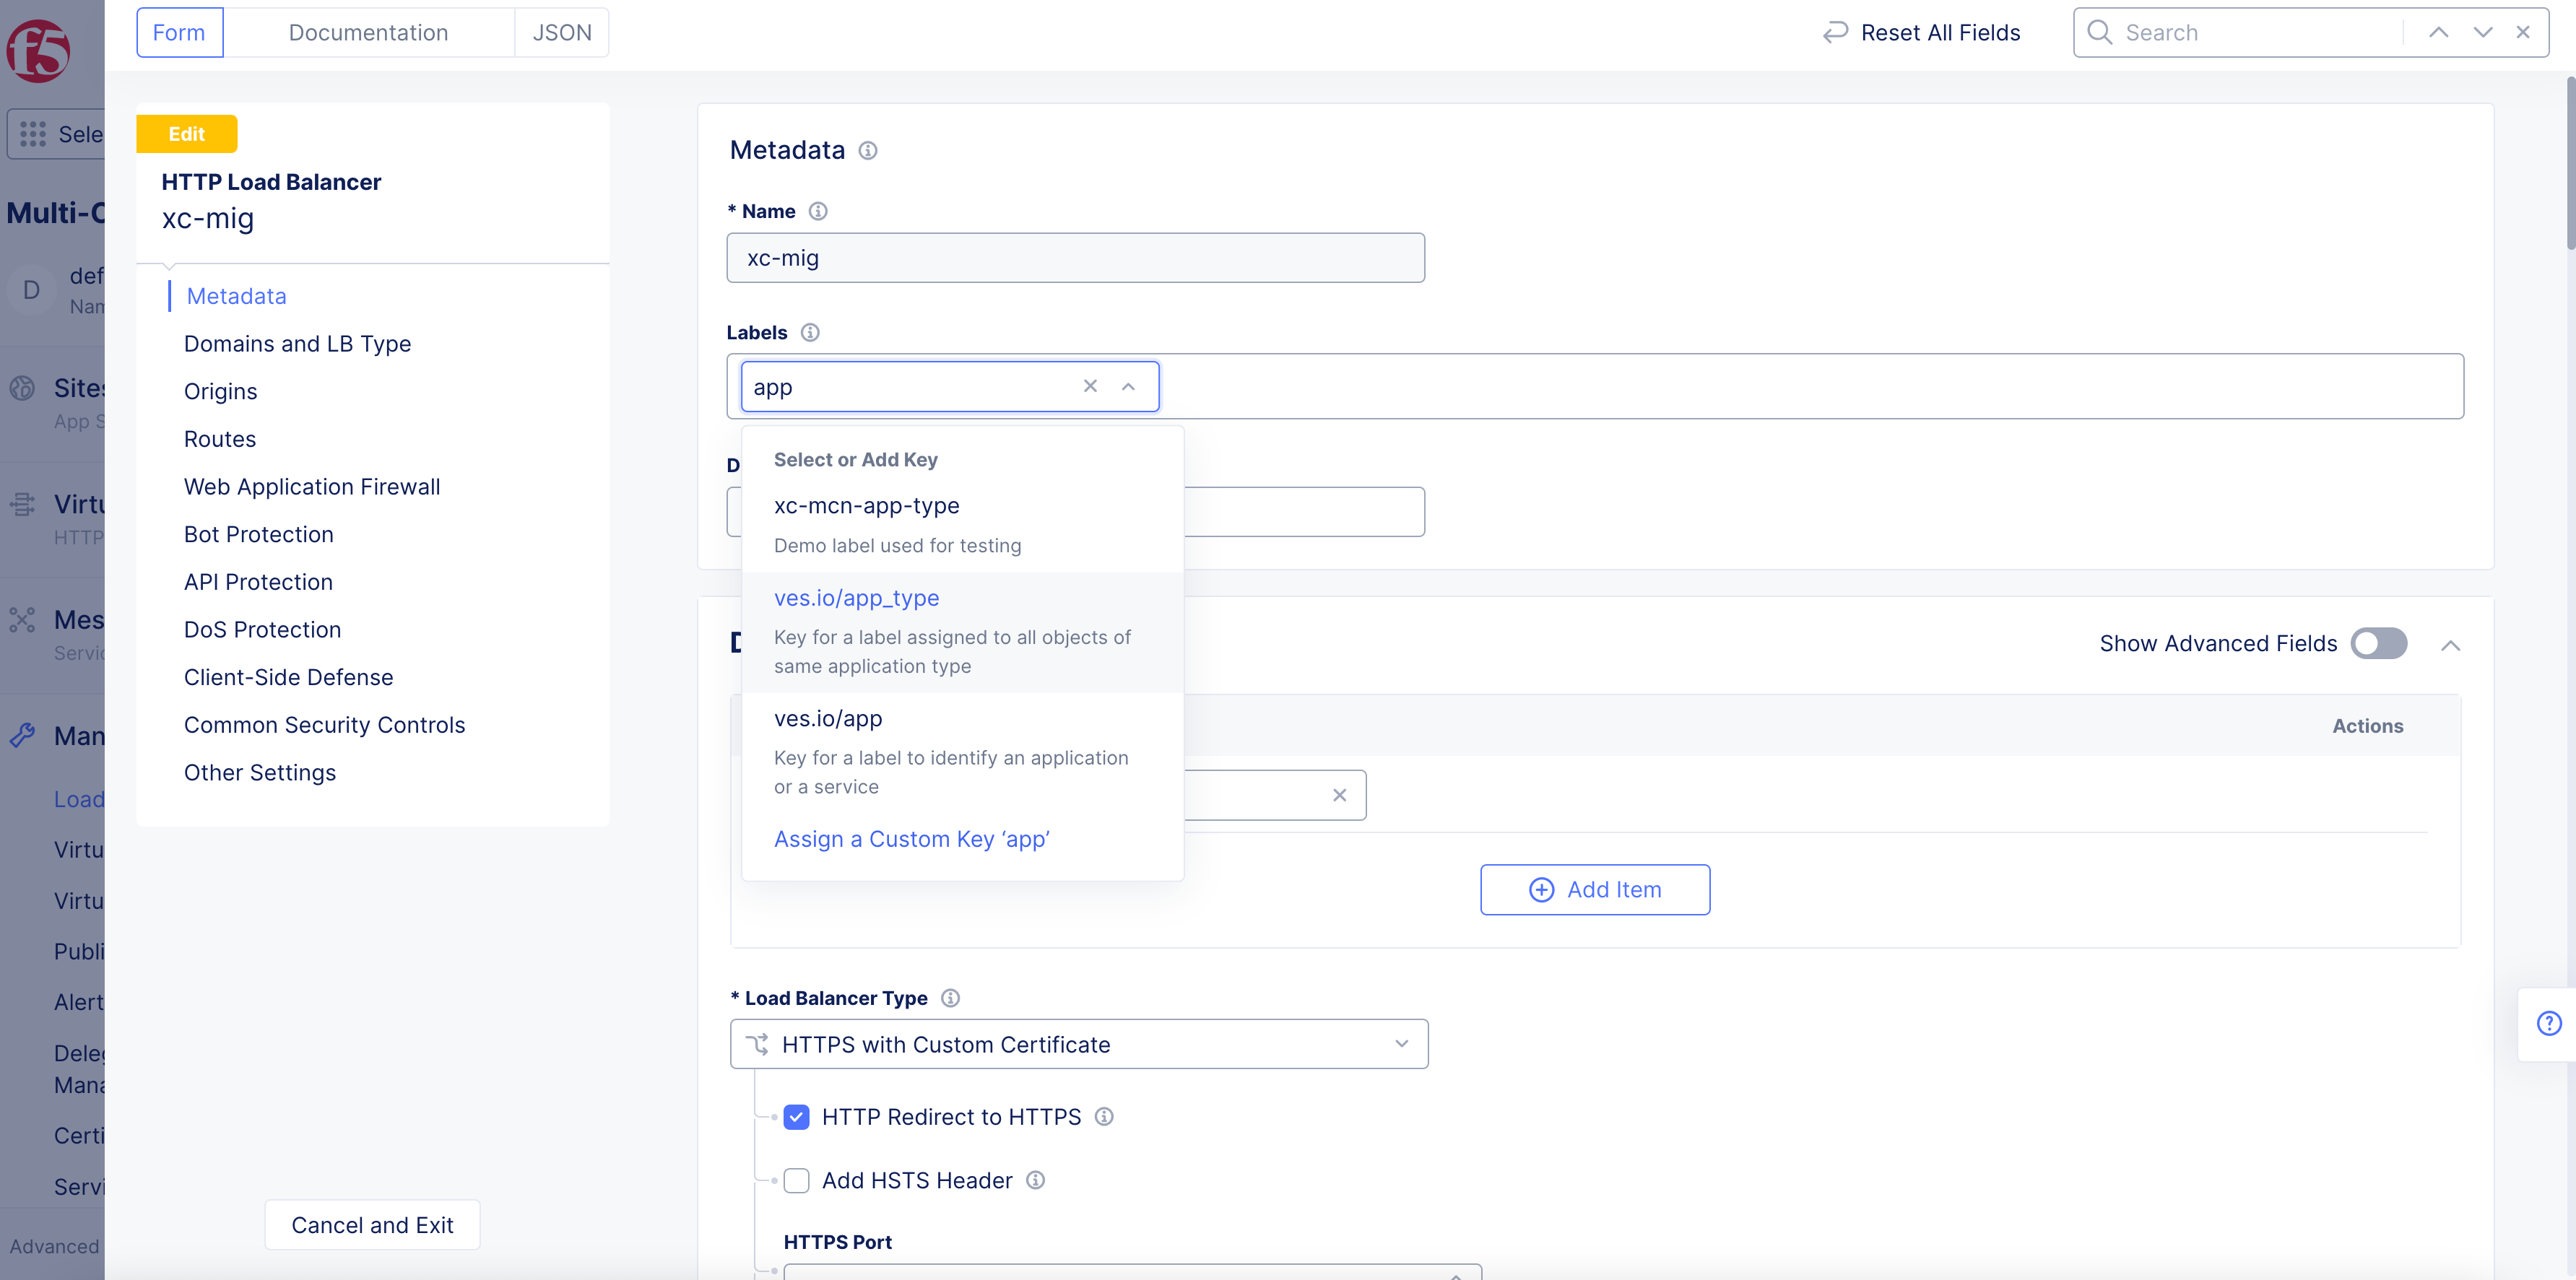
Figure: App Type Label Addition
- Select
Save and Exitto apply the label to the load balancer. This enables the learning and API endpoint markup for the load balancer.
Note: Adding app type label to more than one load balancer groups the data of all such load balancers into a single learning model and presents the API endpoint markup analysis in the service mesh.
Monitor API Endpoints and PDFs
You can monitor and inspect the API endpoint markup and PDFs using the following two methods:
-
From the load balancers option in your namespace: This displays all endpoints for that load balancer.
-
From the service mesh option in your namespace: This displays all endpoints of all load balancers with the app type label.
Note: Learning of the API Endpoints and associated PDFs is incremental in nature and updated periodically, usually in cycles of 2 - 4 hours. For API Endpoints that do not have any 2xx/3xx responses for the previous two days, these are aged out and are not displayed in the markup. Requests and responses are learned only for successful 2xx and 3xx status codes. Currently, the schema is learned for JSON and form-urlencoded payloads.
Load Balancer Monitoring
Perform the following to inspect the API endpoints and PDFs:
Step 1: Open load balancers monitoring.
-
Switch to
Multi-Cloud App Connectservice and change to desired namespace. -
Select
Overview, selectApplications, scroll down toLoad Balancers.
- Select your load balancer.
Configuration also available with Web Apps & API Protection service > Overview > Security.
Step 2: Open API endpoints view.
-
Next to the name of your load balancer at the top, use the monitoring pull down to select
Security Monitoring. -
Select the
API Endpointstab.
Step 3: Observe all API types.
-
Refresh page to view current API results when any changes are made in Console.
-
Select an endpoint to view the
Endpoint Detailsslide-out page. -
In the slide-out page, select one or all of the following tabs to view the corresponding information:
Overview: View error rates, latency data, request and response data.
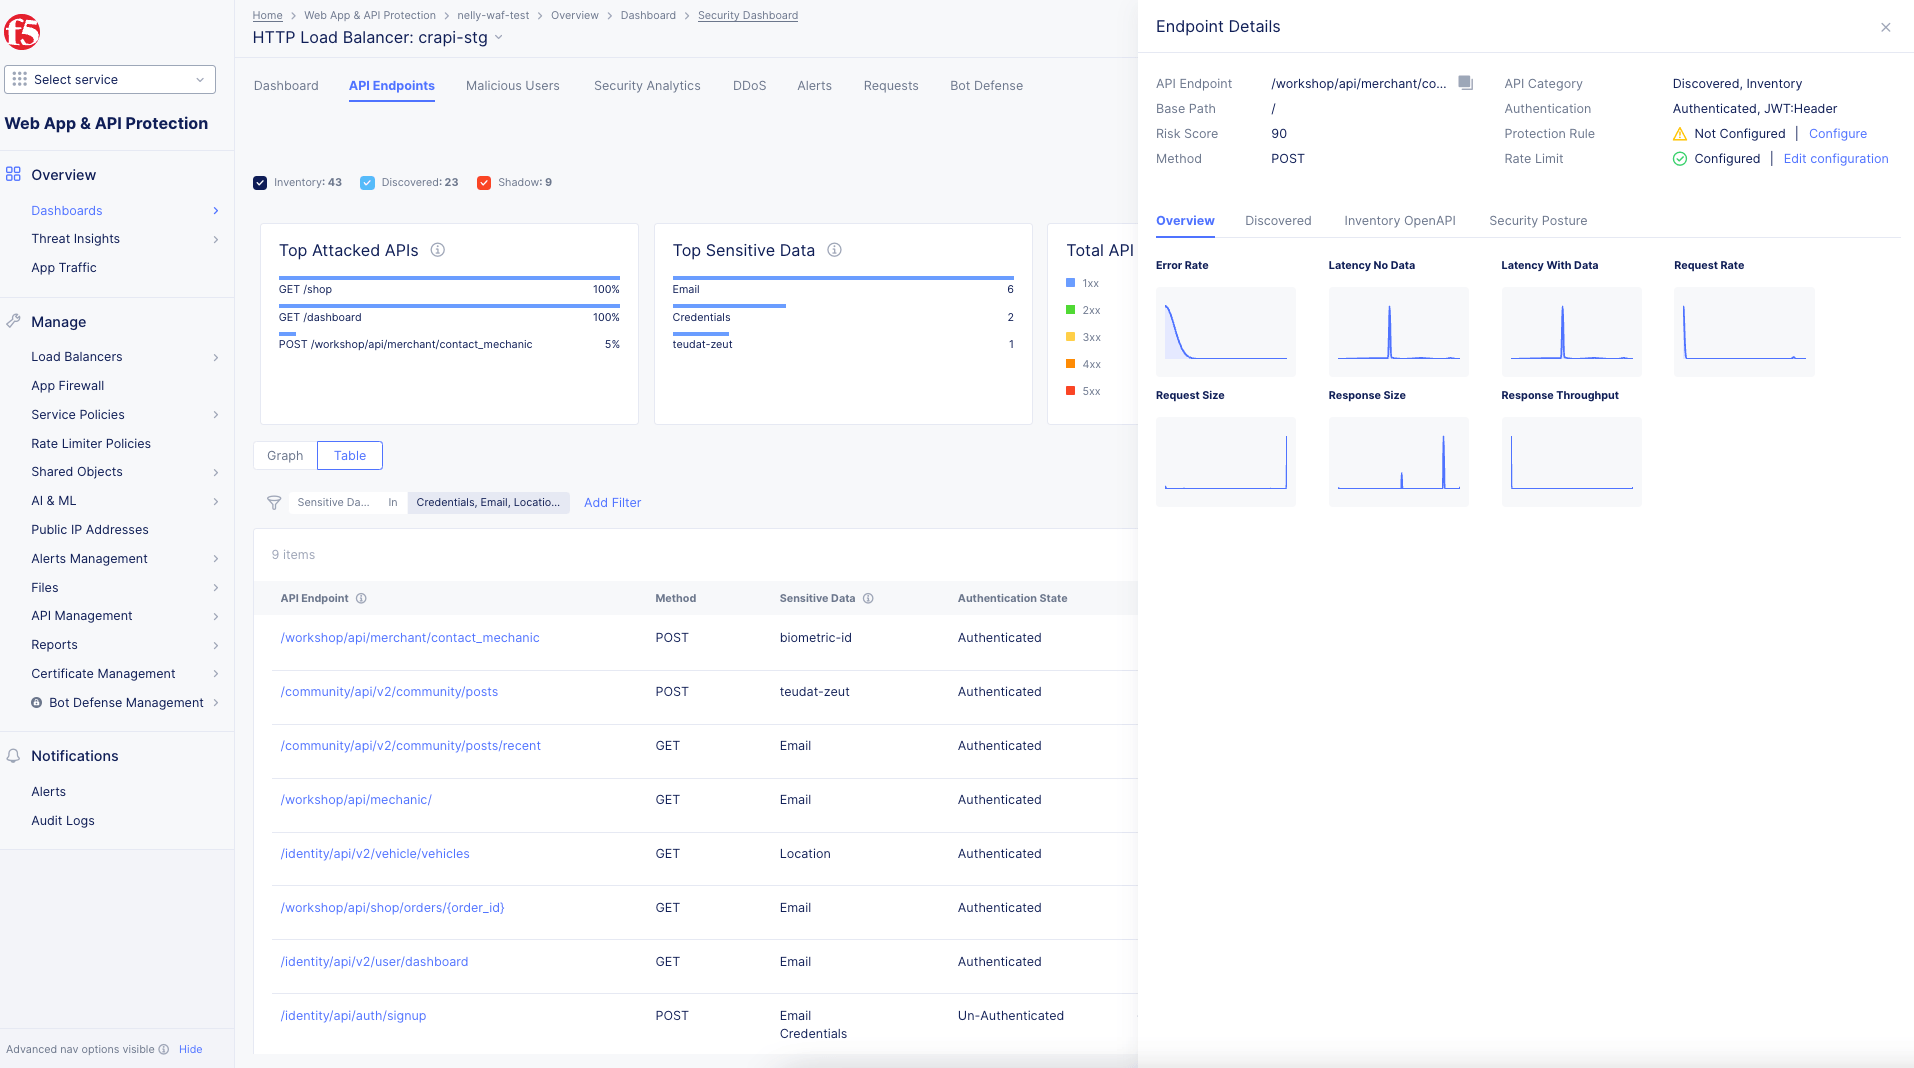
Figure: Overview
Discovered: ViewSensitive Datathat was detected in each request. ViewRequestandResponsedata for headers. ViewOpenAPIdata for discovered schemas. Also, you can viewAuthenticationfor authentication types.
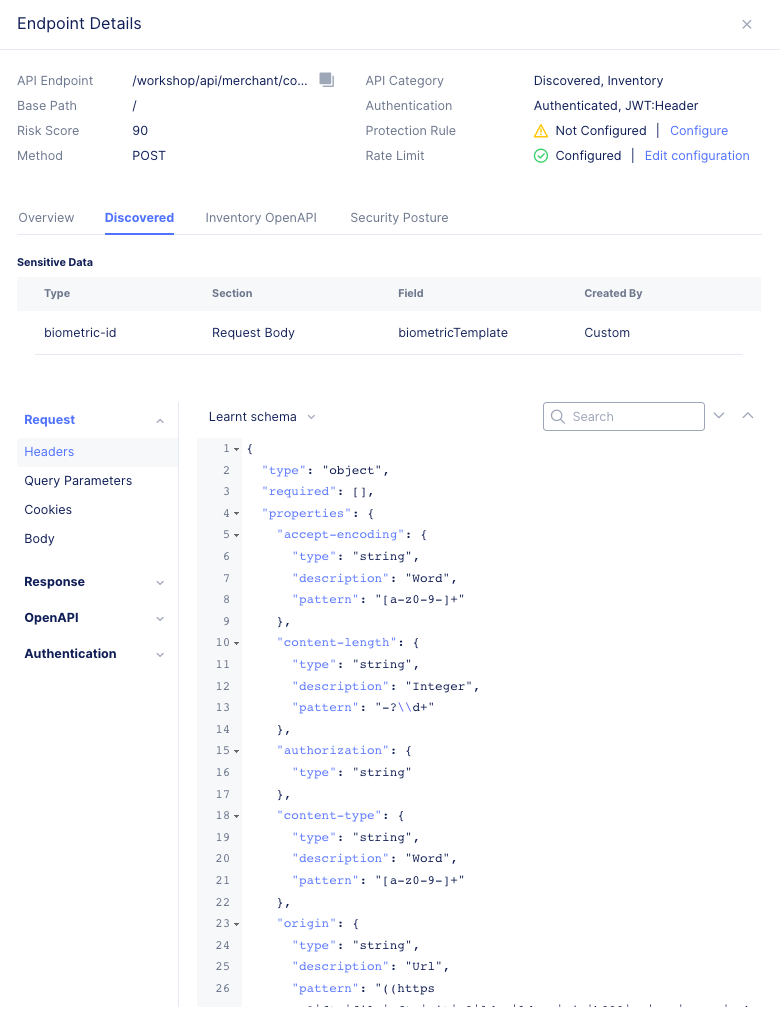
Figure: Discovered
Inventory OpenAPI: View any available API schemas for the endpoint.
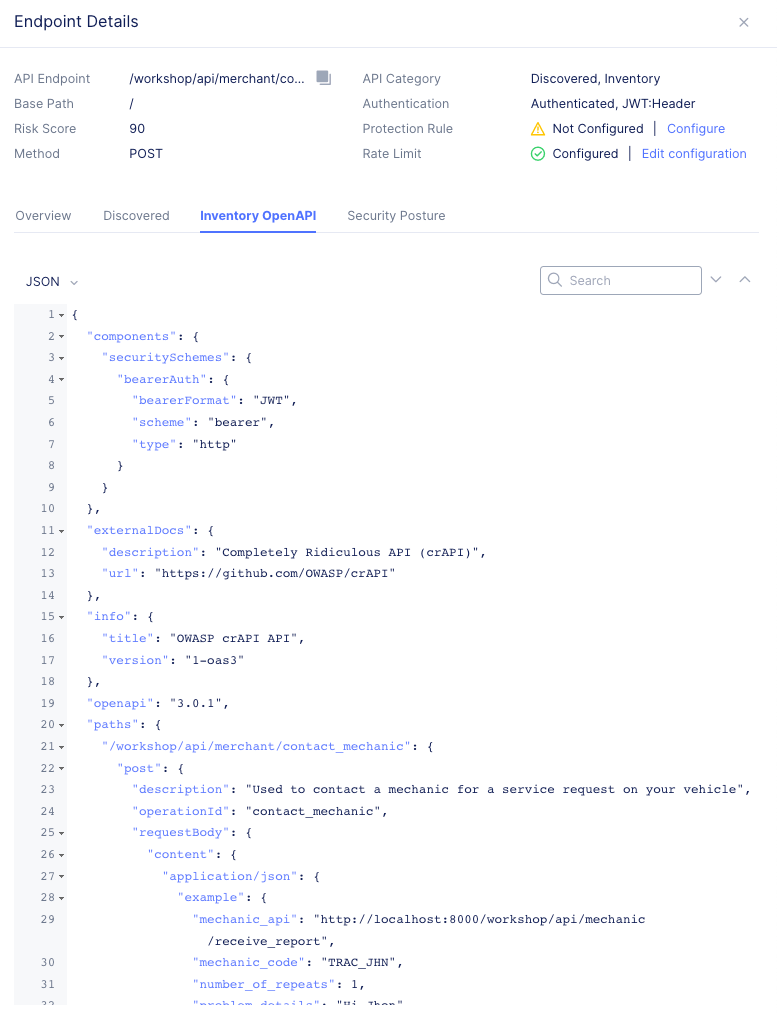
Figure: Inventory
Security Posture: View any detected security vulnerabilities for the endpoint.
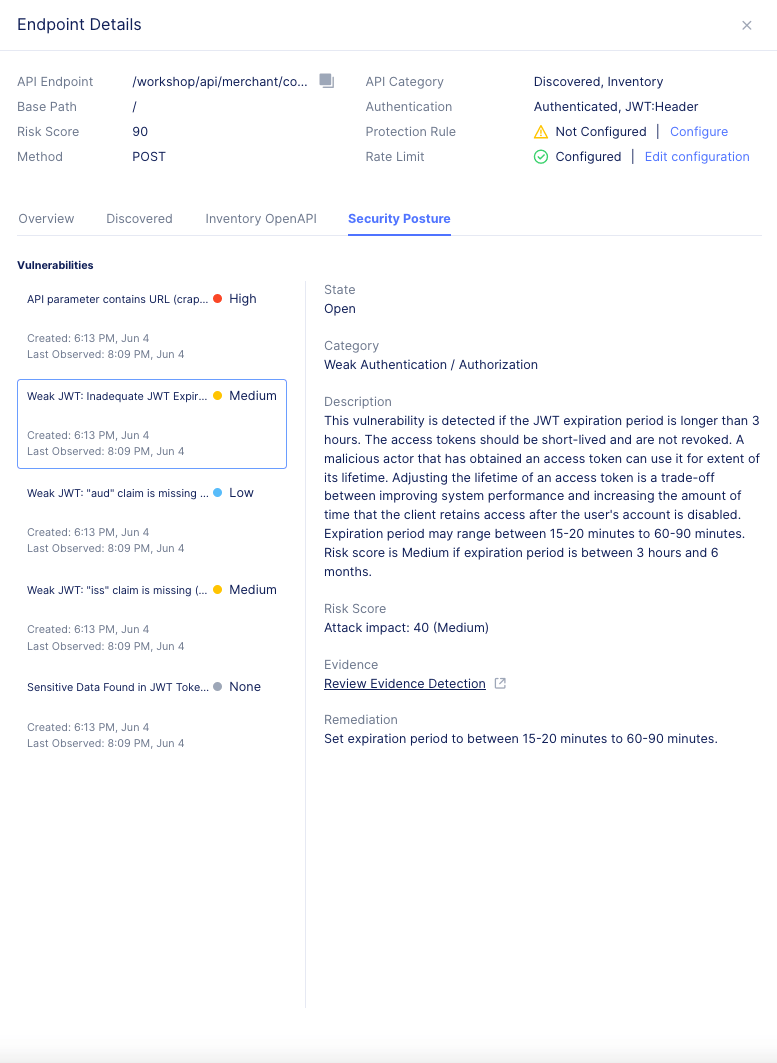
Figure: Security Posture
- Close the slide-out page when finished.
Step 4: Enable columns.
To enable more columns or to remove them, select the gear icon. Select or unselect the column name and then click Apply. This image shows how to select the API Attributes column.
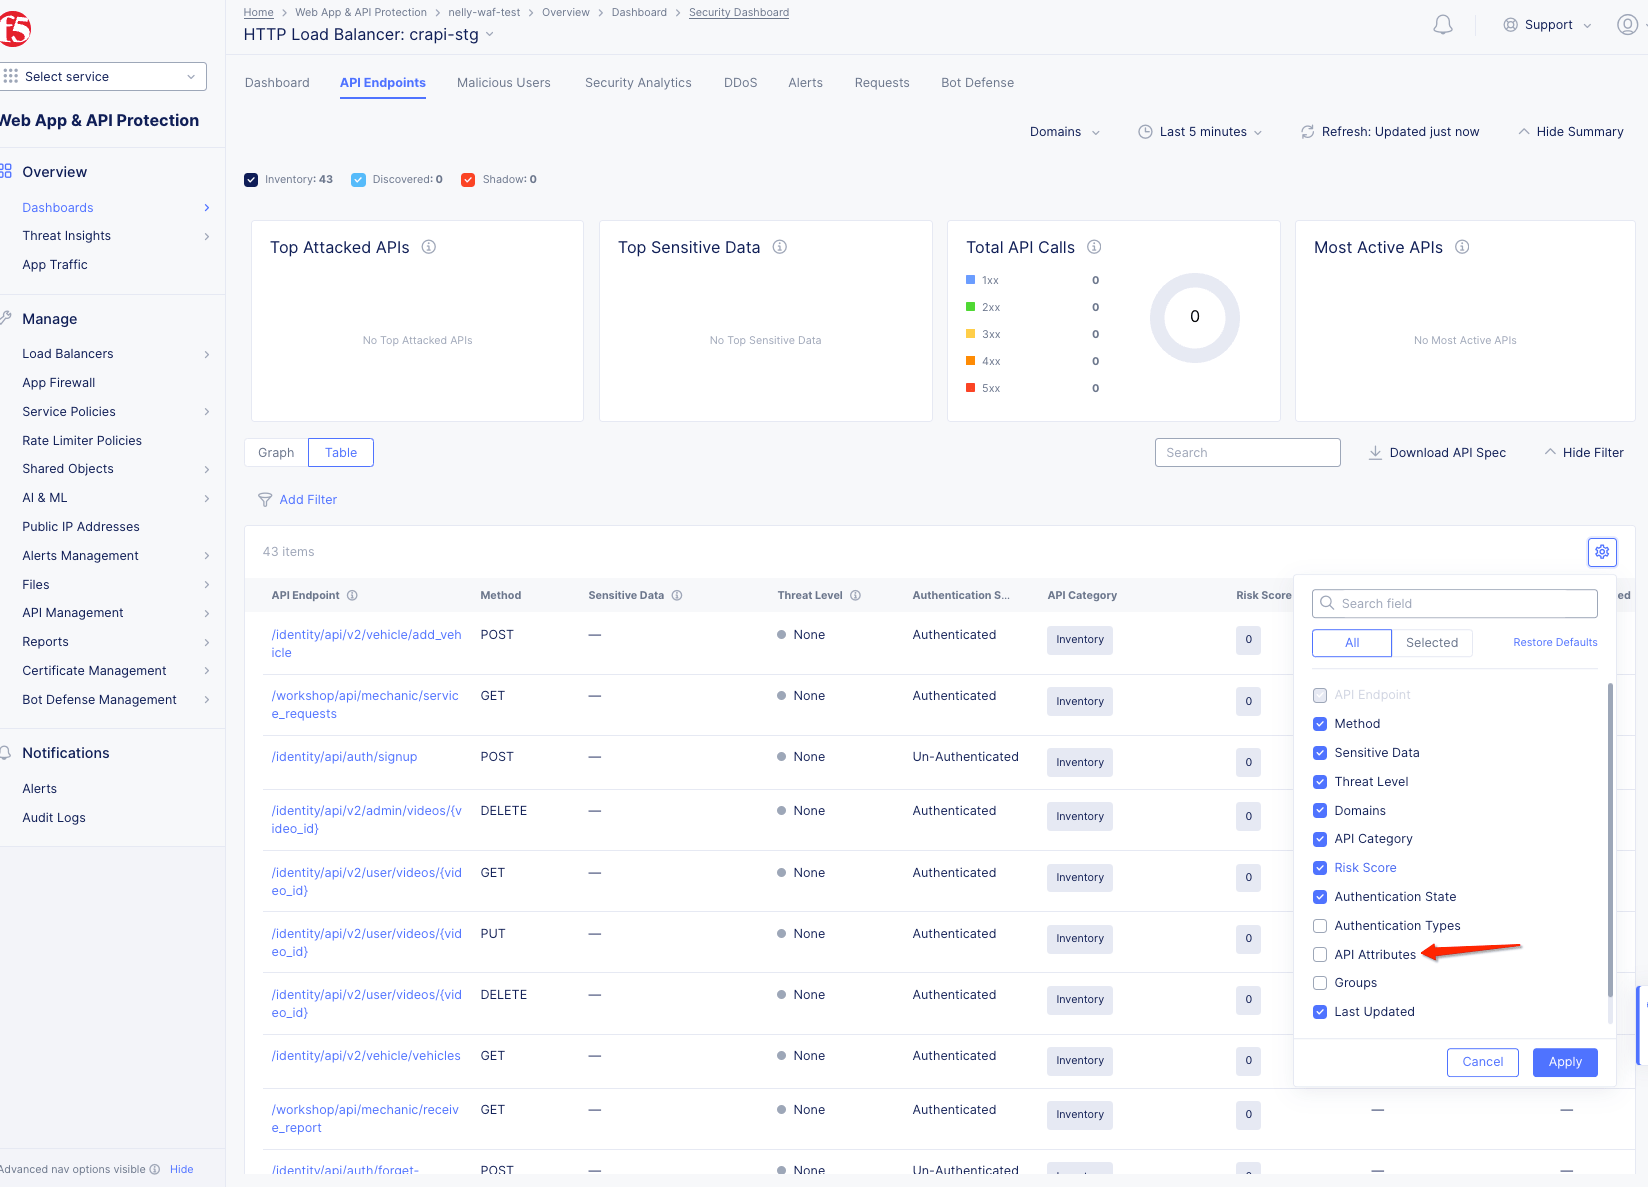
Figure: Enable Columns
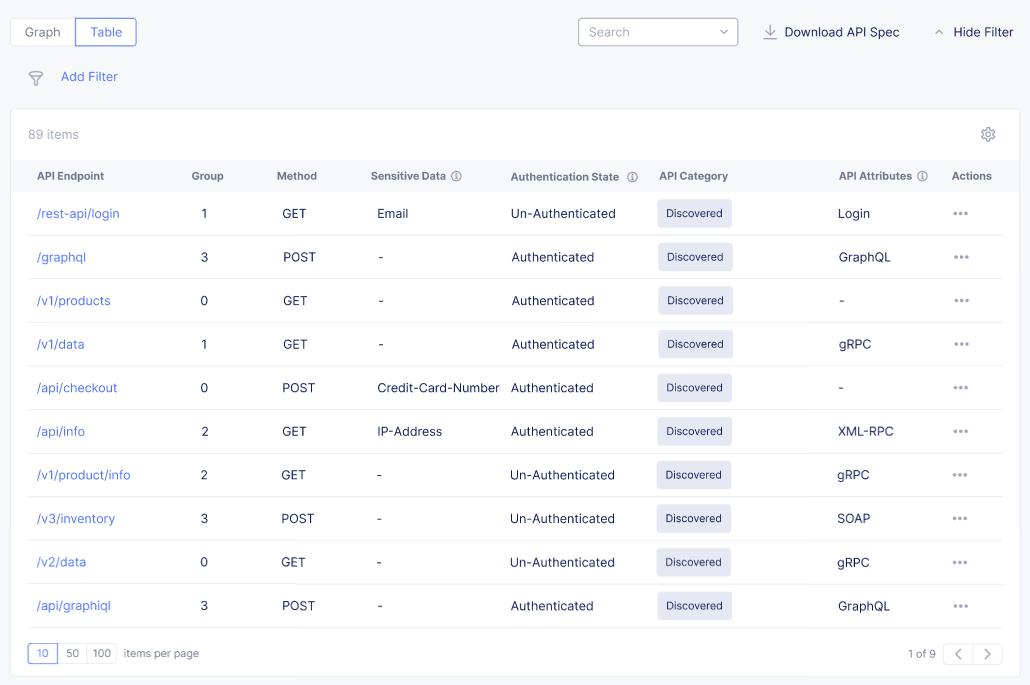
Figure: API Attributes Column
Step 5: Configure protection rules.
- Select
Tableview above the graph.
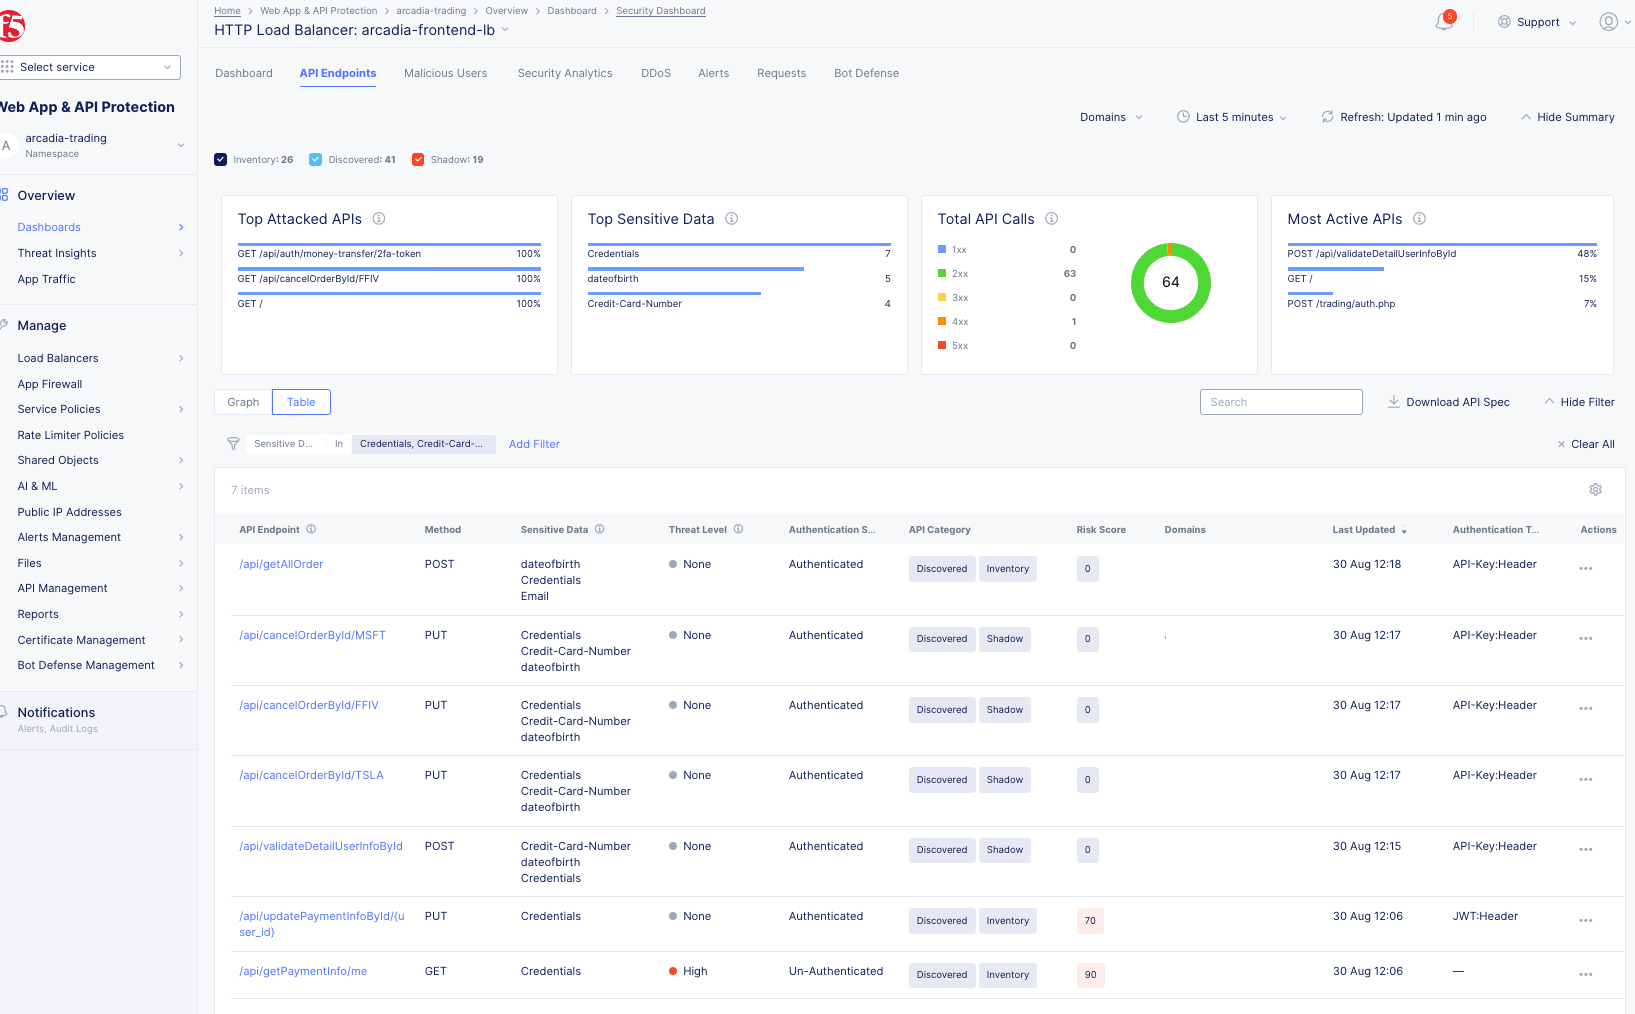
Figure: Observe All API Types
-
To enable more columns or to remove them, select the gear icon. Select or unselect the column name and then click
Apply. -
Find the path in the
Pathcolumn that you want to apply protection and rate limiting rules to. -
Select
...>Edit Protection Rule. -
Enter a
Nameand edit the configuration as needed. -
Select
Applyto save the configuration. -
Select
Applyto save the API protection rules. -
Select
Save and Exitto save the updated load balancer.
Step 6: View detected vulnerabilities and risk scores.
-
Under the
Risk Scorecolumn, view the score attached to each respective API endpoint. The higher the score, the more sever the vulnerability. -
To view the detected vulnerabilities, select the endpoint.
-
Select the
Security Posturetab to see the name of the vulnerability. You can also seeState,Category, andDescriptionproviding more information on the particular vulnerability. Also, theRemediationparagraph provides a proposed solution to address the vulnerability. To categorize any endpoint vulnerabilities, select on a vulnerability. From theChange Statemenu, select an option. -
To close the popup window, select the
Xin the top right corner.
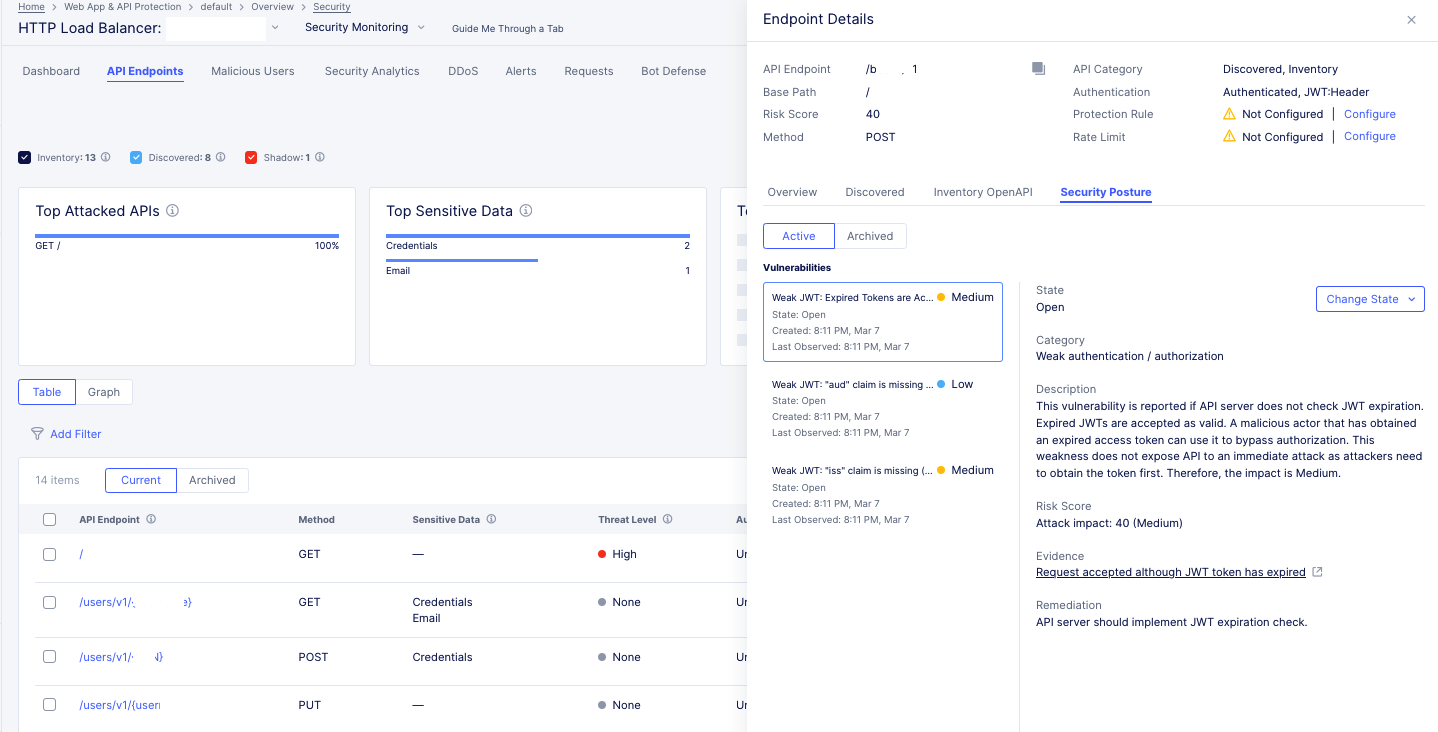
Figure: View Vulnerability and Remediation
Step 7: Configure API rate limiting rules.
-
Select
...>Edit Rate Limit. -
Update the parameters as required.
-
Select
Applyto save the configuration. -
Select
Save and Exitto save the load balancer.
Step 8: View multiple endpoints for a single domain.
You can view multiple endpoints for a single domain. For each of the endpoints, you can view the endpoint details and any detected PII.
-
In the
Web App & API Protectionservice, select the desired namespace. -
From the bottom of the page, select your load balancer.
-
Select
Security Dashboard. -
Select the
API Endpointstab. This tab provides a summary of all discovered endpoints for each domain. When you select a specific domain, schema and sensitive data are presented as learned for this specific domain. If multiple domains are selected, the presented schema is learned across all domains. You can see a summary of the following:-
Top Attacked APIs: Presents the top three API endpoints with the highest percentage of security events over traffic per endpoint. -
Top Sensitive Data: Presents the top three sensitive types detected in maximum number of API endpoints. The widget represents only current state, not effected by selected time range. -
Total API Calls: Presents the distribution of API calls by response codes. -
Most Active APIs: Presents the top three API endpoints with the highest percentage of traffic over all detected API traffic for the load balancer.
-
-
From the
Domainsdrop-down menu, select a domain or multiple domains and then selectApply. -
Select an endpoint to view its corresponding information.
Service Mesh Monitoring
Note: The three types of APIs are distinguished only in Load Balancer API endpoint view.
Perform the following to inspect the API endpoints and PDFs:
Step 1: Navigate to service mesh.
-
Select
Multi-Cloud App Connectservice. -
Select the desired namespace from the
Namespacedrop-down menu. -
In
Overview>Applications. -
Select
Service Meshtab.
- Select on your application tile from the displayed list to load its service mesh monitoring.
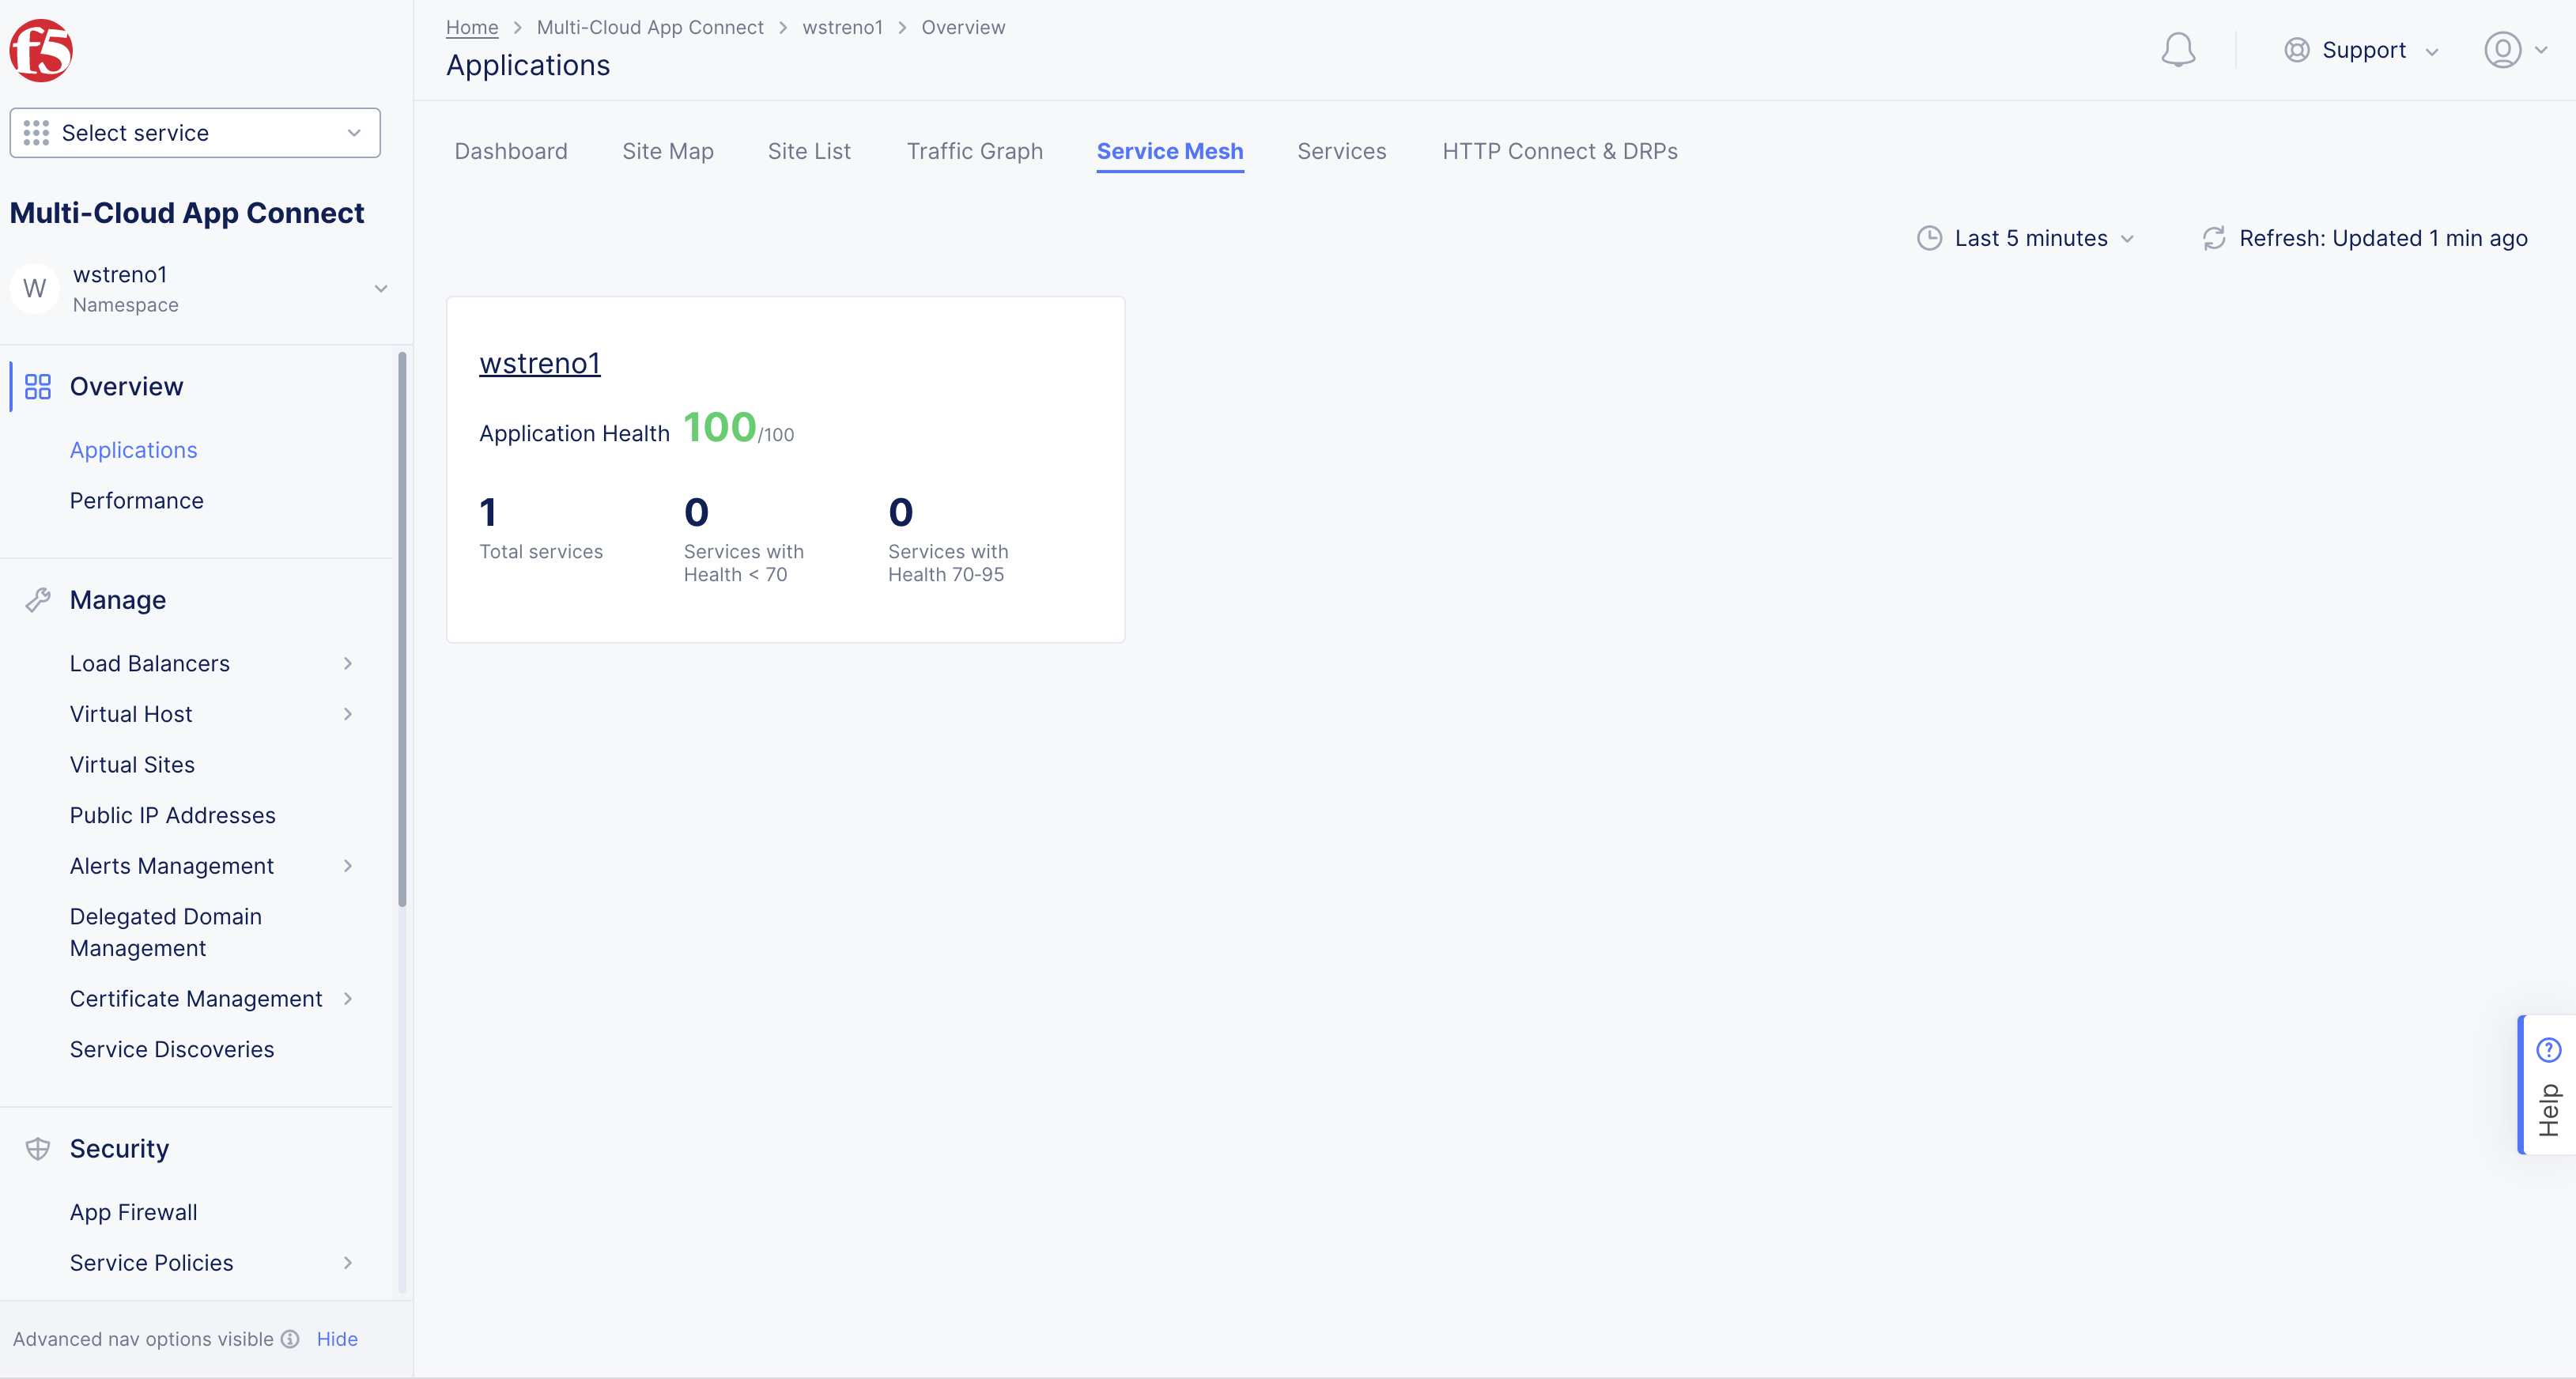
Figure: Navigate to Service Mesh
Step 2: Load the endpoints view.
The service mesh loads service graph by default.
- Select the
API Endpointstab to load the API endpoint markup view. The endpoint paths are shown in a hierarchical structure with root and leaf relationships presented in segments.
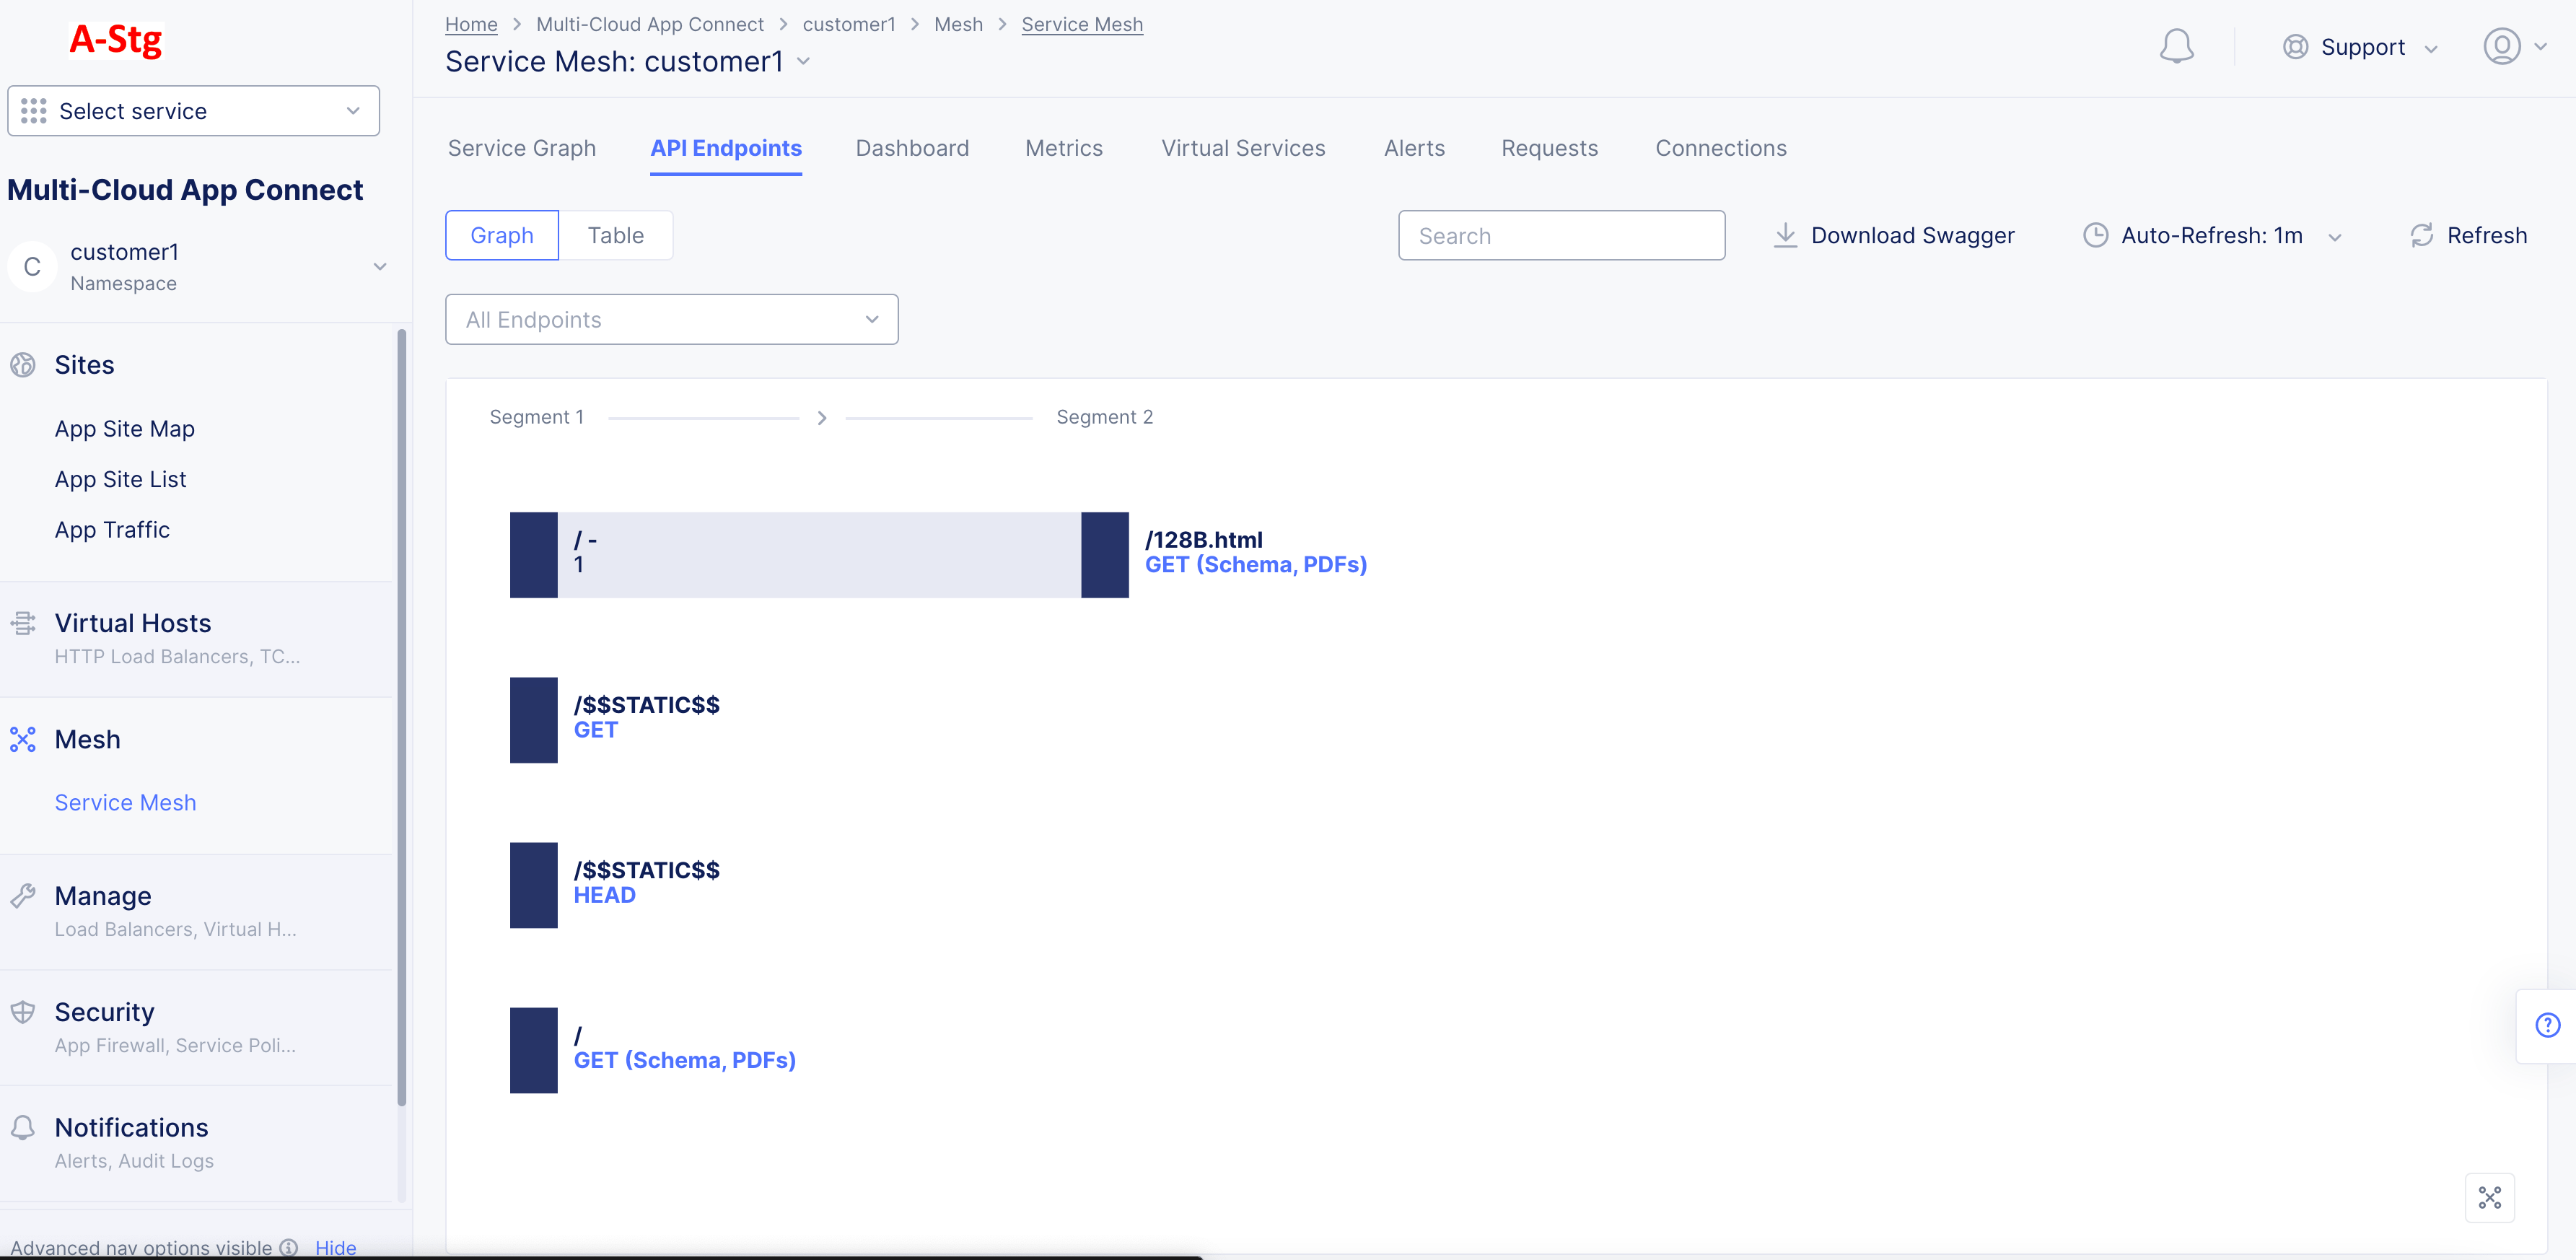
Figure: Service Mesh Endpoints View
- Select a service edge from the
All Endpointsdrop-down to display the API endpoints specific for that service interaction.
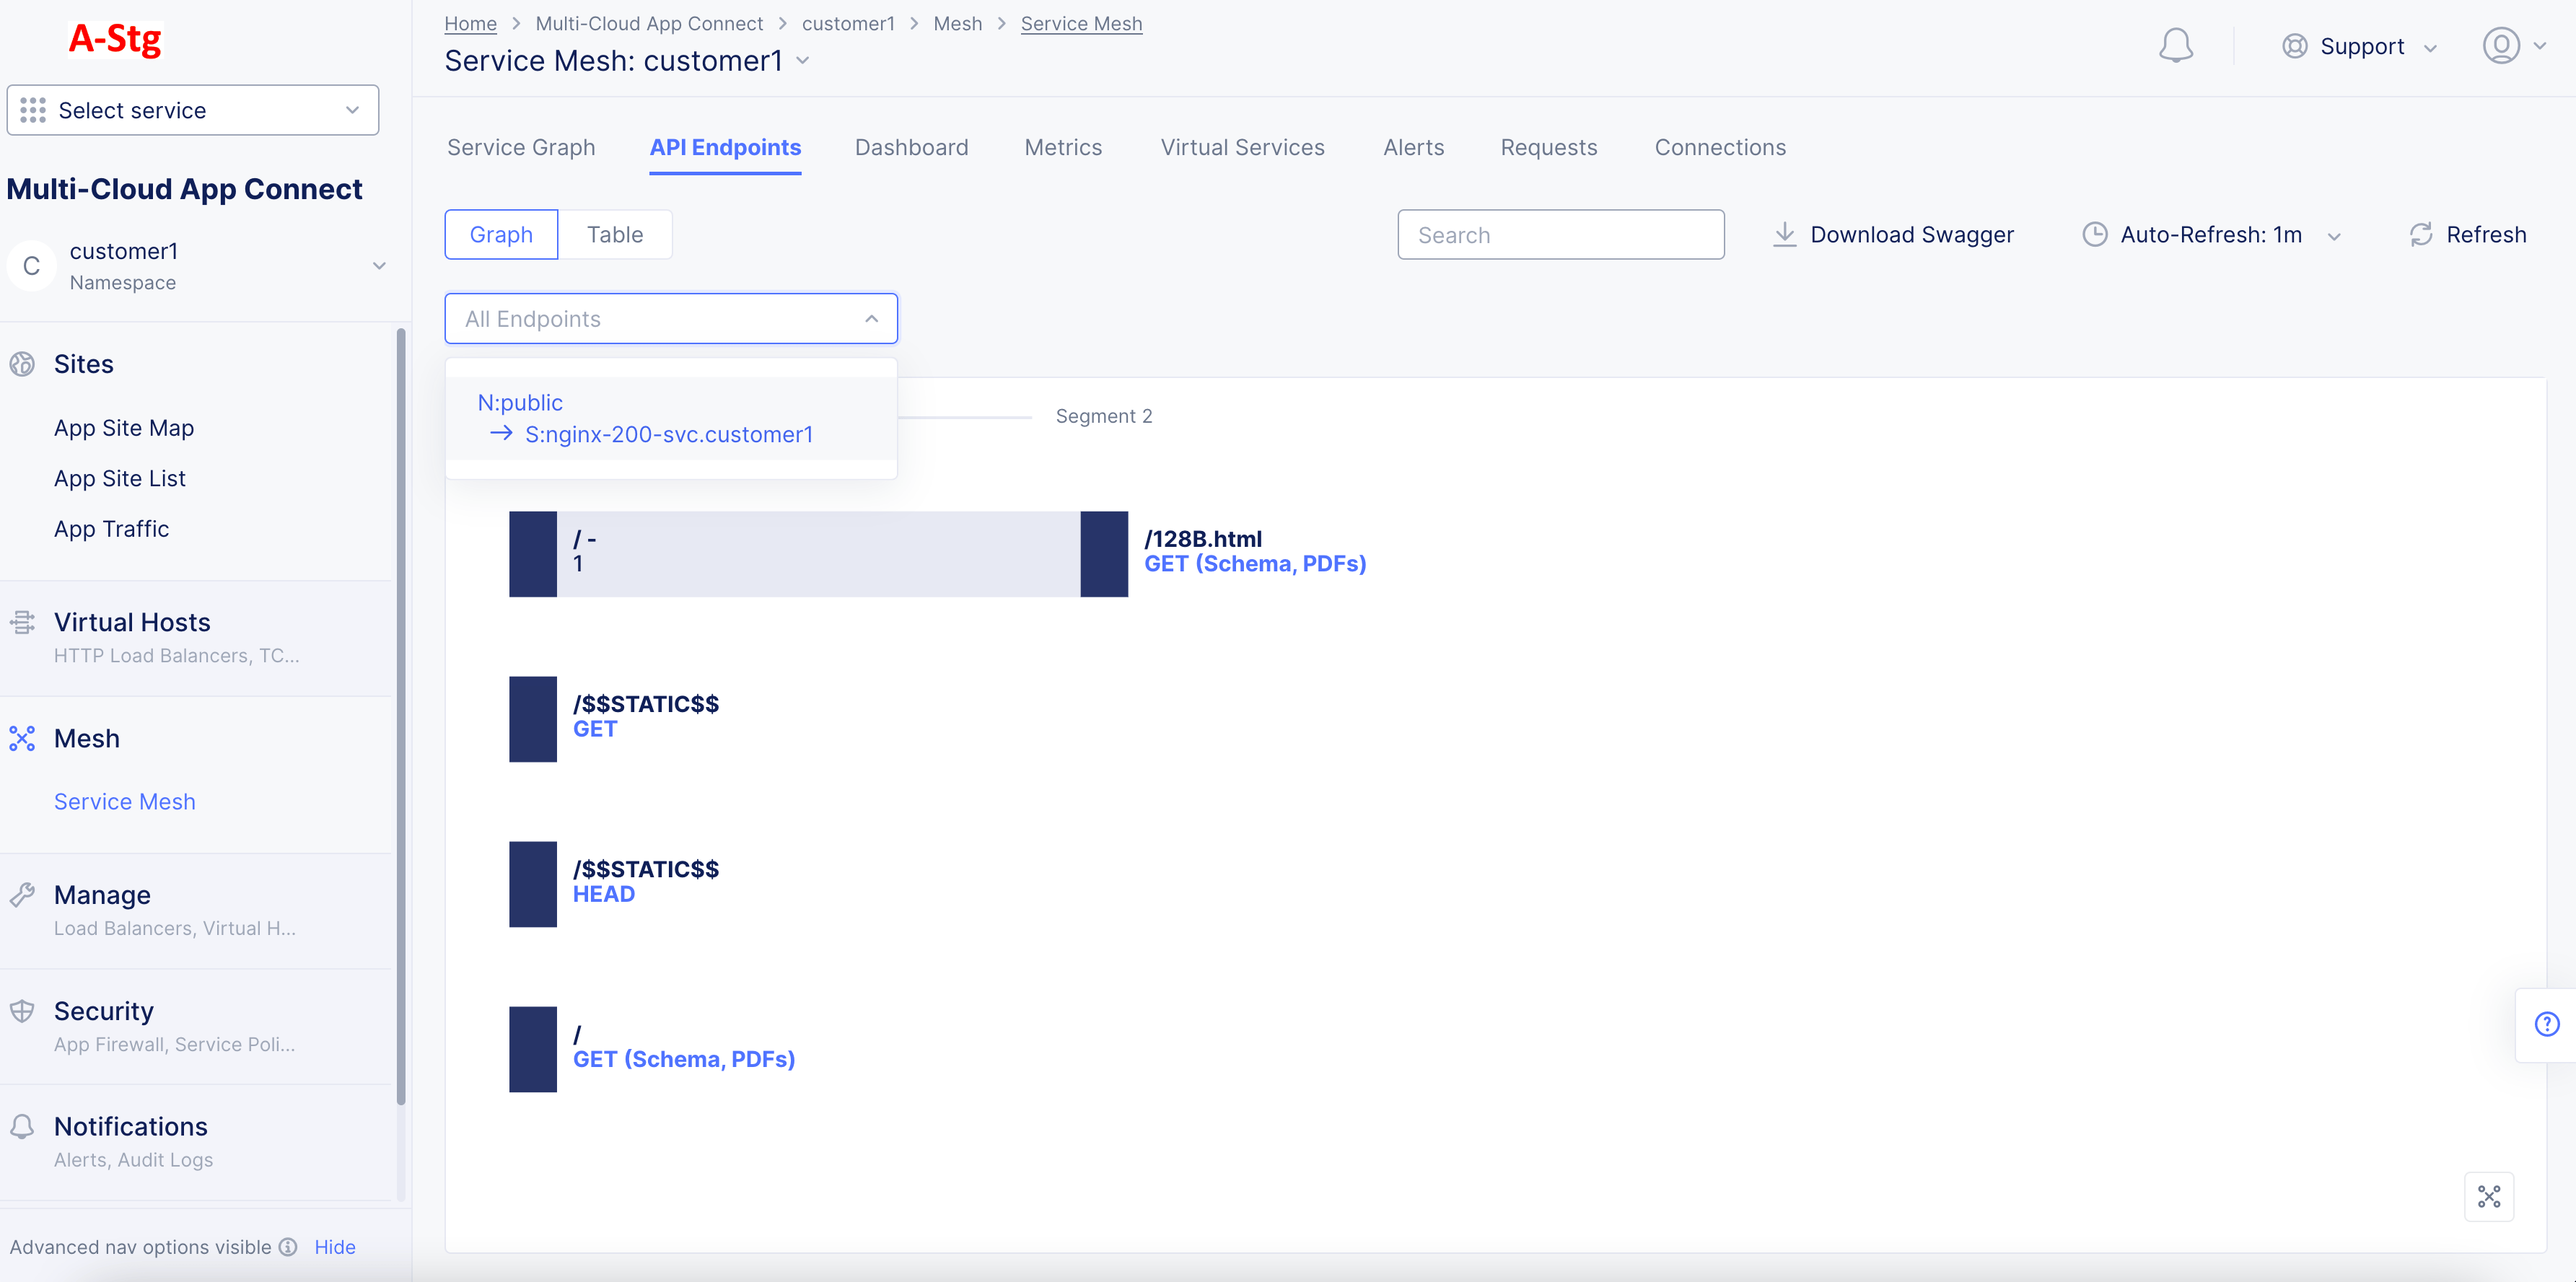
Figure: API EP Markup for Specific Service Interaction
Note: You can also load API endpoint markup for a specific service interaction from the
Service Graphview. Select an edge to load the quick view for that edge and select onEndpointsin the quick view to load the endpoints view for that specific service interaction. By inspecting the edge level API endpoint markup, you can determine which APIs are supposed to be functional between those nodes(services) and apply further security using service policies to restrict the traffic to those APIs only.
- Select the
Searchdrop down and then select a specific API to display the hierarchy for that path.
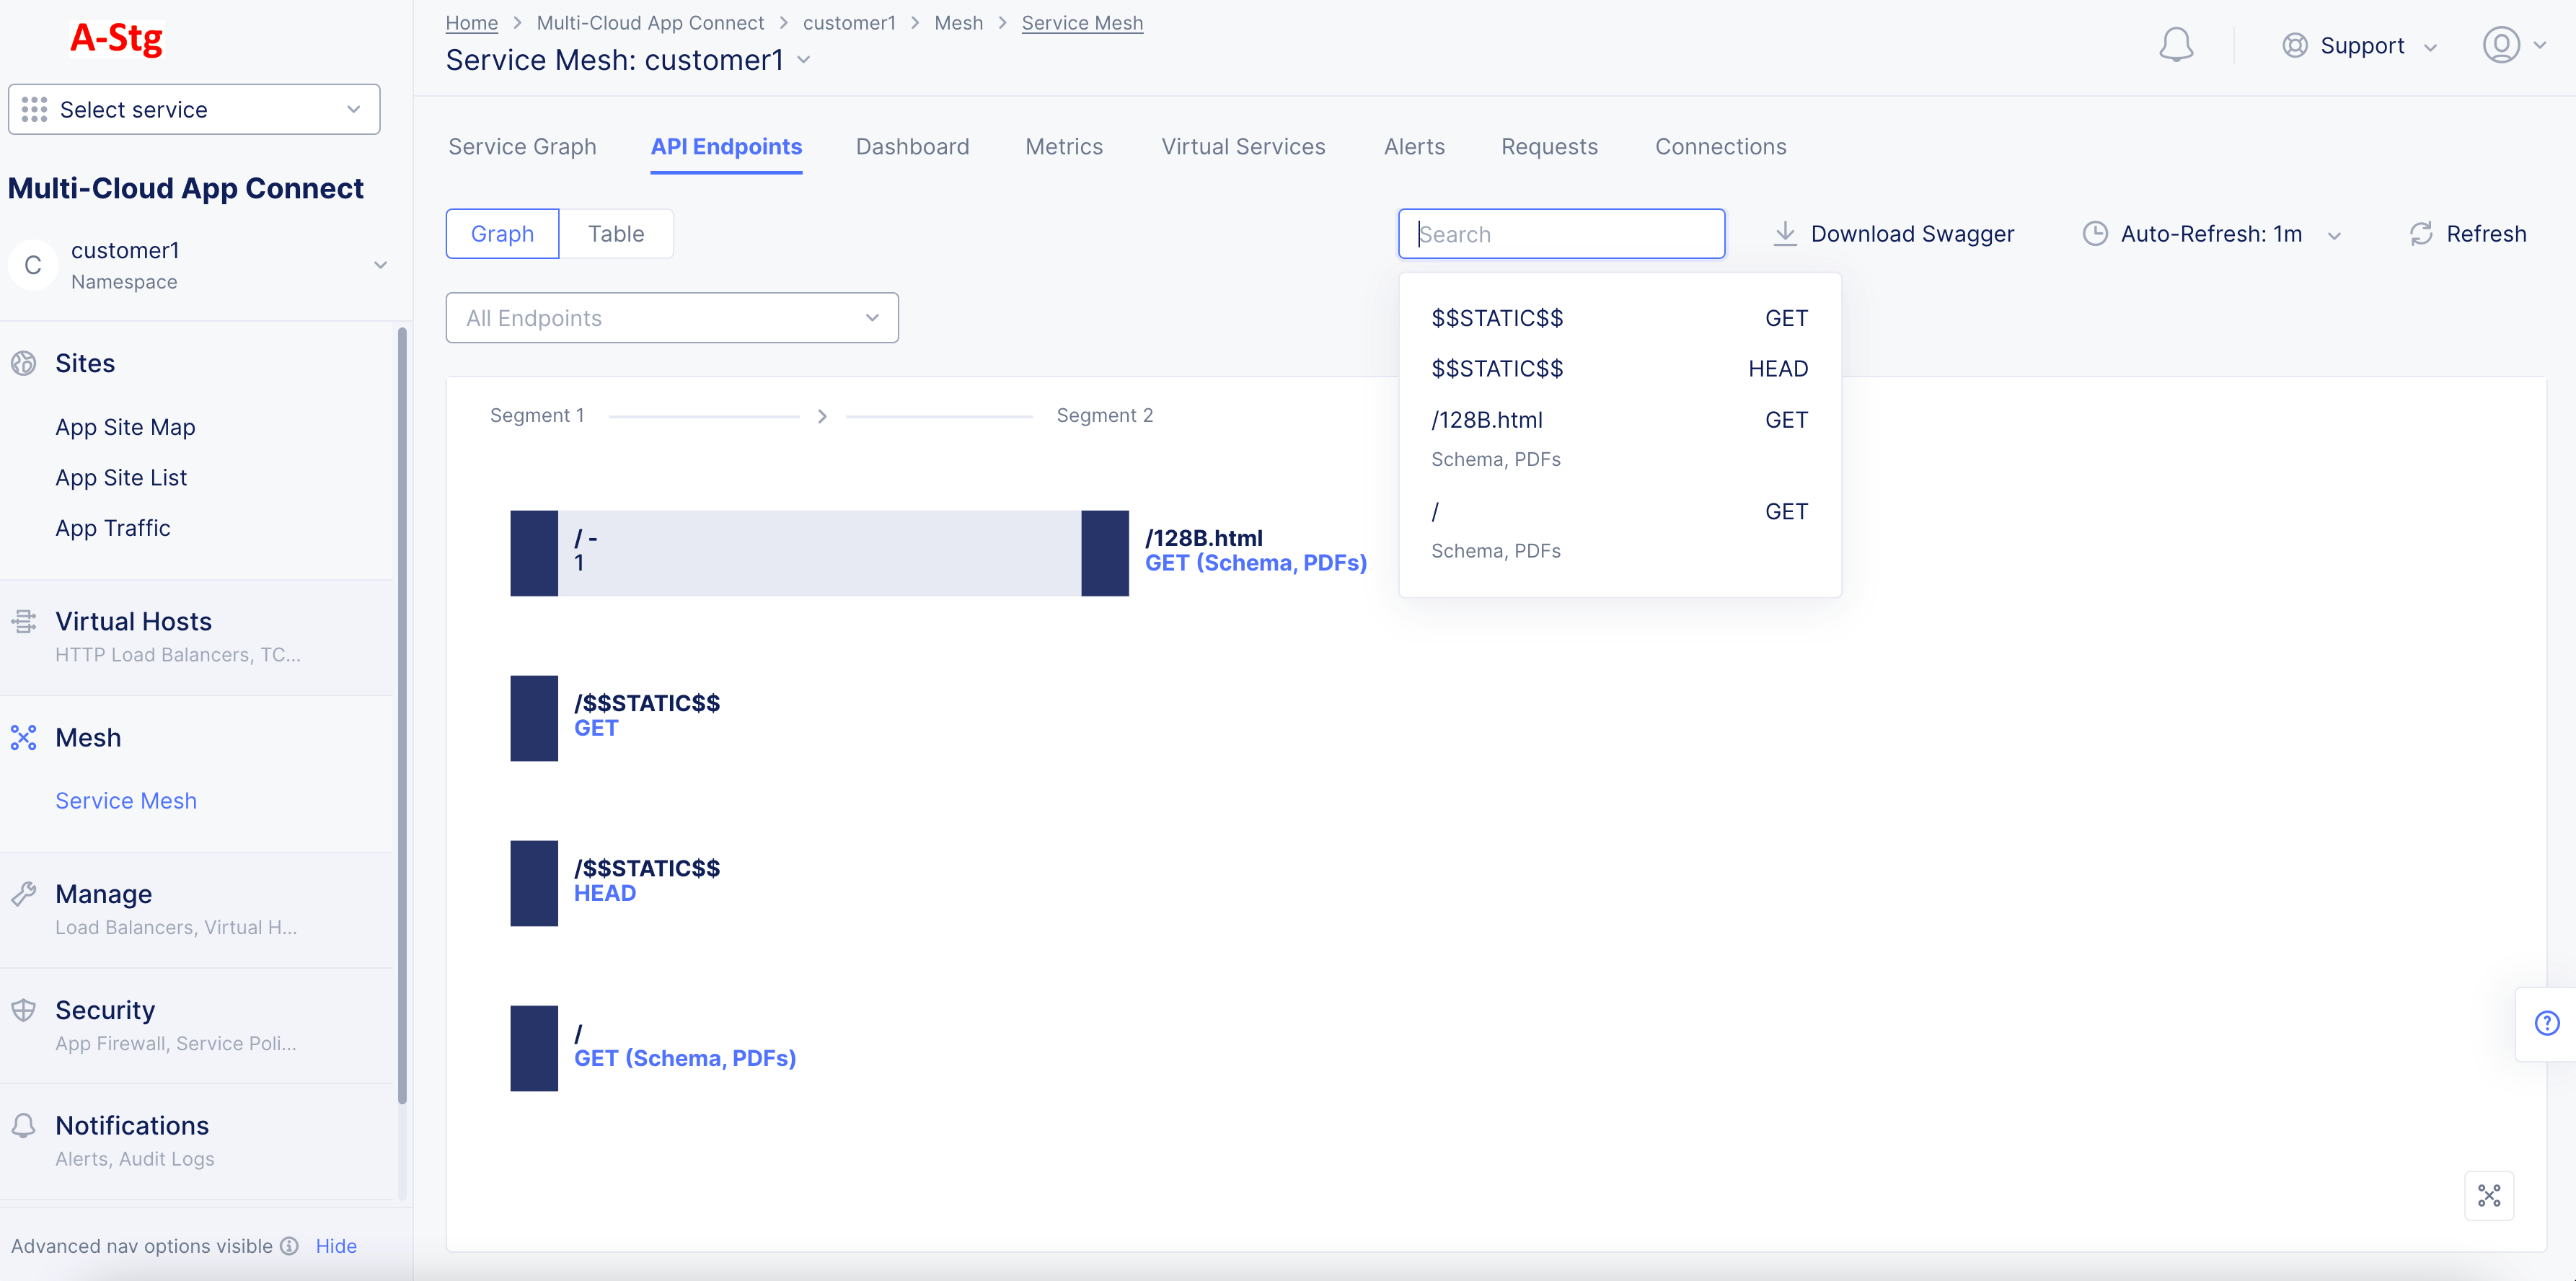
Figure: API Endpoint Markup for Specific API
The following sample shows collapsed URL presented as a dynamic component:
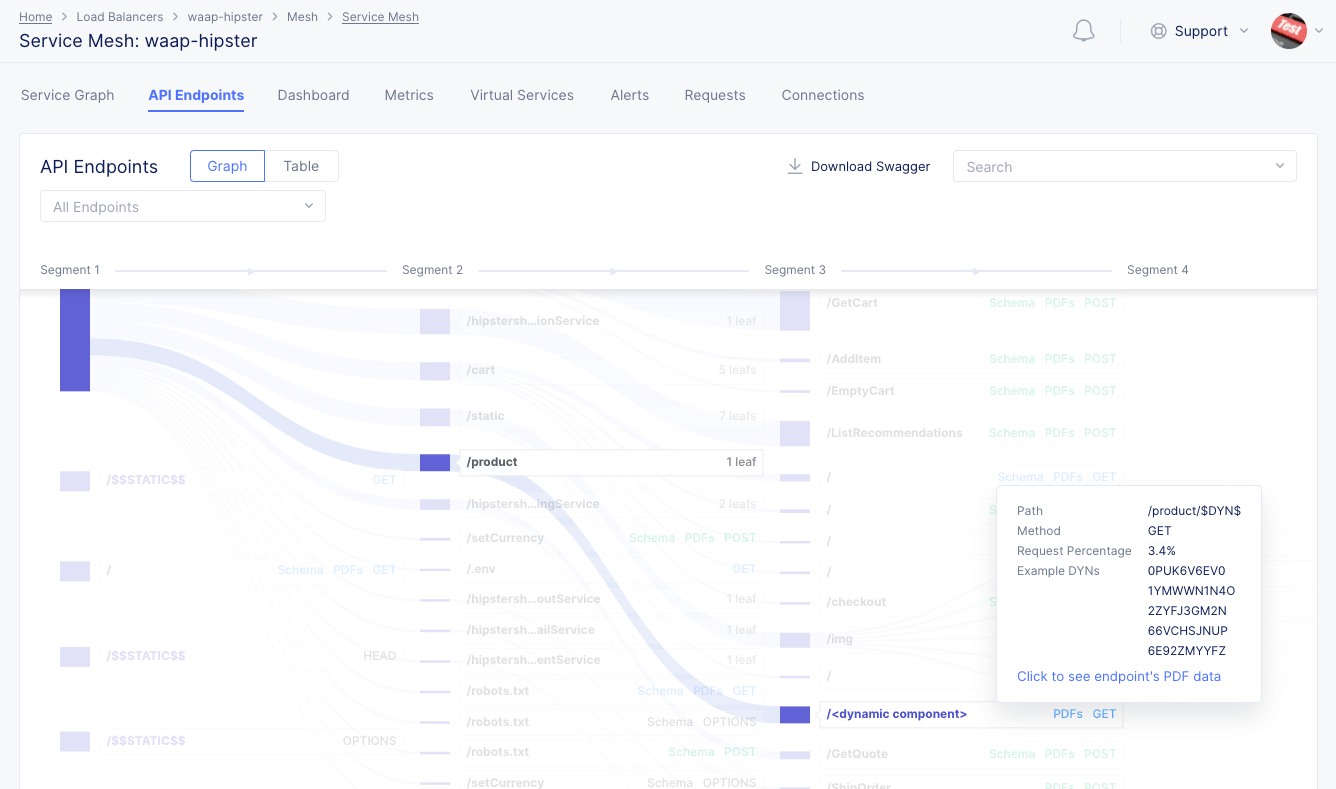
Figure: Dynamic Component in API Endpoint Markup
Note: The API endpoint markup also displays static resources. These are regular static resources, such as JavaScript files that a web application uses.
- Select any path to expand or collapse it. If a path displays the method or
<METHOD> (Schema, PDFs), select it to display a quick PDF view.
Note: Refresh page to view current API results when any changes are made in the Console.
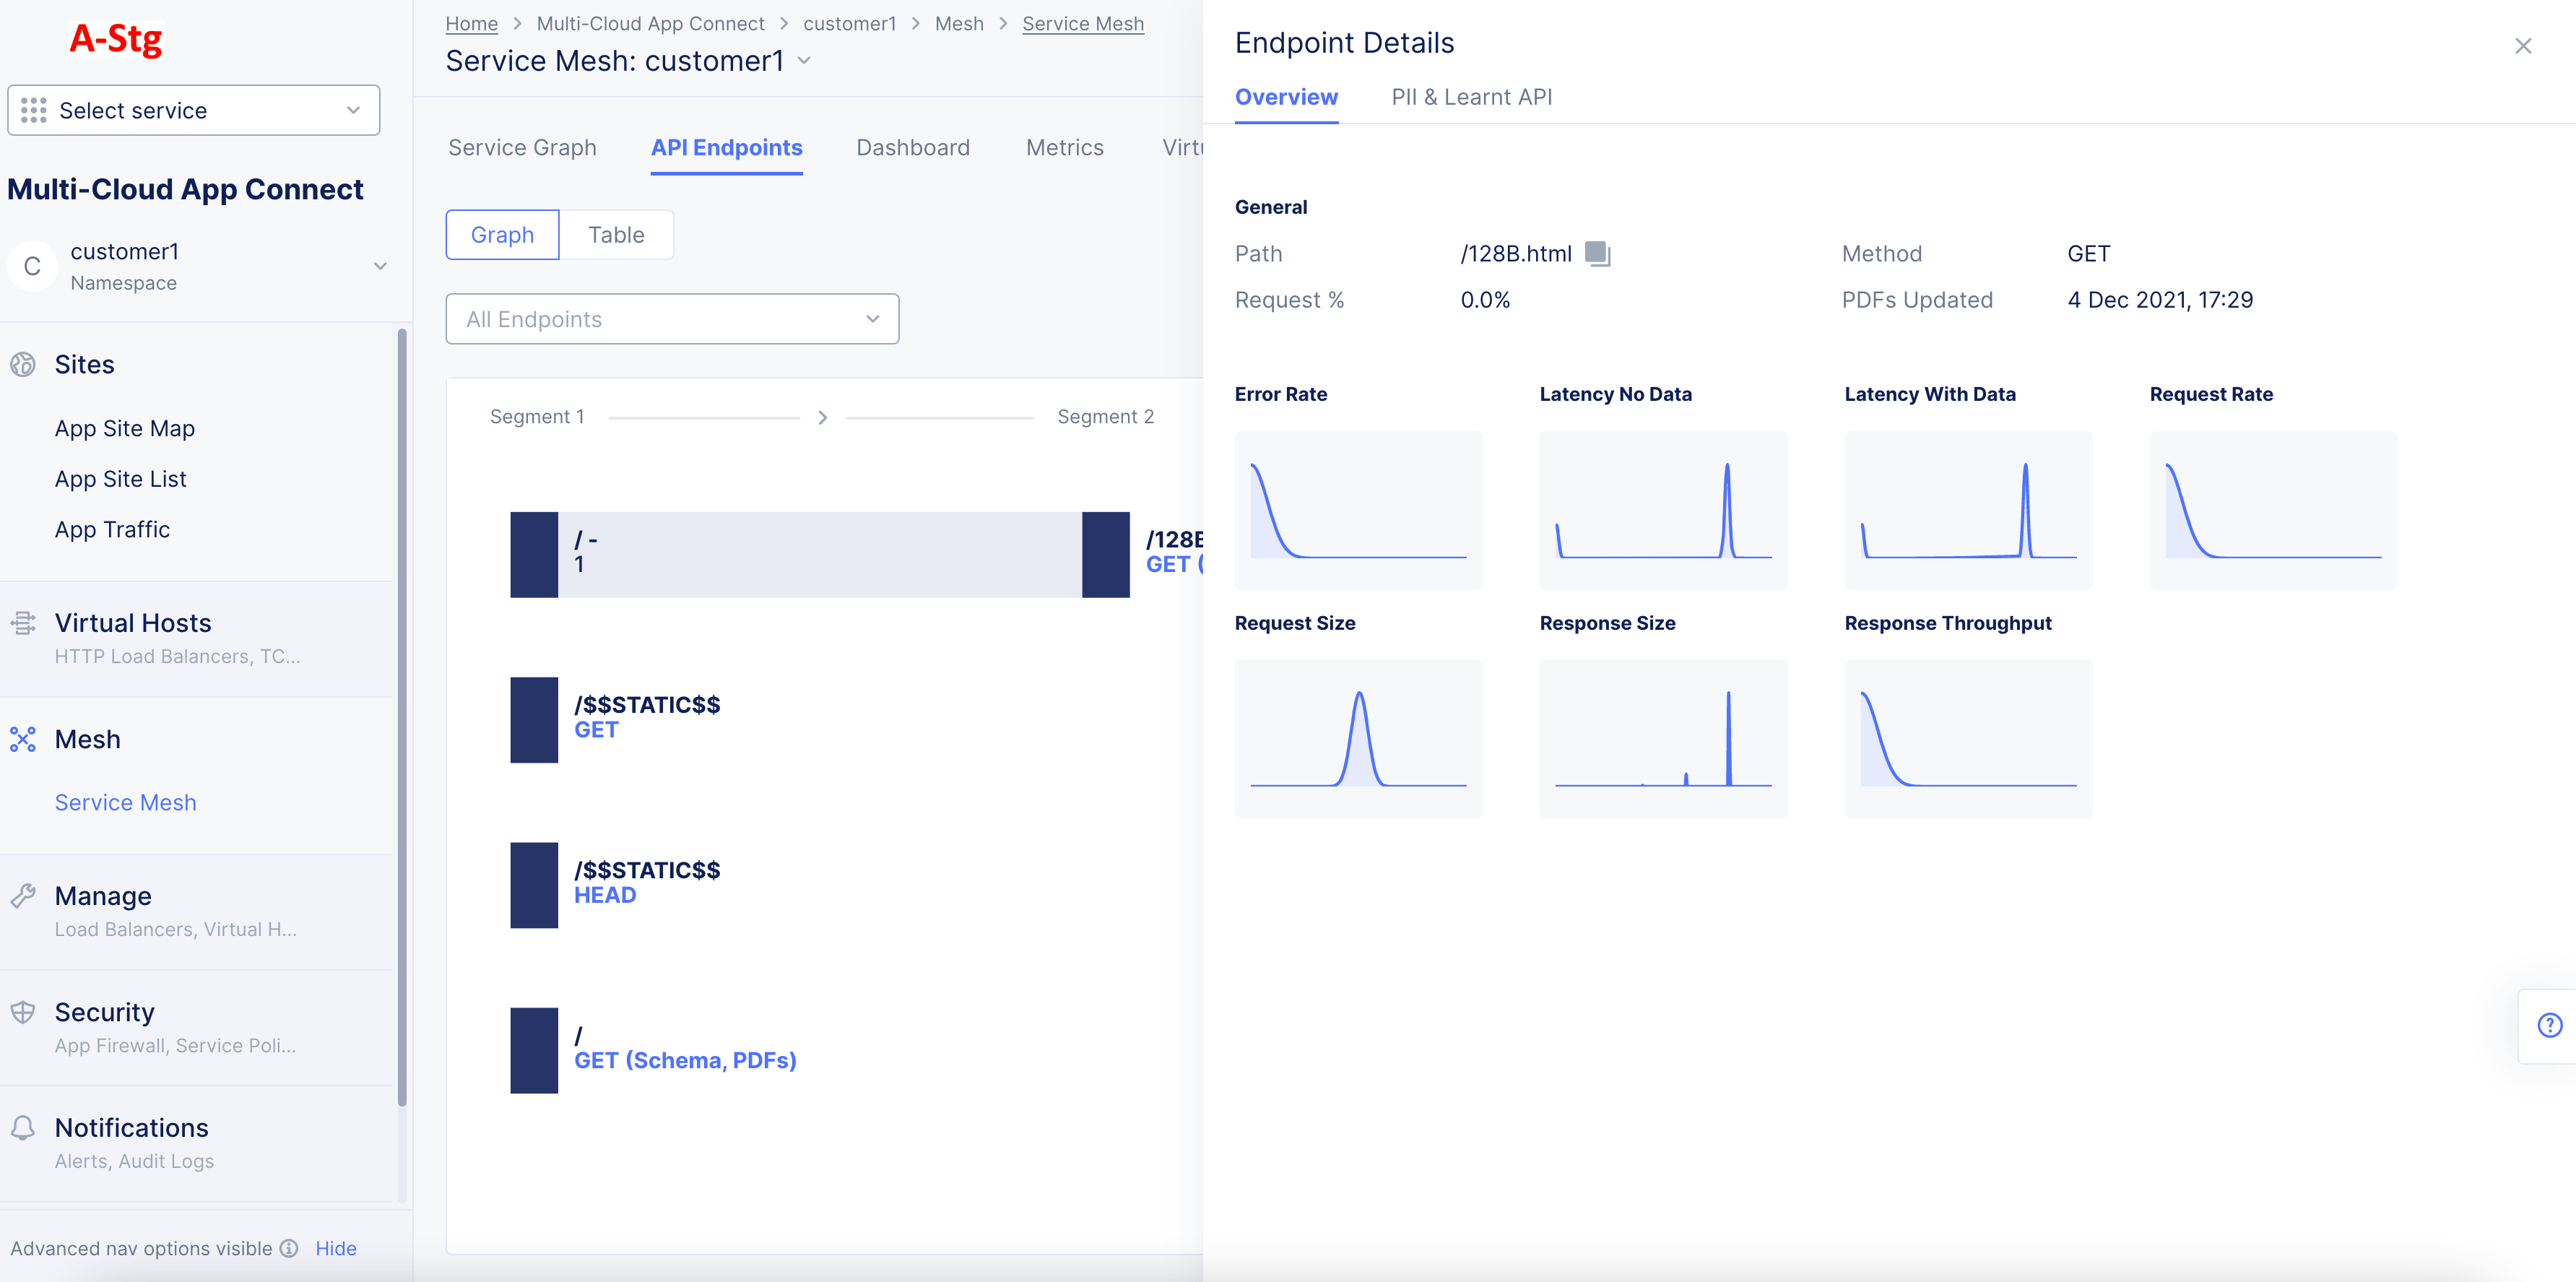
Figure: Quick PDF View from the API Endpoint View
- Hover over any PDF in the quick view to display the PDF percentile and mean values. Select any PDF to display full PDF view for that specific metric.
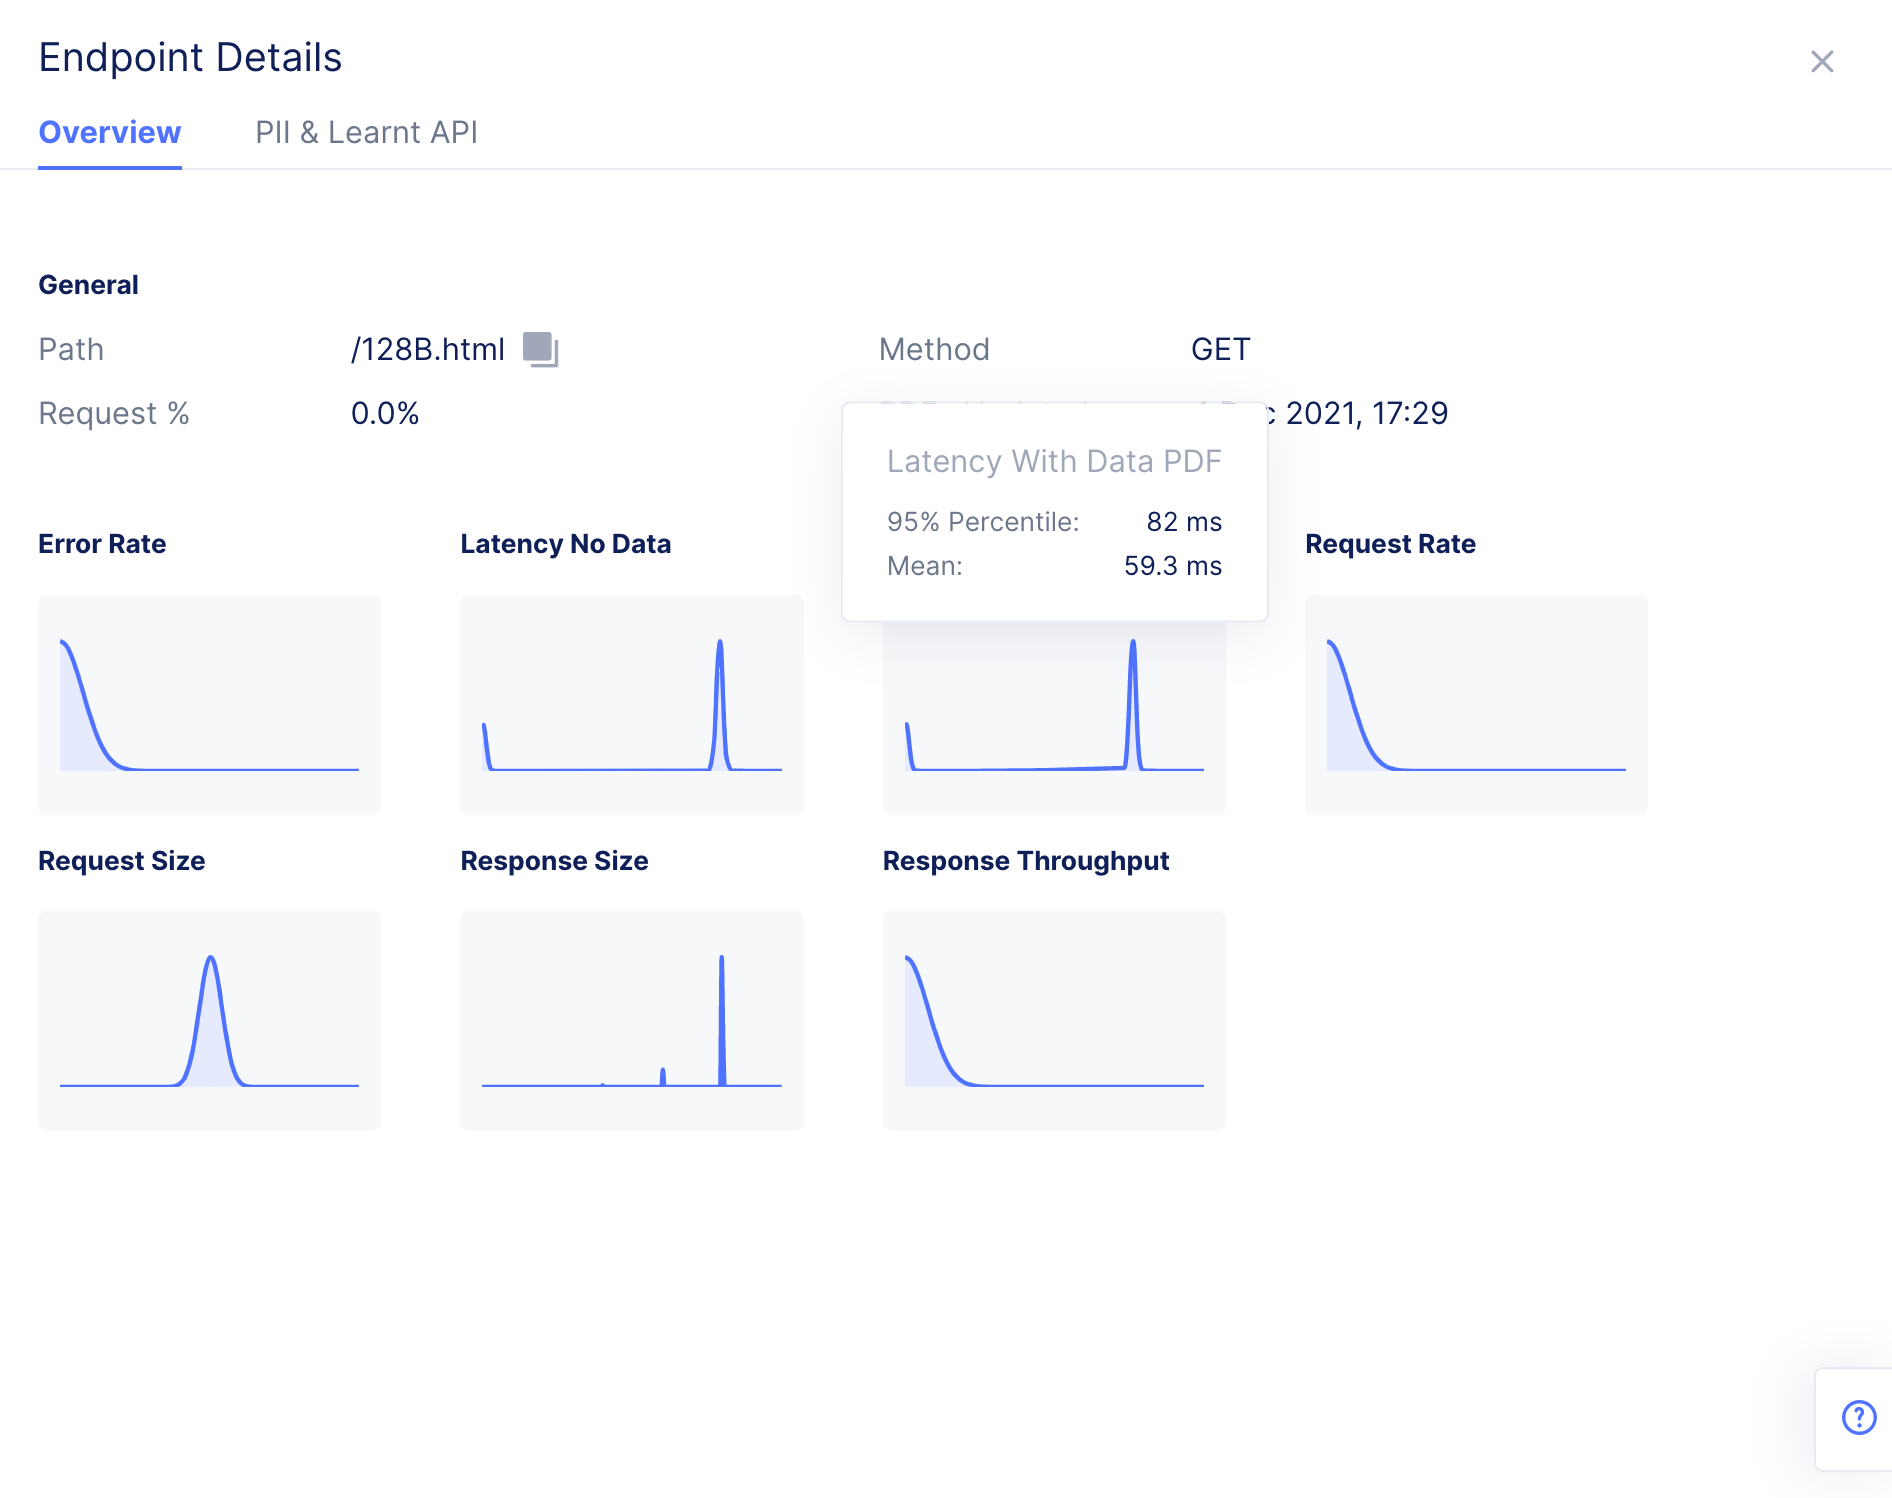
Figure: PDF Information for a Metric in PDF Quick View
-
Select the
PII & Learnt APItab to view the PII information and also learned schema at that API level. -
Select the
Request Body,Headers,Query Parameters, andSwaggertabs to view the respective information related to that API. You can also select theLearnt Schemaoption in case of request body, headers, and query parameters tabs to view the examples in a drop-down menu. Select on an entry to view an example API request.
- Download the Swagger specification for the APIs at the AppType level by selecting the
Download Swaggeroption. You can use the specification with a swagger editor to view the API documentation.
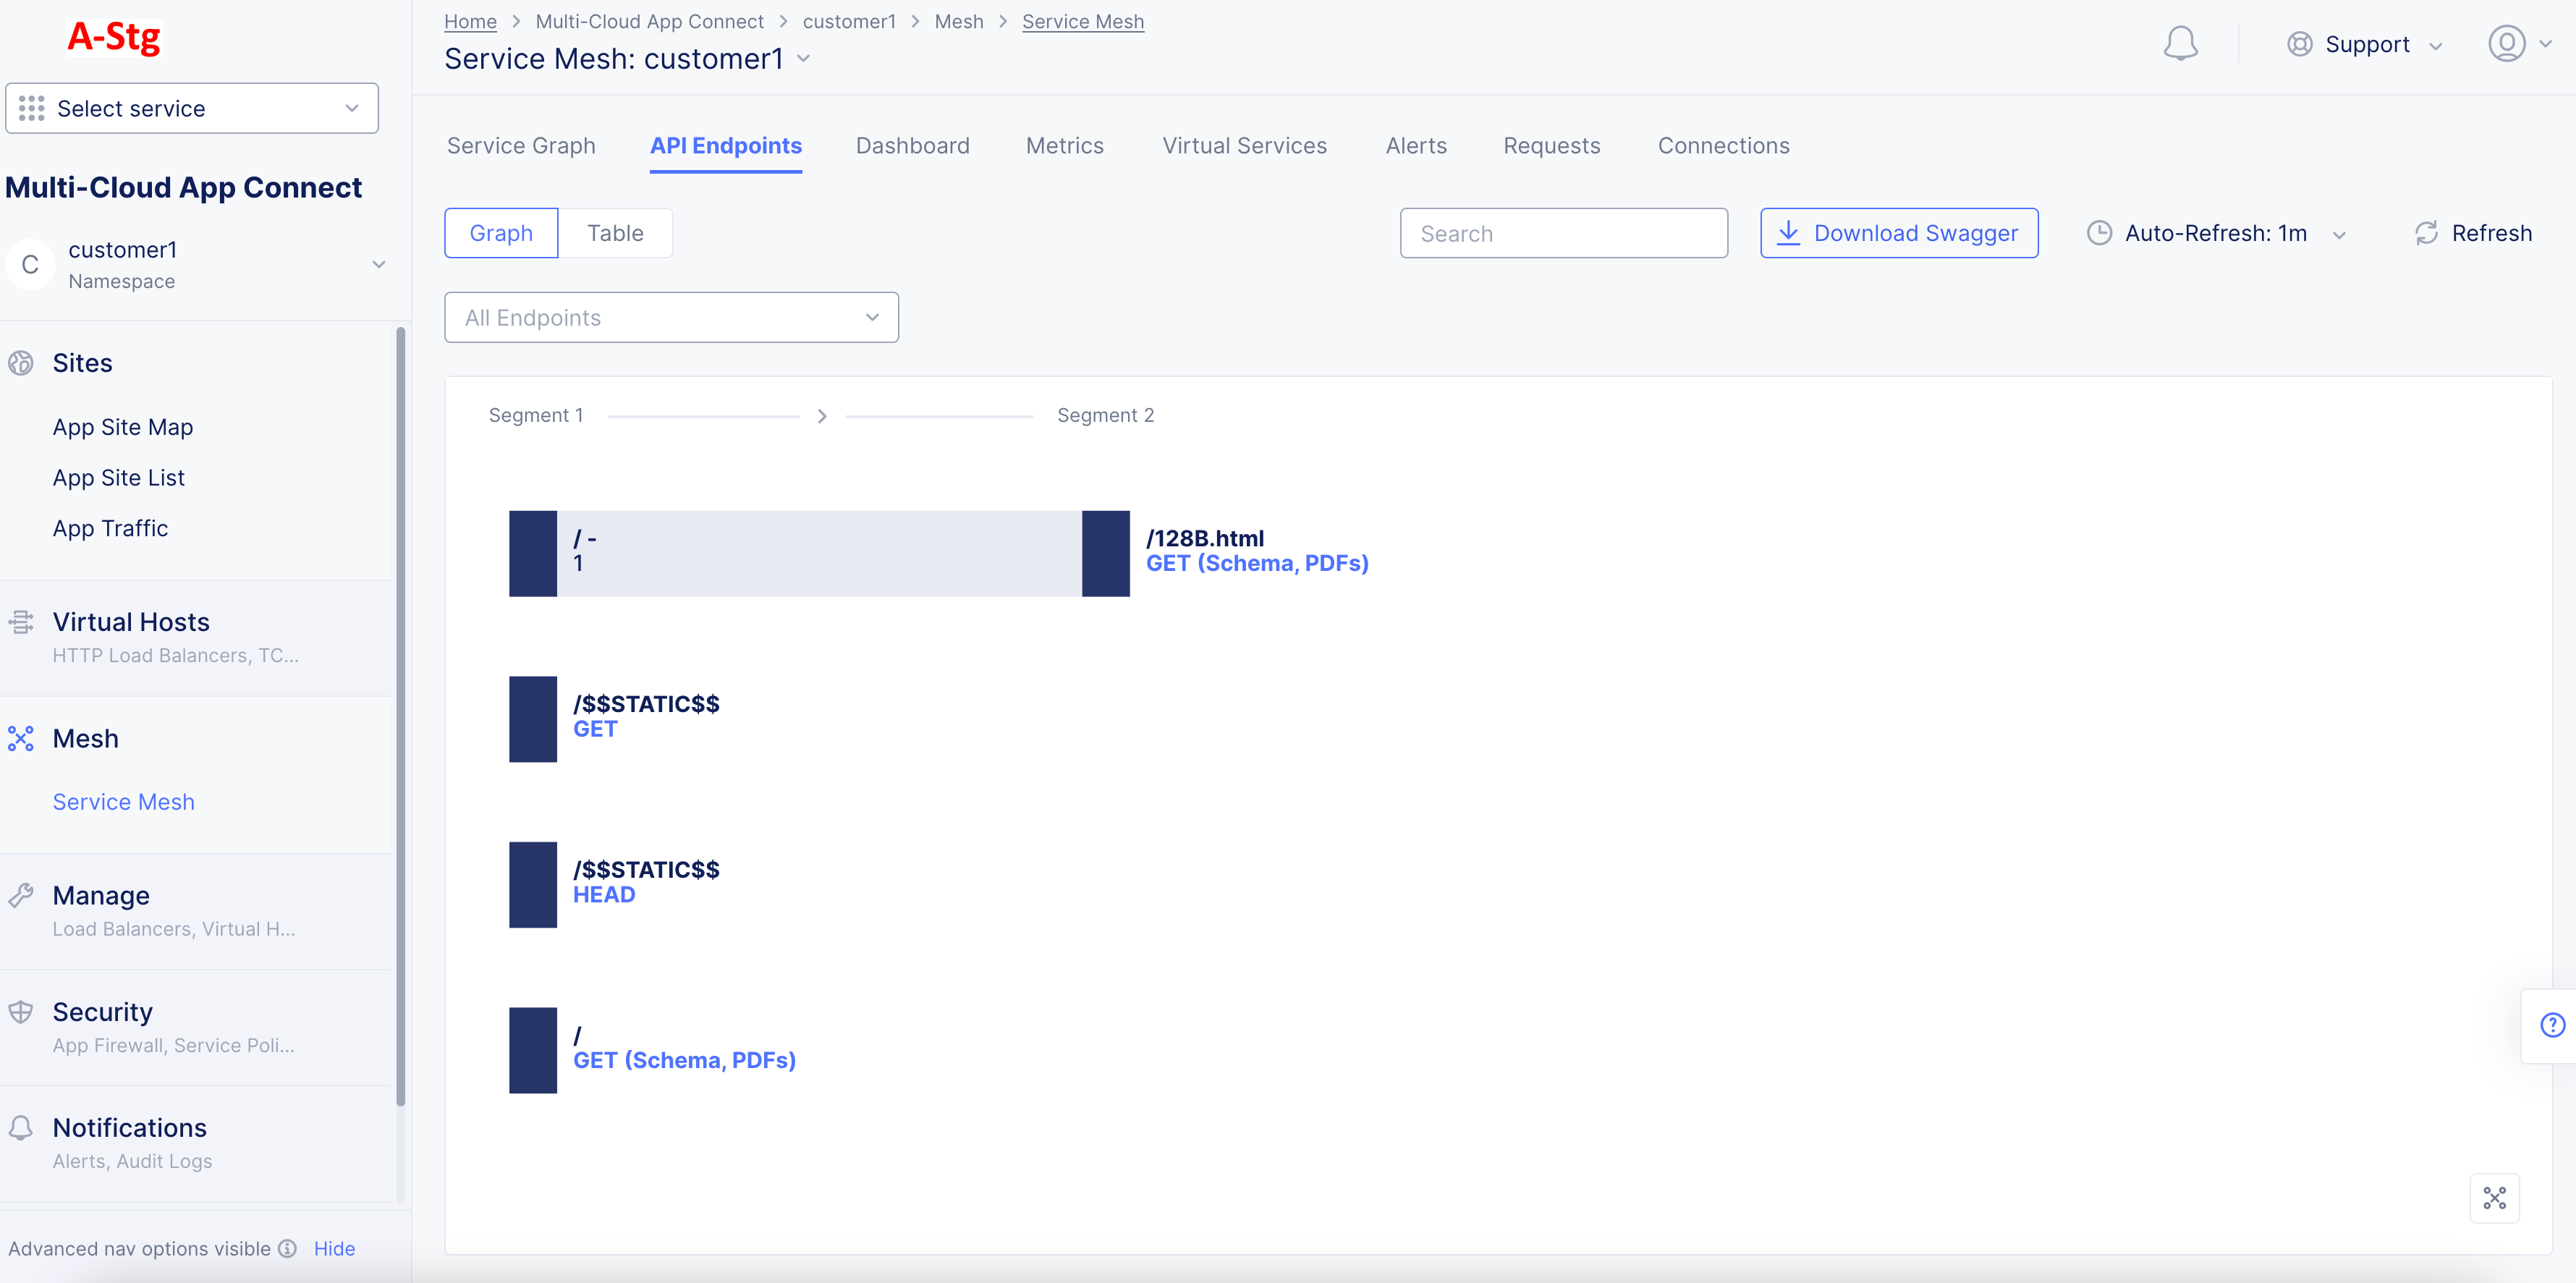
Figure: Download Swagger Spec
Note: You can select the download option next to the
Learnt Schemaoption in theSwaggertab to download the Swagger specification at that API level.
Step 3: Load the PDFs view.
- Select the
Tableoption to display the PDFs view for the API endpoints. This view shows tabular list for all API endpoints and displays the collapsed URLs, PDFs for metrics, and last updated time.
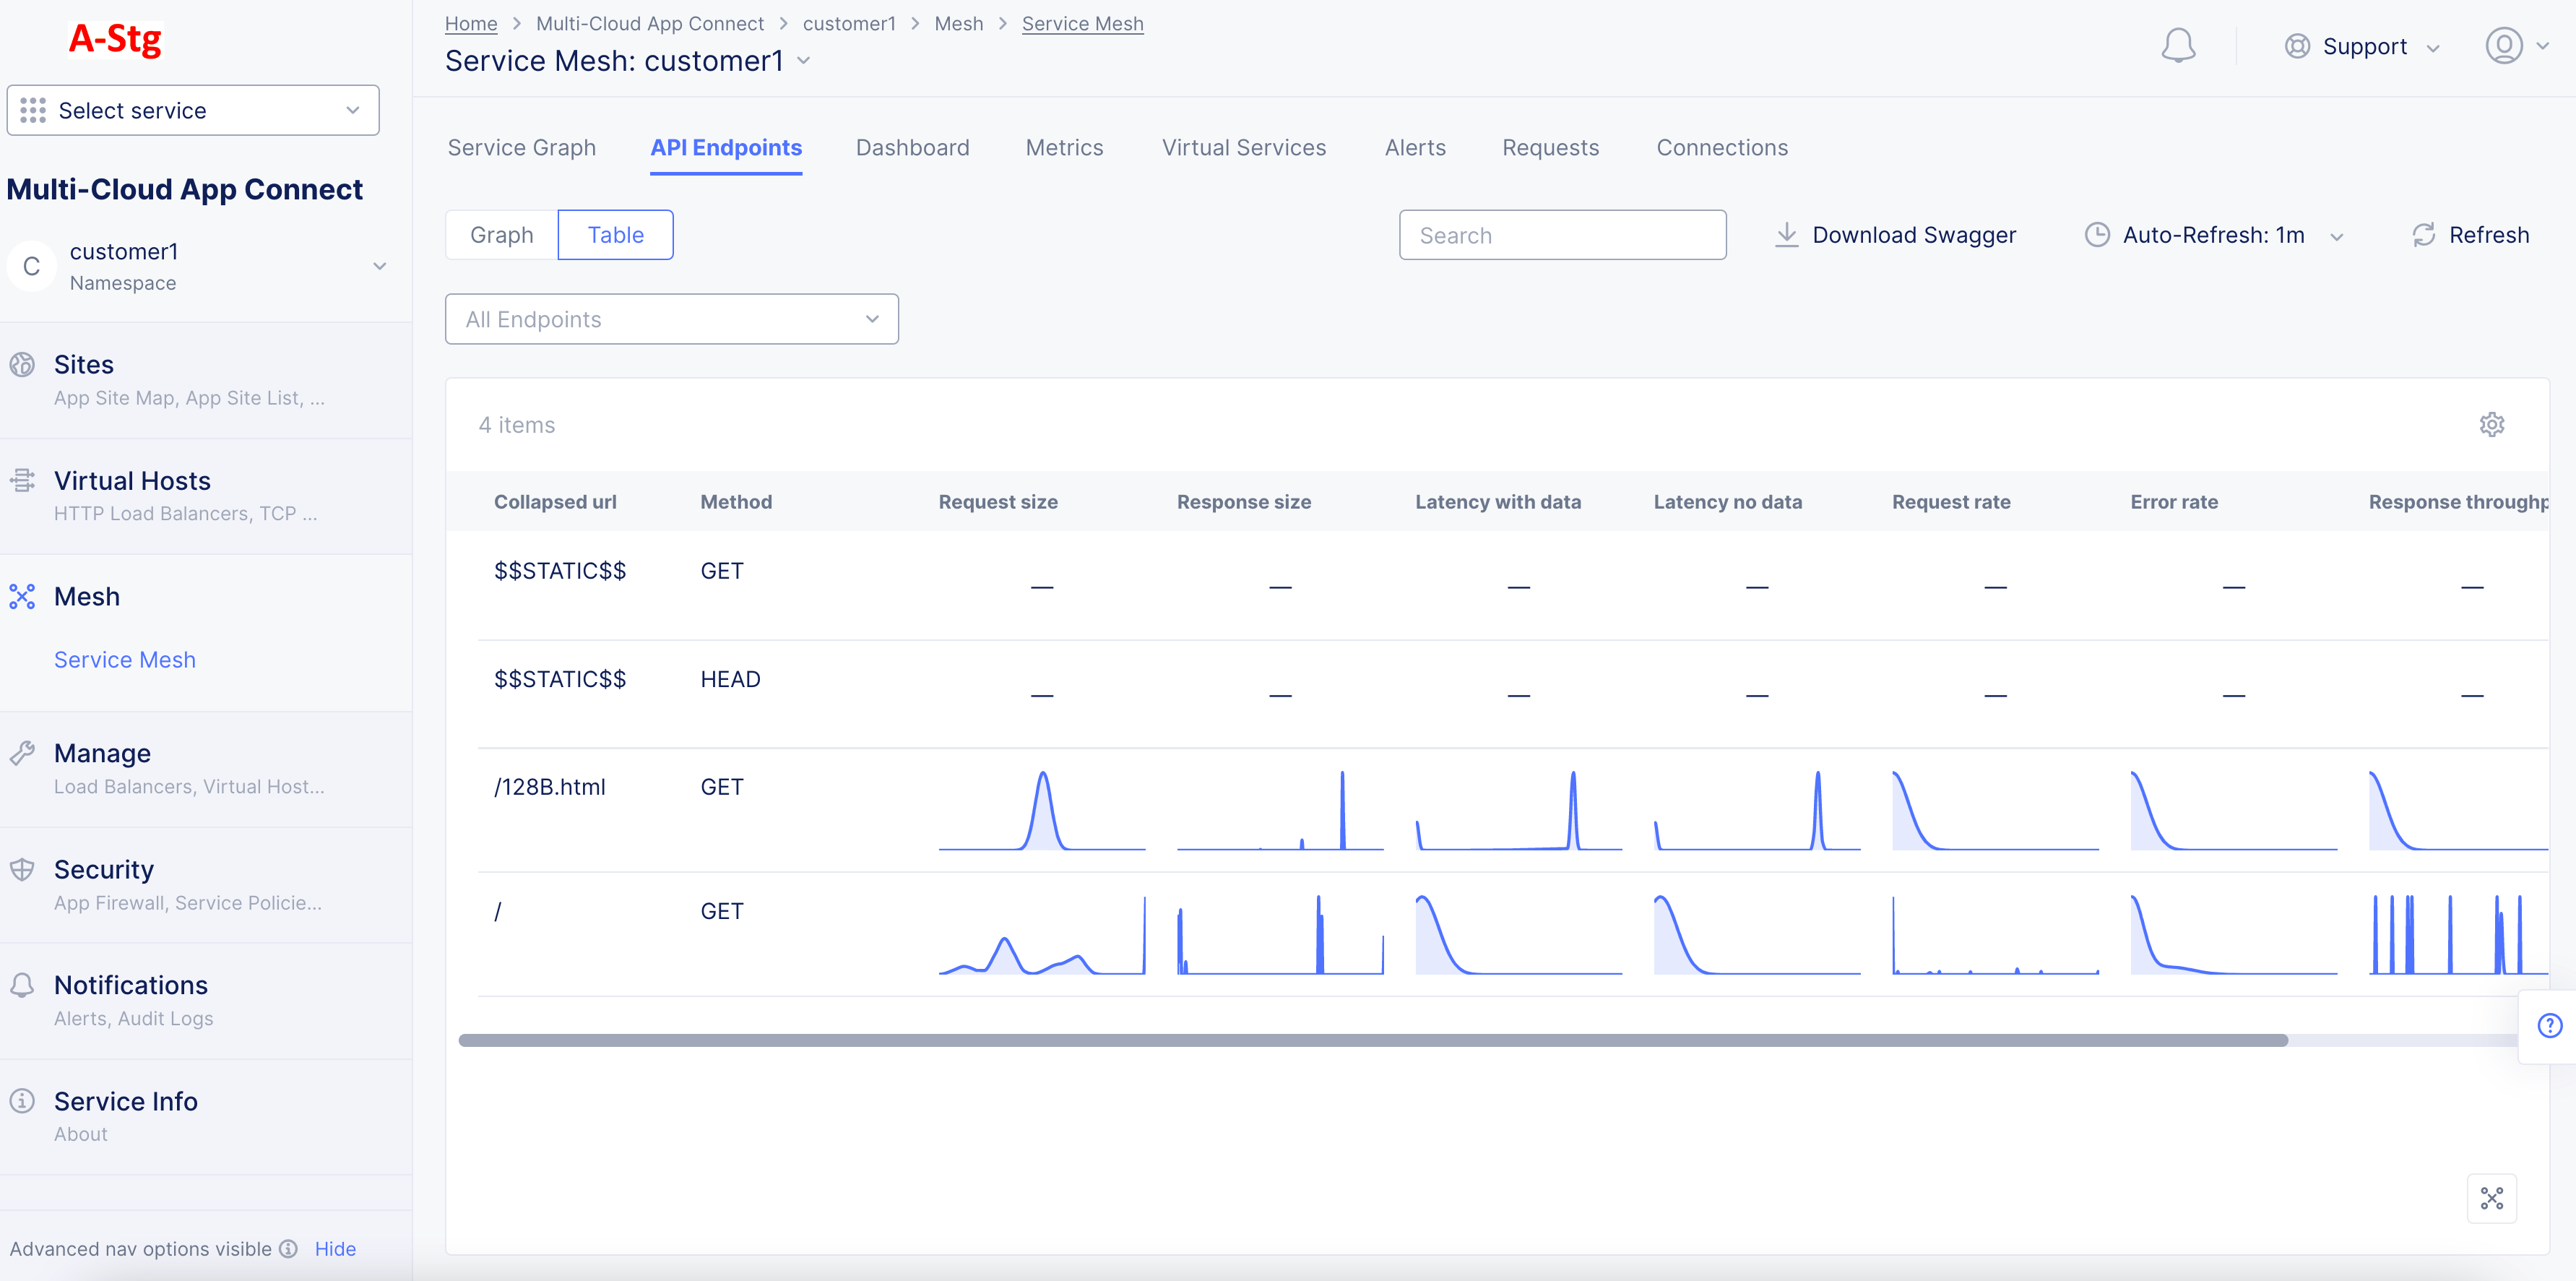
Figure: API Endpoint PDFs Full View
-
Hover over any PDF to display the PDF percentile and mean value for that metric.
-
Select any PDF to display that specific PDF's full view in graph format.
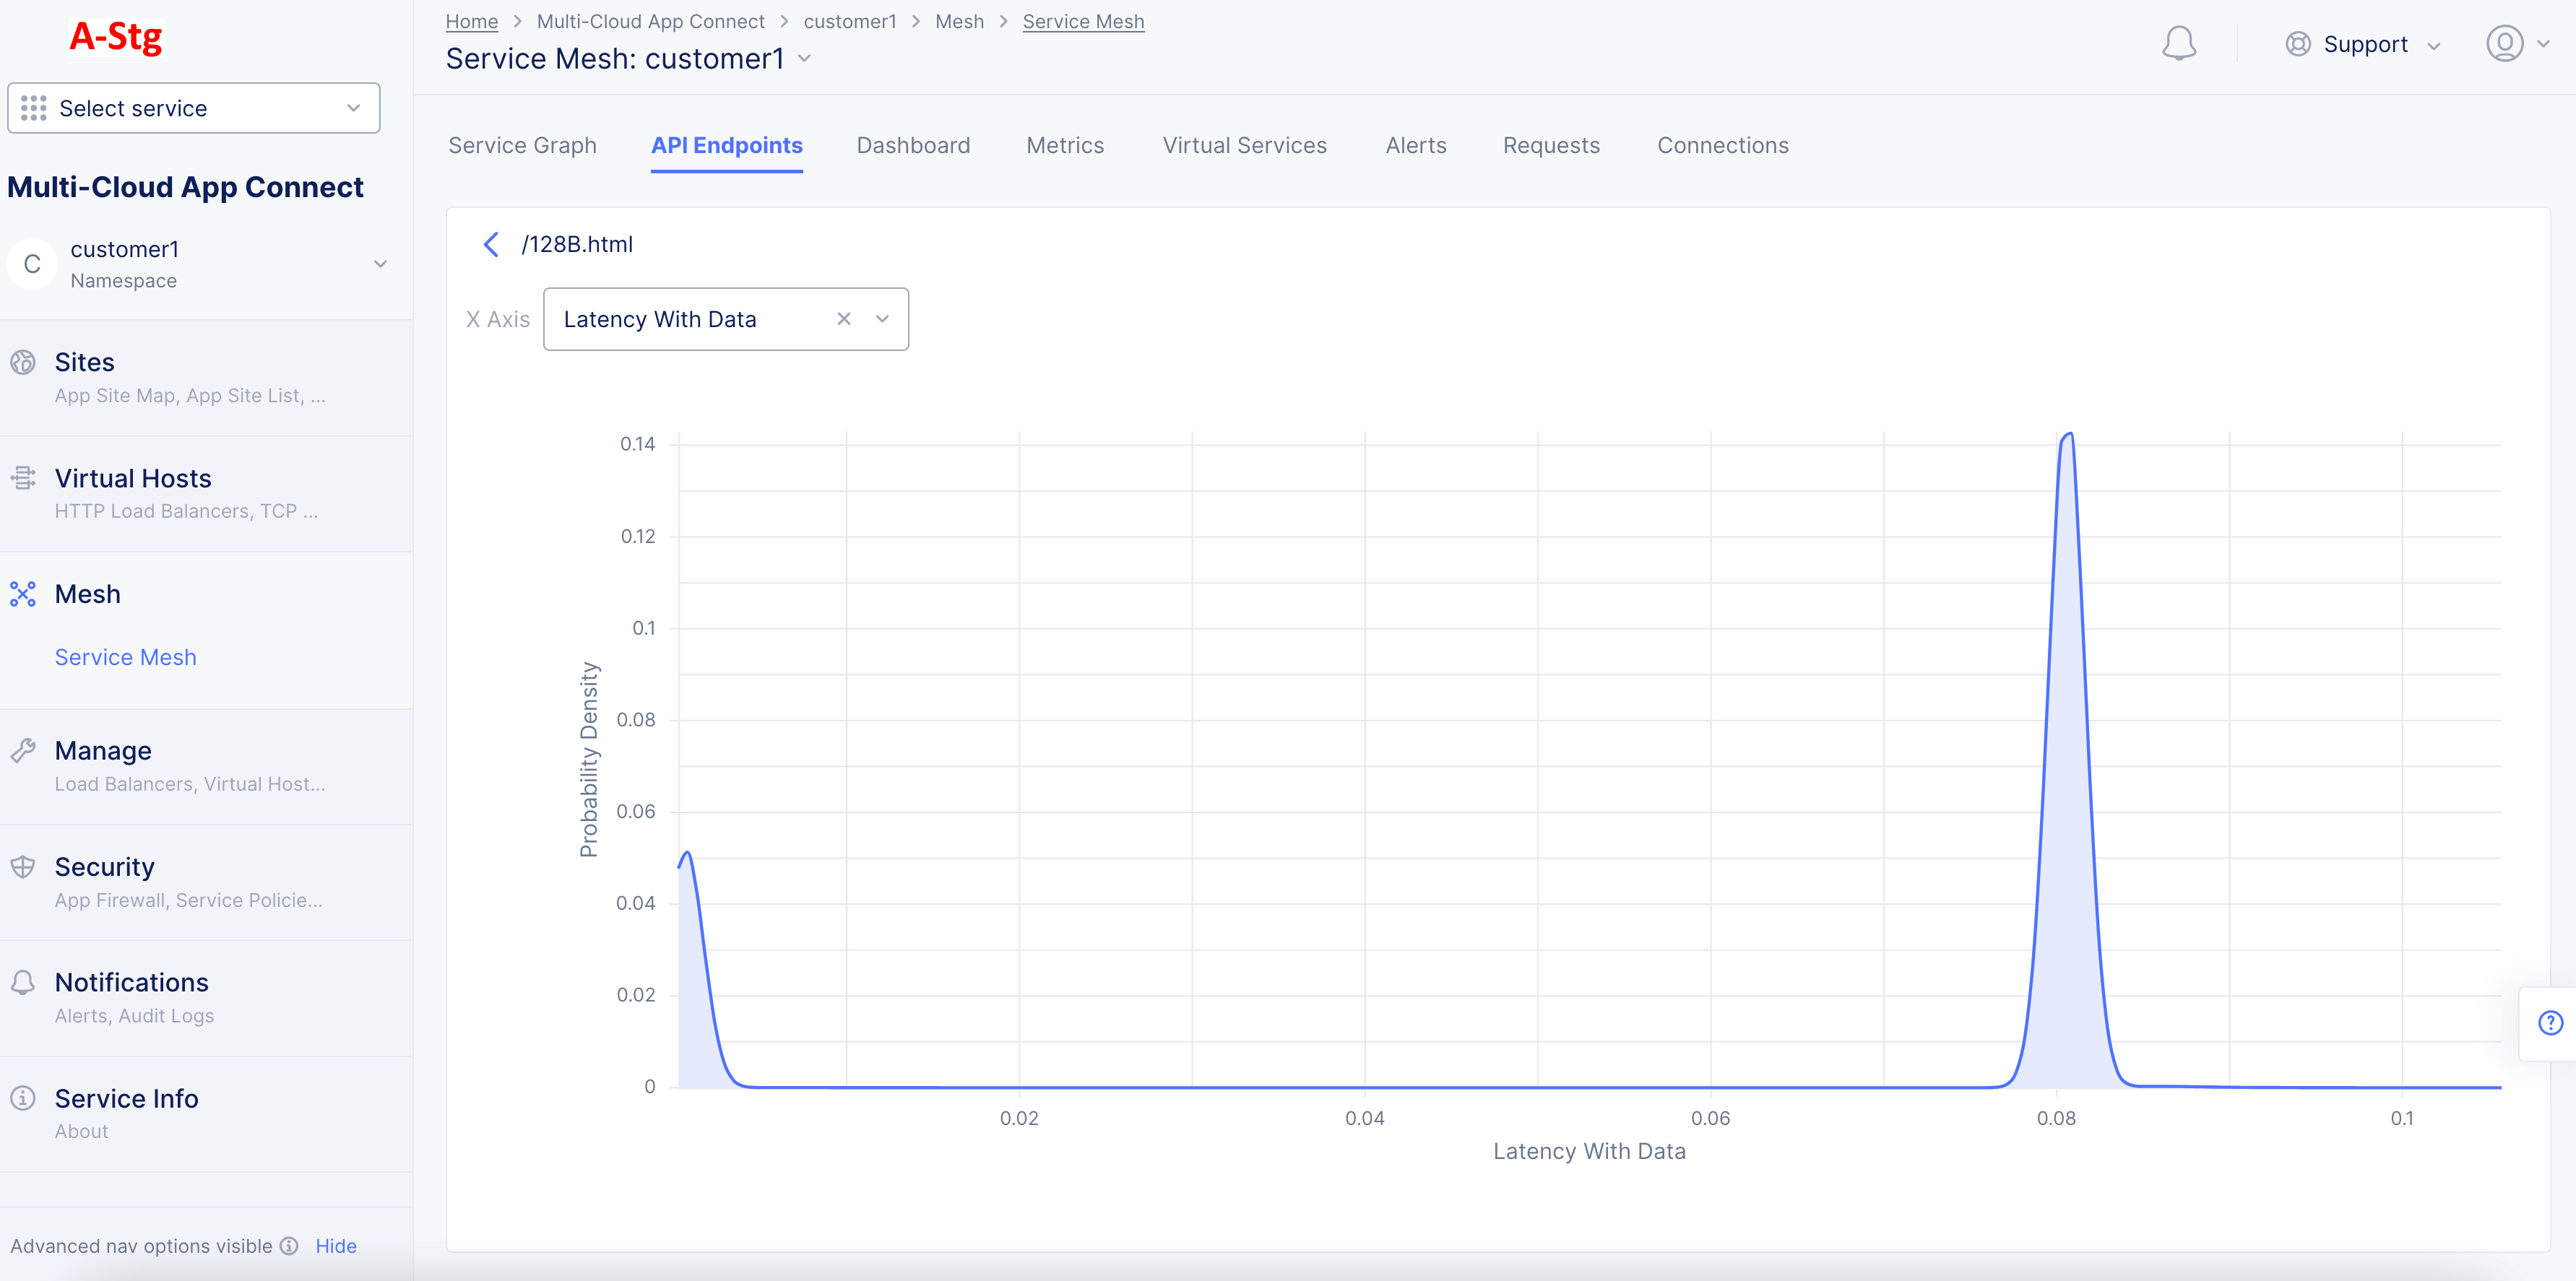
Figure: Detailed PDF View for a Specific Metric
Note: The X-axis represents the metric value and Y-axis represents the probability density.
- Hover anywhere on the PDF graph to display the probability density for a given metric value. You can also change the metric using the
X Axisdrop-down menu.
Note: In case the learning model does not get enough data for an API, it displays blank entries for the PDFs for that API and displays a message on the tool tip mentioning that not enough data is available. After APIs are learned, one can download the Swagger JSON file, edit it if needed and import. Imported Swagger files define API Inventory and groups, which can be used to create API protection rules.
Concepts
API References
On this page:
- Objective
- Sensitive Data
- API Endpoint Learning
- API Schema Learning
- API Attributes Discovery
- API Authentication Discovery
- JSON Web Token Discovery
- Endpoint Vulnerabilities and Remediation
- Prerequisites
- Simple Method
- Advanced Method
- Create App Type Label
- Assign App Type Label to Load Balancers
- Monitor API Endpoints and PDFs
- Load Balancer Monitoring
- Service Mesh Monitoring
- Concepts
- API References