AI Assistant for WAAP
Objective
This document discusses how artificial intelligence (AI) is used to support and enhance the Web App & API Protection (WAAP) workspace.
F5® Distributed Cloud Services provides the WAAP workspace to help you mitigate application threats and vulnerabilities across multi-cloud and edge environments. WAAP provides a number of security related features including a web application firewall (WAF), DDoS mitigation, bot defense, API security, and client-side defense.
Currently, AI is used to help you understand certain security related incidents through the AI Assistant. Using the WAAP UI, you can ask the AI Assistant to explain something, and it will look into the issue and provide an analysis, possible follow-up actions, and more details on the incident.
You can also ask the AI Assistant questions that get more information or other information. This includes the ability to handle Distributed Cloud Services documentation queries, reference relevant materials for follow-ups, and utilize session context to enable seamless, ongoing conversations. You can also constrain you queries to specific time frames:
- Supported timeframes: Today, Yesterday, Between two dates, and more.
- Supported timestamp formats: ISO 8601, UTC Zulu, SQL Datetime, Common Log Format, RFC 2822, and others.
- Outputs are standardized in ISO 8601 Format (
YYYY-MM-DDTHH:MM:SS).
Prerequisites
A Distributed Cloud Services Account. If you do not have an account, see Getting Started with Console.
Invoke the AI Assistant

Figure: AI Assistant Orb
-
Log into the Console and notice the multi-colored orb in the upper right.
-
Click the AI Assistant orb to display the AI Assistant window.
-
Using the three buttons in the upper right, you can:
- Dock or undock the AI Assistant.
- Switch between large and small AI Assistant windows.
- Hide the AI Assistant.
The AI Assistant will remember your choices and use them for the next invocation.
The AI Assistant will also be displayed.
Explain a Security Event or Incident
Security events are shown on the Security Overview page under Security Analytics.
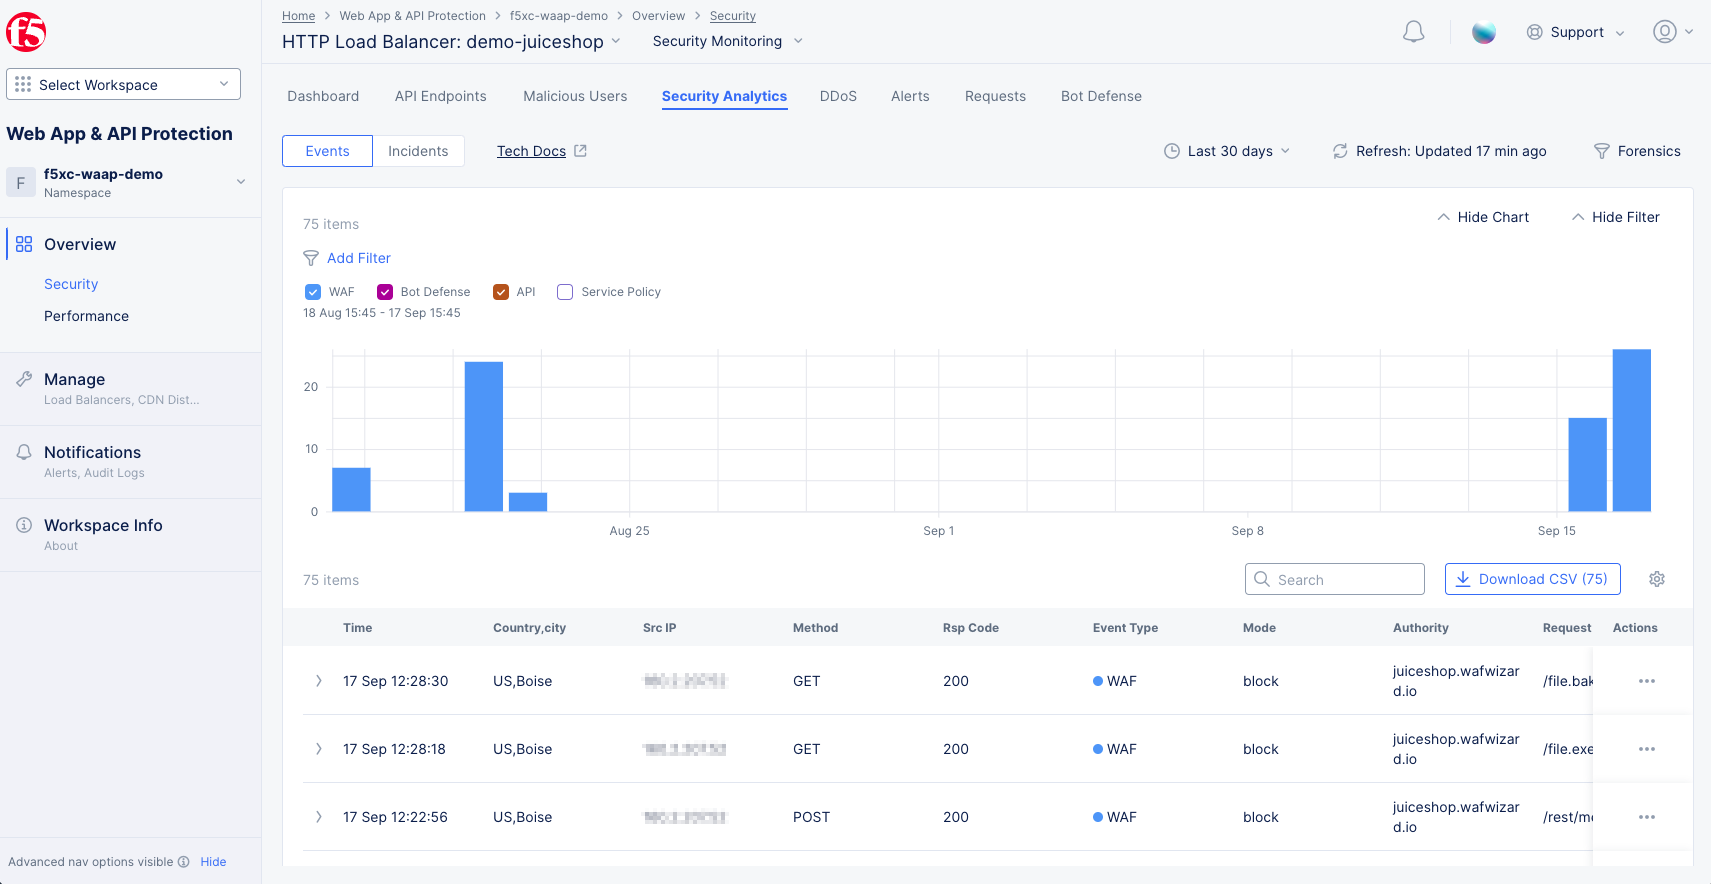
Figure: Security Analytics Page
Explain a Security Event.
-
Log into the Console and Select the
Web App & API Protectionworkspace. -
Select your namespace from the
Namespacedrop-down menu in the left pane. -
In the
Delivery Resourceswidget at the bottom of the page, click a delivery resource name to view its specific security overview page. -
Select the
Security Analyticstab. -
Set the
Events | Incidentsselector above the graph toEvents. -
Find the event you want to analyze in the events list at the bottom of the page. You may find it helpful to change the time period above the graph on the right.
-
For the event in question, click
...>Explain with AIin theActioncolumn.

Figure: Security Analytics Event AI Assistant Explanation
-
You are now using the AI assistant, and it is showing the results of your implied question. It first provides an overview of the event, followed by an analysis, and then suggested follow-up actions.
-
You can click
Detection Detailsfor more information.
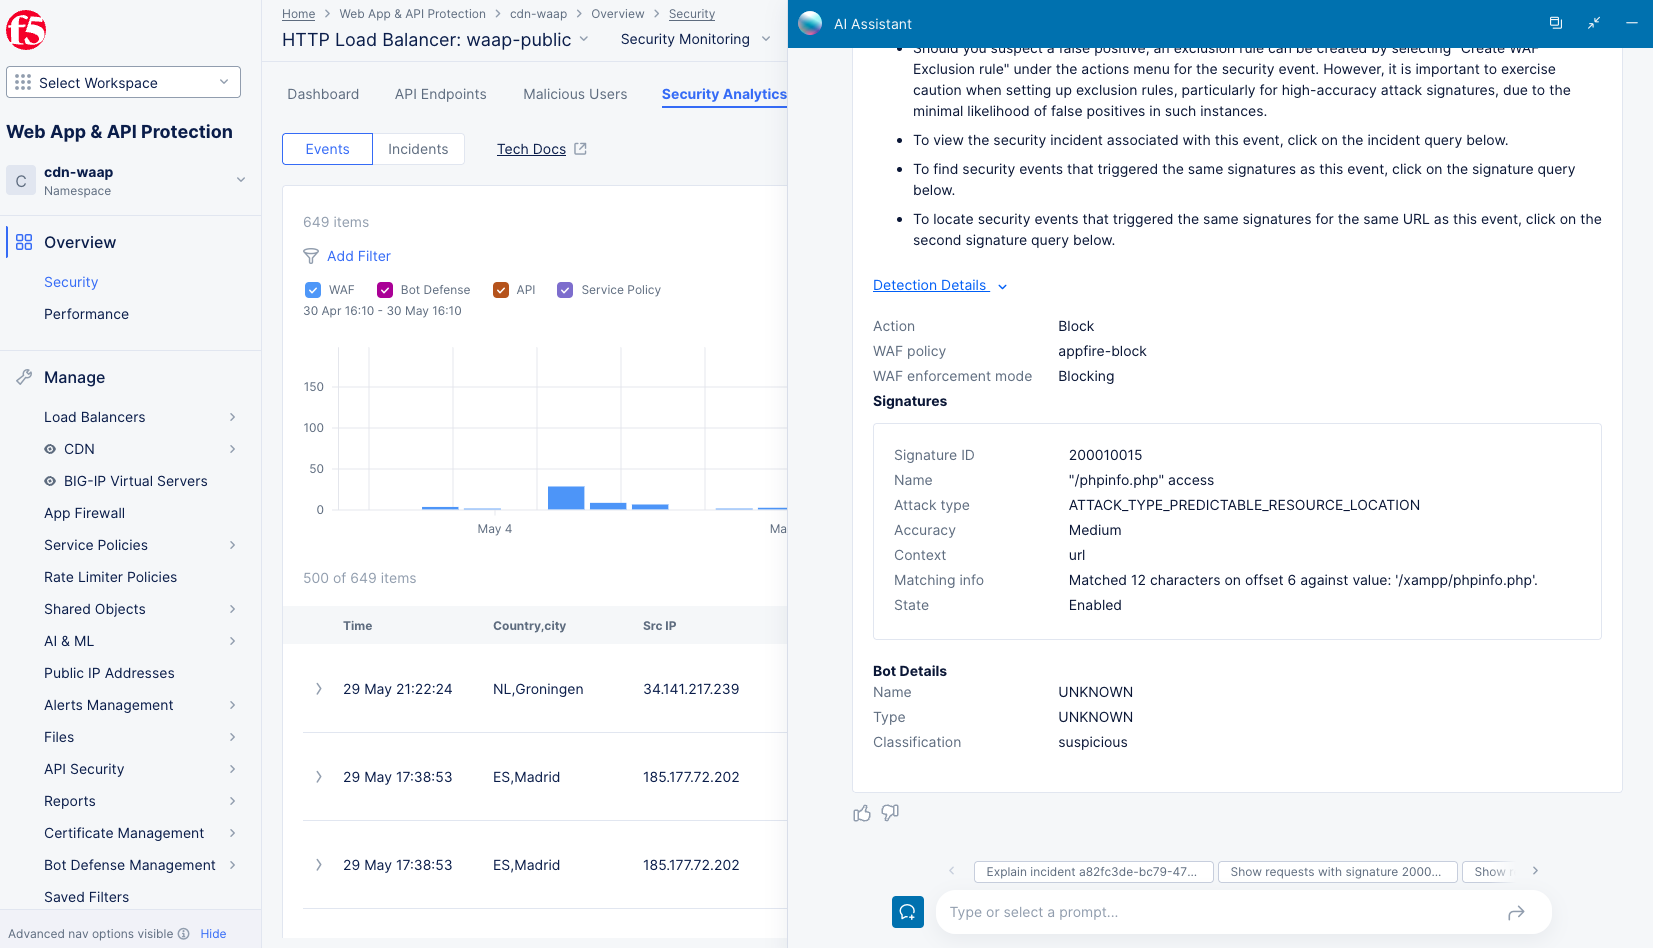
Figure: Security Analytics Event AI Assistant Explanation
-
Depending on the type of event, you may see information, such as:
- TLS Fingerprint: Analyze traffic patterns based on TLS metadata
- Signature IDs (
signatures.id): Identify attacks linked to specific signatures - Request Path (
req_path): Focus on traffic targeting specific resource paths - Country filtering now supports country codes in addition to country names
Explain a Security Incident.
-
Log into the Console and Select the
Web App & API Protectionworkspace. -
Select your namespace from the
Namespacedrop-down menu in the left pane. -
In the
Delivery Resourceswidget at the bottom of the page, click a delivery resource name to view its specific security overview page. -
Select the
Security Analyticstab. -
Set the
Events | Incidentsselector above the graph toIncidents.

Figure: Security Analytics Incidents Tab
-
Find the event you want to analyze in the incidents list at the bottom of the page. You may find it helpful to change the time period above the list on the right.
-
For the incident in question, click the AI Assistant orb in the
Actioncolumn.

Figure: Security Analytics Incident AI Assistant Explanation
-
You are now using the AI assistant, and it is showing the results of your implied question. It first provides an overview of the event, followed by an analysis, and then suggested follow-up actions.
-
Depending on the type of incident, you may see information, such as:
- Key attributes: Source IP, ASN, Country, and TLS fingerprint
- Incident-specific details such as intent, number of events, attack types, and signature IDs
- Recommends enabling Blocking Mode when it is not already configured
- Shows the attack types if they differ meaningfully from the intent
Explain a Request
Requests are shown on the Performance Overview page under Requests.

Figure: Performance Requests Page
Explain a Request.
-
Log into the Console and select the
Web App & API Protectionworkspace. -
Navigate to
Overview>Performanceand select theRequeststab. -
Find the request you want to analyze in the request list at the bottom of the page. You may find it helpful to change the time period above the graph on the right and/or use the
Searchfield to narrow the list of requests in the table. -
For the request in question, click
...>Explain with AI.
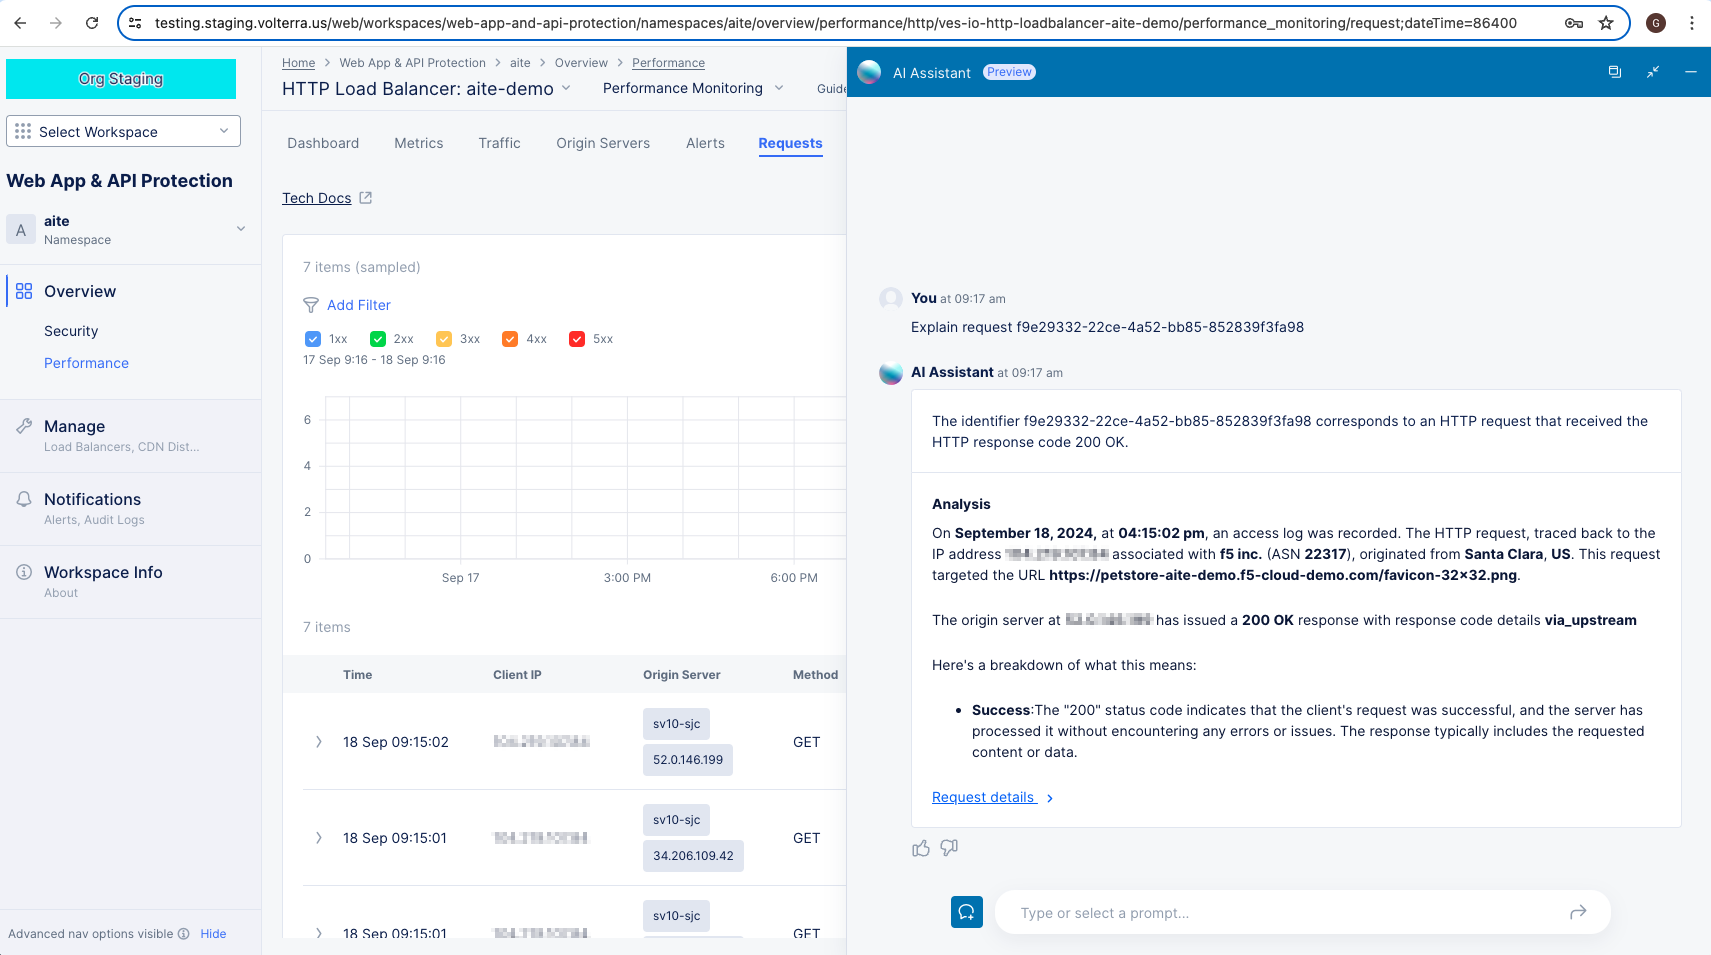
Figure: Performance Requests AI Assistant Explanation
You are now using the AI assistant, and it is showing the results of your implied question.