Create Advanced DNS Synthetic Monitor
Objective
This guide provides instructions on how to create a DNS Synthetic Monitor leveraging many of the more advanced features. These parameters will help you to fine tune your monitors to get the most out of them.
Using the instructions provided in this document, you can create a DNS Synthetic Monitor to validate and alert on the health and performance of your DNS endpoints and records. This how-to guide configures a CNAME monitor, but you may select any record type for your needs.
Configure a DNS Monitor
Step 1: Create a new DNS Monitor.
-
Log into the F5® Distributed Cloud Console.
-
Navigate to either the
Observabilityworkspace tile or menu.
Note: The homepage is role based, and your homepage may look different due to your role customization. Select
All Servicesdrop-down menu to discover all options.
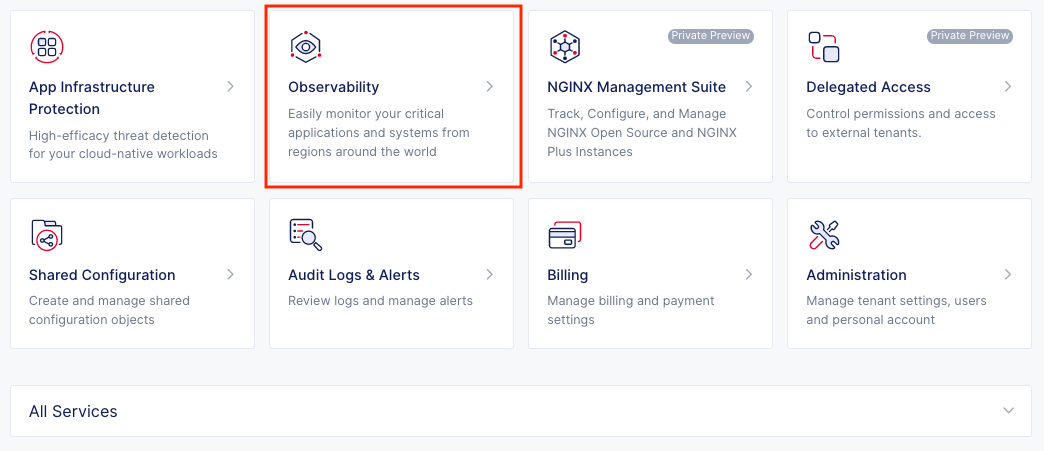
Figure: Observability Tile
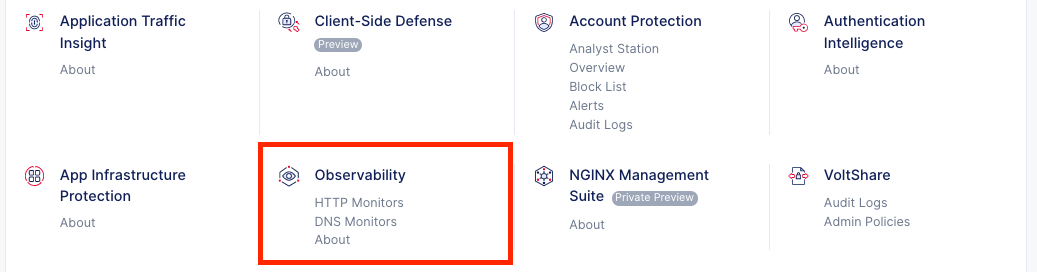
Figure: Observability Menu
- Select
Manage>Synthetic Monitors>DNS Monitors.
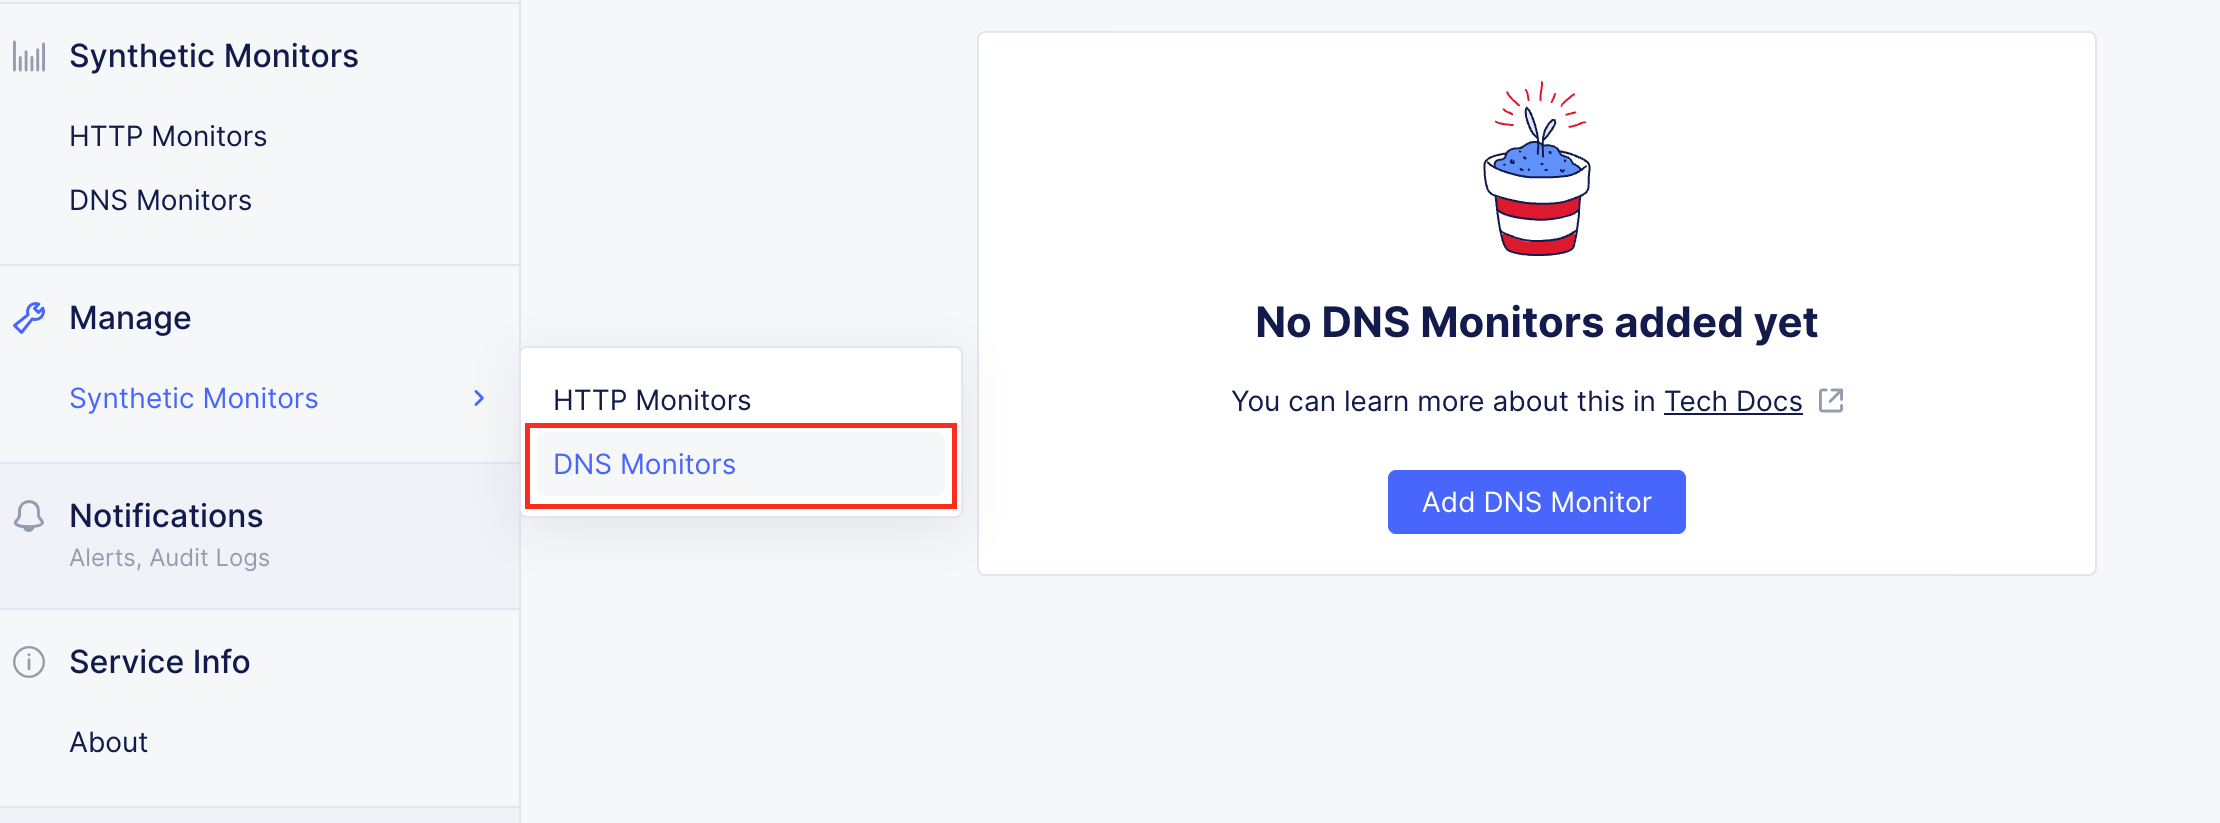
Figure: Manage Menu
- Click
Add DNS Monitor.
Step 2: Configure Metadata.
- Enter
Name,Labels, andDescriptionas needed.
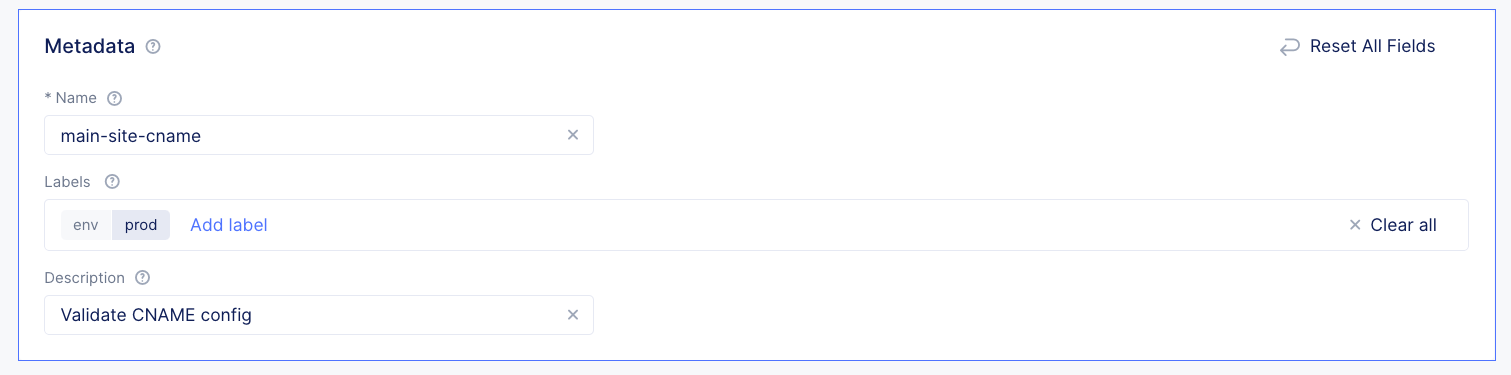
Figure: Metadata
Step 3: Configure the monitor Domain, type, interval, and protocol.
-
Enter the
Domainthat you would like to monitor. -
Select the
Record Typeof the domain you would like to monitor. -
Set the monitor frequency
Intervalfor how often you would like the monitor to run from each source region configured later in the form. -
Adjust the protocol if you are not using UDP.
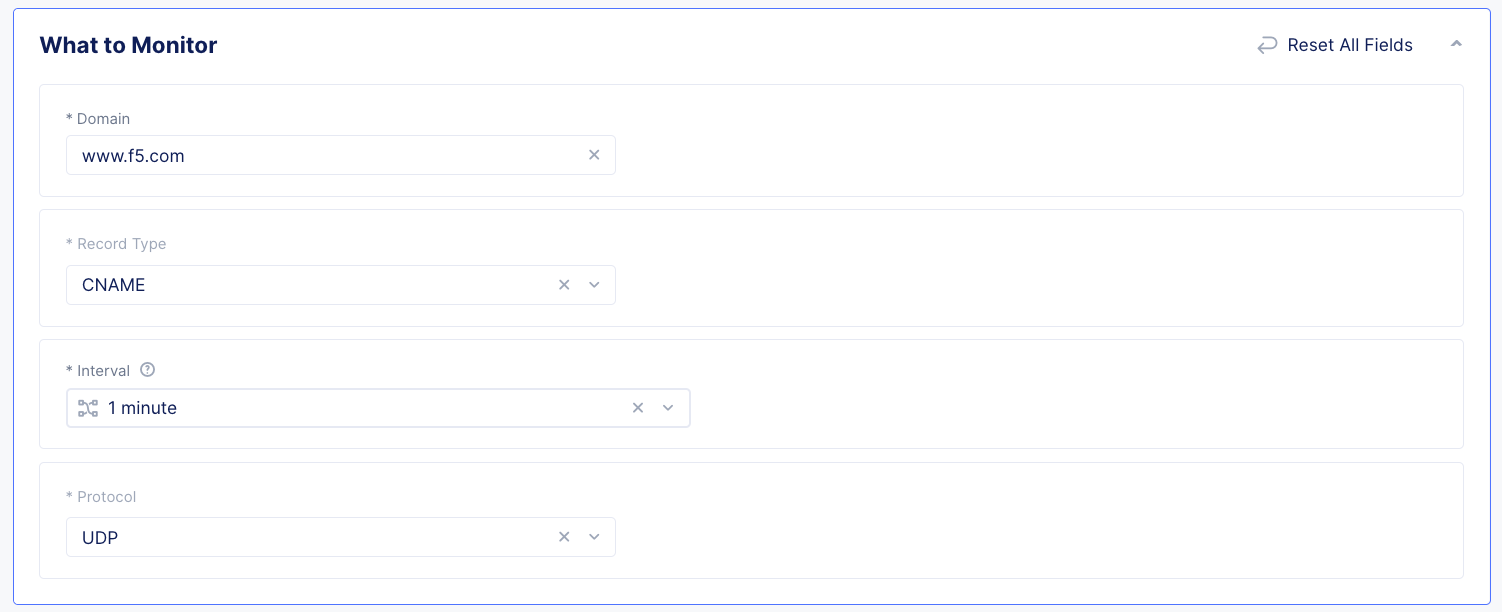
Figure: What to Monitor
Step 4: Configure where to monitor from.
Note: Each source
providerandregionadded will monitor the endpoint configured for the monitor. The combined health from all regions will generate the overall monitorsglobalhealth.
- In the
Sourcessection, clickAdd Itemto begin adding sources for the monitor.
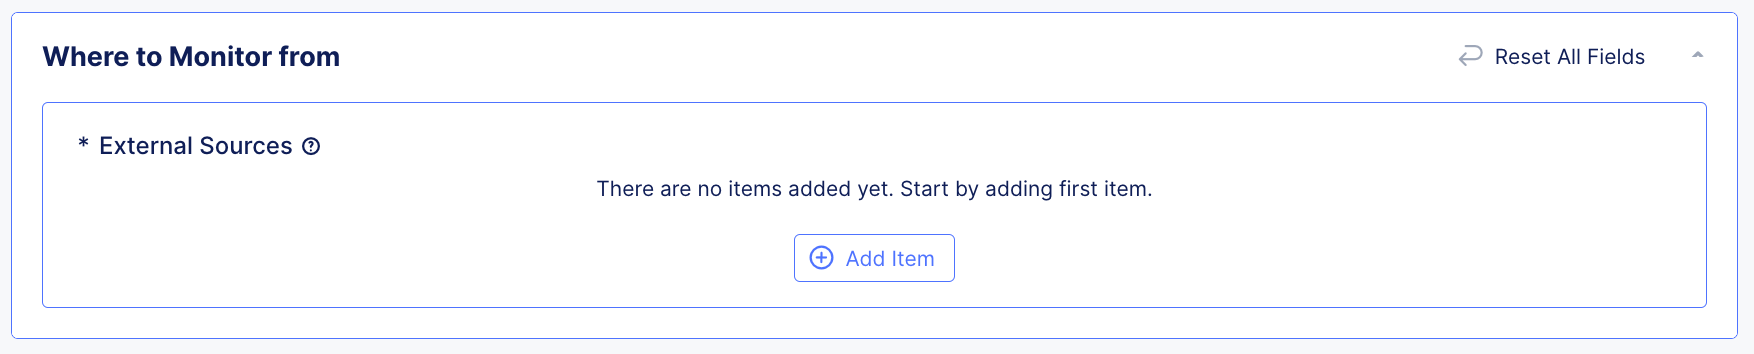
Figure: Empty Sources
-
Select the desired
Providerfor which you would like to source the monitor from. -
With the
Providerselected, click theRegionsdropdown and select whichRegionyou would like the monitor run from. -
Select additional regions from the dropdown if you would like to add more
Regionsfor the currentProvider.
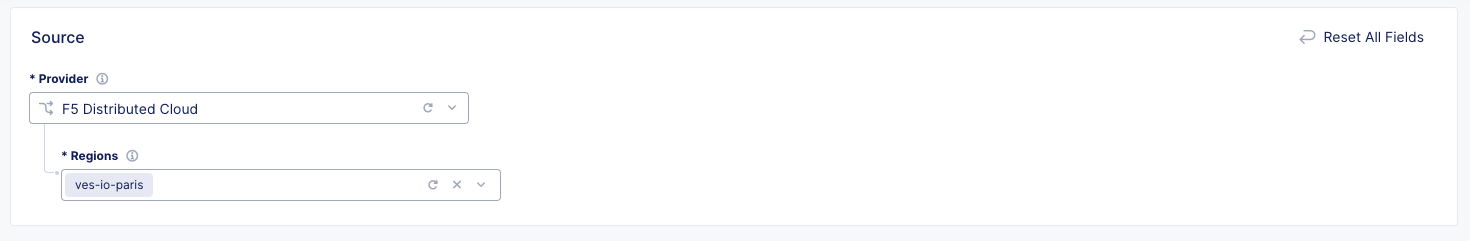
Figure: Provider Regions
-
Click
Applyto add the currentProviderandRegionsto the monitor. -
Back in the primary
Sourcessection, selectAdd Itemand follow the steps above if you would like to add additionalProvidersandRegions.
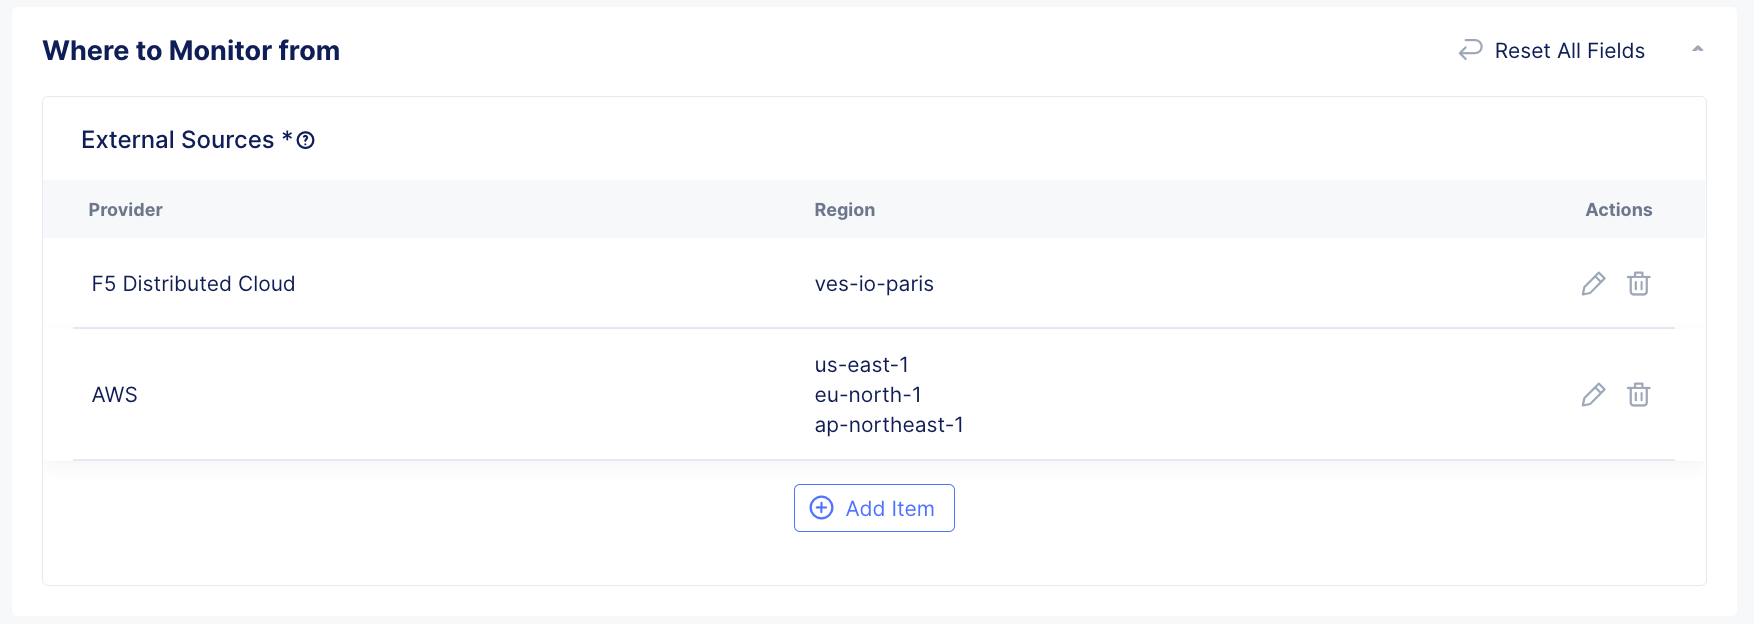
Figure: Sources
Step 5: Configure how to monitor.
Note: Custom nameservers are optional, and the monitor will use its default nameservers for validation by default. Each configured
Regionwill monitor each nameserver configured here.
- Click
Add ItemonCustom Name Serversto add a specific nameserver you would like checked by the monitor.
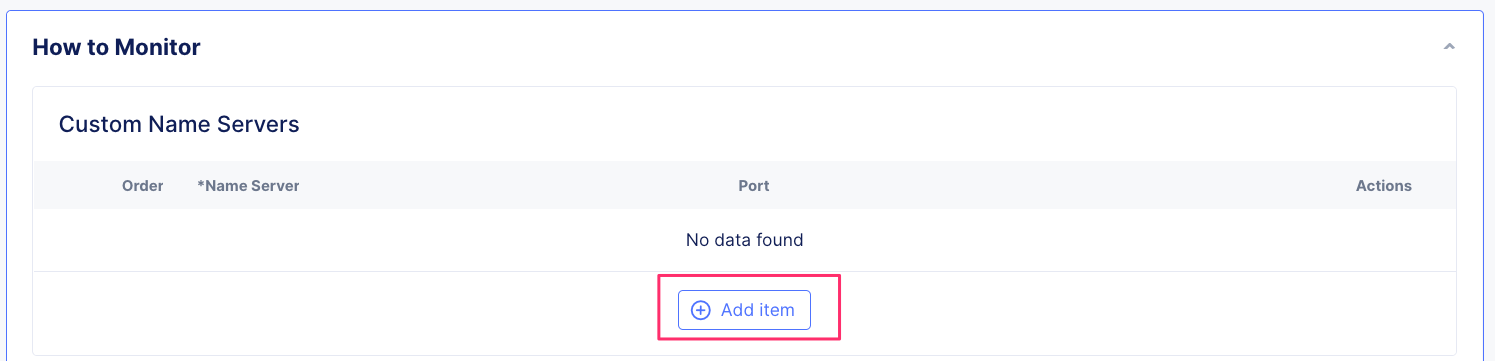
Figure: Add Nameserver
- Fill in the
Name ServerIP andPortto match your desired DNS infrastructure. You can clickAdd Itemagain if you require additional nameservers.
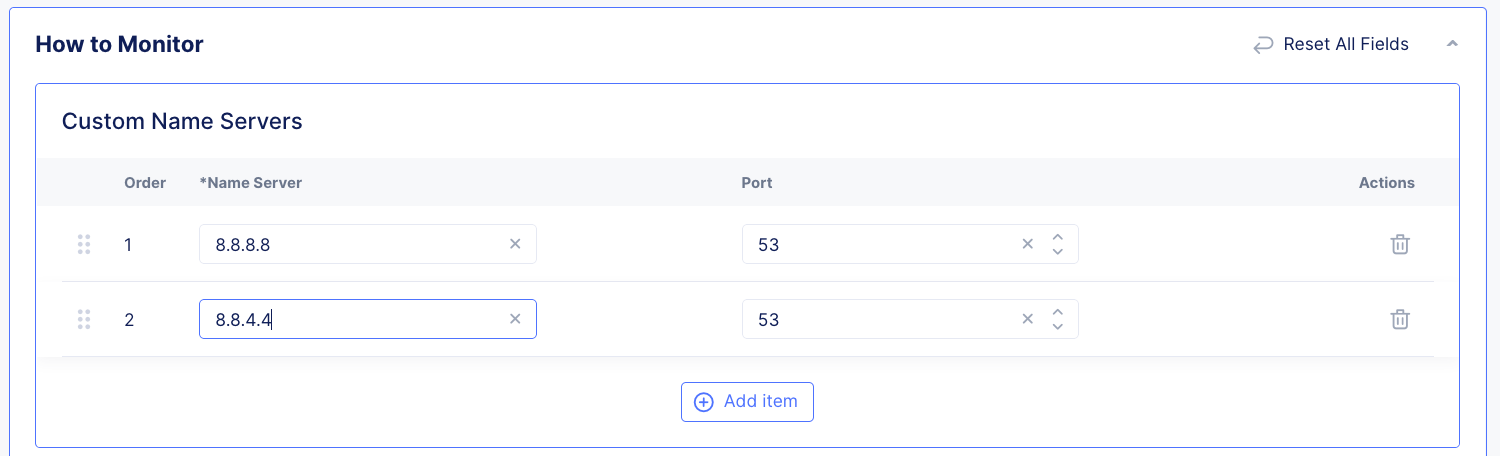
Figure: Added Nameservers
-
Update the
Query Timeout (ms)to control how long the monitor waits for a response before becoming critical. -
Update the
Number of consecutive test failuresto control how many failed monitors must happen in a row before becoming Critical. -
Update the
Number of Nameserversto control ifANYorALLnameservers tested must pass to be considered Healthy. -
Update the
Number of Failed Locationsto control how many regions must fail before the global monitor becomes Critical.
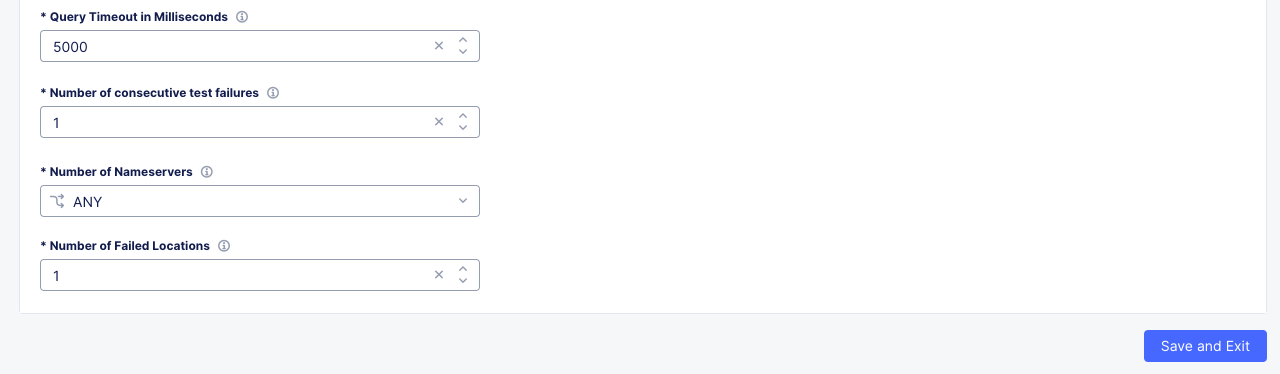
Figure: Completed How to Monitor
-
Optionally, enable
Health Policyto set a dynamic and/or static threshold when determining the health.- When a dynamic threshold is enabled, a rolling average of the last 7 days of response time data will be analyzed to dynamically set a response time threshold. If that threshold is exceeded for a period greater than the defined evaluation period, the monitor health will turn critical. A higher standard deviation value will generate fewer alerts, while a lower standard deviation value will generate more alerts.
- When a static maximum threshold is enabled, monitor health will turn critical if the defined max response time is exceeded for a period greater than the defined evaluation period.
- When a static minimum threshold is enabled, monitor health will turn critical if the response time is lower than the defined min response time for a period greater than the defined evaluation period.
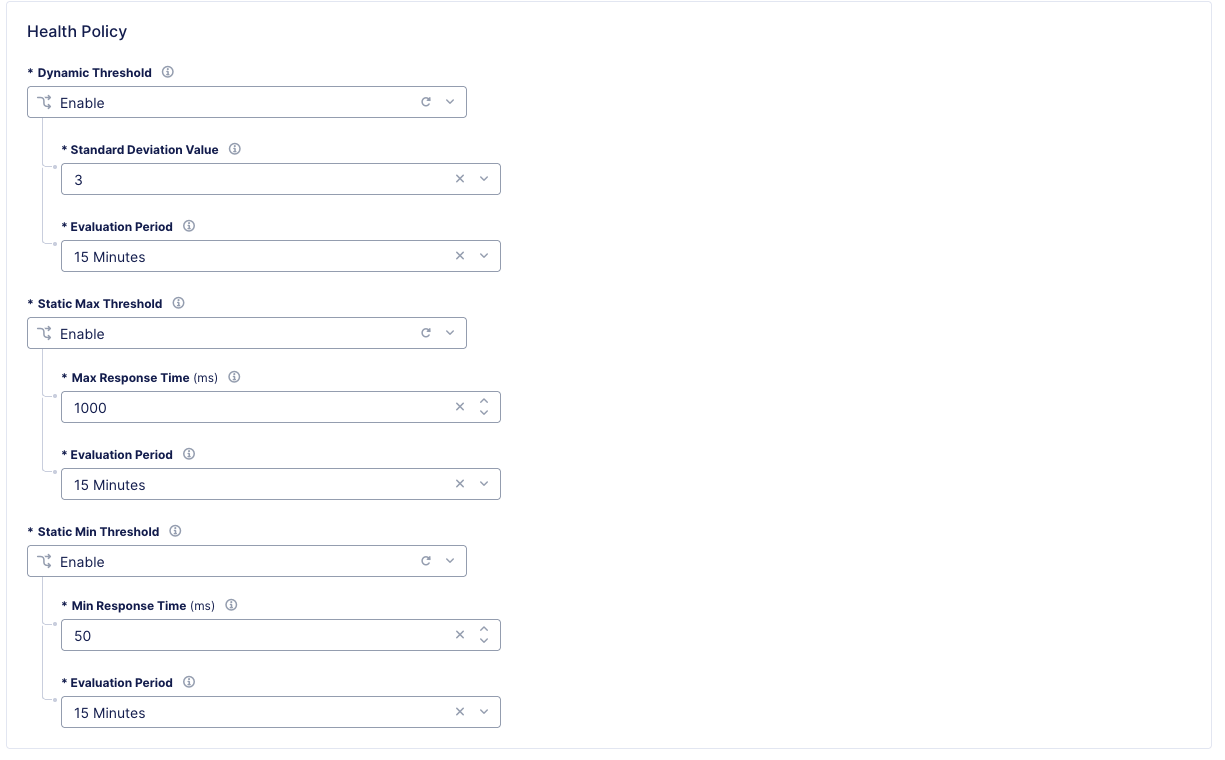
Figure: Setting health policy
- Select
Save and Exitto save the new DNS Synthetic Monitor.
Step 6: Setup Alerting.
-
Alerting for
Synthetic Monitoringcan be configured similar to other F5® Distributed Cloud services following the Alerting how-to guide. -
Optionally filter your
Alert Policyto only send notifications to the receiver based on alerts coming fromSynthetic Monitoringby either matching theGrouptoSynthetic-Monitorsor matching theAlert NametoSyntheticMonitorHealthCritical
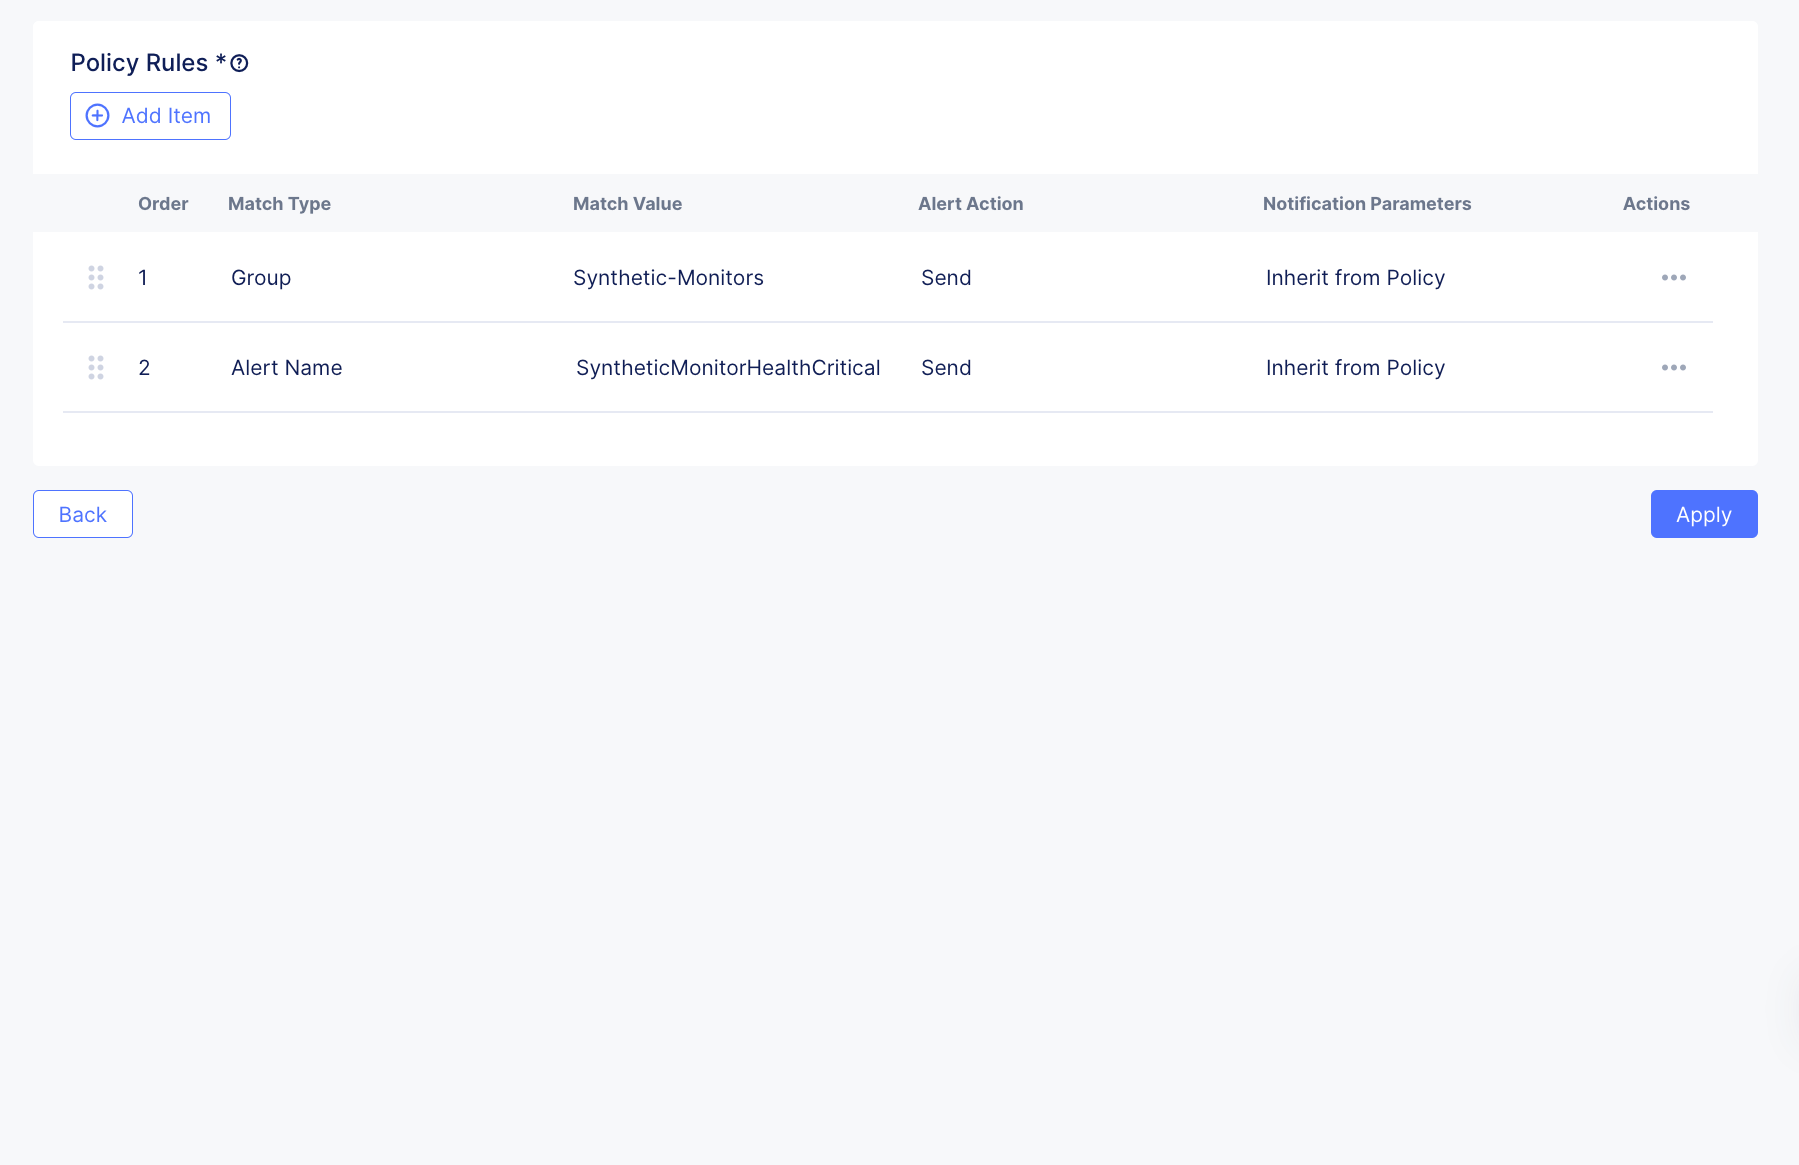
Figure: Alerting