Troubleshooting Guide for Customer Edge Registration Issues
Objective
If you misconfigure a Customer Edge (CE) during manual site deployment, internal processes on the CE might not start correctly and the CE might not connect to the F5 Distributed Cloud Global Controller (GC) for registration.
This document provides information about how to debug and resolve issues that arise due to Distributed Cloud published Terraform-related errors, networking and security misconfiguration, or CE internal processes that are not running. It also explains how to contact F5 Support for additional assistance.
Note: F5 recommends that you also review your product documentation to help ensure that all steps in the manual deployment process are followed correctly. See Deploy AWS VPC Site with Terraform.
Prerequisites
You must have a valid Distributed Cloud account.
If you do not have an account, see Getting Started with Console.
Troubleshooting
F5 Distributed Cloud Published Terraform-Related Apply Errors
Problem/Issue Description
The most common reasons that the Terraform apply action fails are authentication-related issues and misconfigured variables.
Resolution
-
For authentication-related issues, make sure you meet the following conditions:
- The F5 Distributed Cloud service credentials you used (API Certificate and Token) must still be valid. If the credentials expired, you can use the Distributed Cloud Console to renew the token and create a new certificate. For information, see Service Credentials.
- The
p12file must be present in the correct directory and you must enter the correct file name and path in theterraform.tfvarsfile. - You must export the
p12password and API token to the environment variables. If you are not sure if they are correct, create a new API certificate and token to use.
-
For variable misconfigurations, make sure that the values are in the correct format. Check the following commonly misconfigured variables:
-
You must set the value of
f5xc_namespacetosystem. -
You must copy the value for
f5xc_tenantfromAdministration > Tenant Settings > Tenant Overview > Tenant Information > Tenant ID.For example, copy
acmecorp-pxnxjsph. -
You must enter the value for
f5xc_api_urlin the following format:https://<tenant-domain>/api.For example, enter
https://acmecorp.console.ves.volterra.io/api. -
All file paths that you set during Terraform configuration must be correct. If you are unsure, set the absolute path from the root directory.
For information, see Deploy Site Using Terraform.
-
-
For all other issues, enable debug logs in the Terraform output. To enable debug logs, set the environment
variable TF_LOGto debug.For example, enter
export TF_LOG="DEBUG".
Important: For support with Terraform templates, open a GitHub issue in the GitHub repository that you used to deploy your site. Note that the code in this repository is community supported and is not supported by F5.
AWS: https://github.com/f5devcentral/terraform-xc-aws-ce/tree/main.
Networking and Security-Related Issues
Problem/Issue Description
If the CE nodes are deployed but fail to register, for example, the nodes do not show up on the Multi-Cloud Networking > Manage > Site Management > Registrations page, it might be because the CE is unable to reach the GC or the Regional Edges (RE) because of faulty routing or blocking security policies.
Resolution
Perform the following steps to troubleshoot your issue:
- Check instance size.
- Check Internet connectivity.
- Check endpoint reachability.
- Check proxy settings.
Check Instance Size
For the CE to operate properly, you must satisfy the minimum requirements. Many processes in the CE run as pods and might fail to start if the instance size is insufficient. For information, see Check for Pod Failures and Service Status.
- The minimum required footprint for public cloud CE instances is 4 vCPUs, 14 GB memory, and 80 GB of disk space (100 GB for App Stack site).
- For the minimum required footprint for bare metal deployments, see Minimum Hardware Requirements.
- Only Intel x86 CPUs are supported.
- The following are the recommended public cloud instance types:
- AWS: t3.xlarge, t3.2xlarge, m5.4xlarge
- Azure: Standard_D3_v2, Standard_D4_v2, Standard_D5_v2
- GCP: n1-standard-4, n1-standard-8, n1-standard-16, t2d-standard-4, t2d-standard-8, t2d-standard-16
- If the CE instances do not have sufficient CPU, memory, or disk resources, redeploy them with the proper instance type and sufficient disk space.
Check Internet Connectivity
The CE pulls Docker images for several processes when it initially boots up. It also must connect to the GC and REs to register and connect to the global network. If internet connectivity is blocked, these processes do not run, which causes the deployment to fail.
To check internet connectivity:
- Log in to the CE node. Use the username
adminand passwordVolterra123. - From a command line, run
ping 8.8.8.8.
The output must show 0% packet loss.
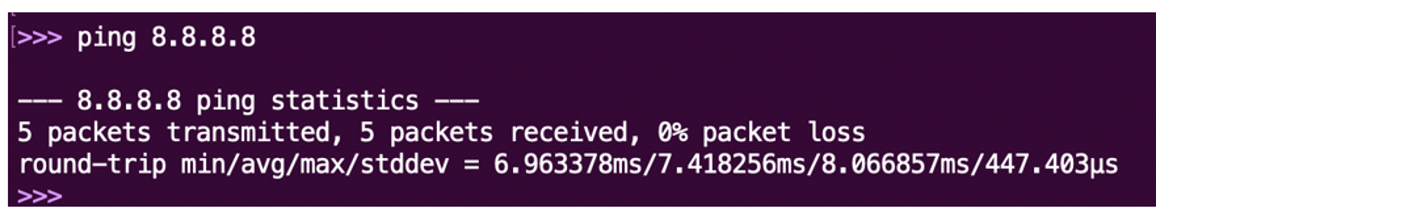
Figure: 0% packet loss
If the ping fails (the summary line shows 100% traffic loss), check for a network misconfiguration that might cause the traffic to have no route or for security group errors which might block the traffic.
If you want the egress to the internet to be through a cloud internet gateway, make sure:
- The default route of the Site Local Outside Interface (SLO) subnet points to the Internet gateway.
- The CE nodes are assigned public/elastic IP addresses.
If you want egress to the internet to be through a cloud NAT gateway or a third-party NAT instance, such as PAN FW as NAT, validate that the default route for the SLO subnet points to one of the following:
- The cloud NAT gateway
- The internal IP of the NAT instance.
The SLO interface for the CE nodes is usually deployed on a private subnet in this case and does not require a public IP address.
If the instance security group/network security group/firewall has egress rules, validate that the firewall allows traffic to the internet. If you do not want to allow all outgoing traffic from the CE, check and update the rules to allow the required ports and protocols as listed in Firewall or Proxy Reference for Network Cloud.
When internet connectivity is restored, log in to each CE node as an admin user and reboot each node.

Figure: Reboot command
Check Endpoint Reachability
To check endpoint reachability:
-
Log in to the CE nodes. Use the username
adminand passwordVolterra123. -
Use curl to check that the CE can connect to the list of endpoints below.
For example, enter
execcli curl-host -kL --connect-timeout 10 https://foo.comhttps://register.ves.volterra.iohttps://vesio.blob.core.windows.net/releases/certified-hardware/aws.ymlhttps://gcr.io/v2/volterraio/vpm/tags/listhttps://identityauthority.ves.volterra.iohttps://downloads.volterra.iohttps://storage.googleapis.com/storage/v1/bhttps://vesio.azureedge.nethttps://docker.iohttps://docker.com
Note that you only need to check TCP connectivity to the endpoints. The HTTP response is not of significance.
If curl does not time out or show a DNS error, you can treat it as successful.
The timeout is set to 10 seconds in the command above. The default timeout for curl is 2 minutes. A connection timeout indicates that requests are blocked by either a network routing issue or security policy.

Figure: `Connection timed out` message
A DNS resolution issue indicates DNS traffic is blocked.

Figure: `Could not resolve host` message
A successful connection can have an error response.

Figure: Successful connection error response
Even though the response is an error, the check is successful since the CE could connect to the endpoint.
Be sure that outgoing HTTP (TCP port 80), HTTPS (TCP port 443) and DNS (UDP port 53) to the internet are not blocked by any firewall, proxy or gateway device. If any of them are blocked, you must update the policy to allow HTTP and HTTPS for traffic to the internet or update the policies to allow the required ports and protocols as listed in Firewall or Proxy Reference for Network Cloud.
Once the endpoints are reachable, reboot the CE nodes by logging in as an admin user in each node.
Figure: Reboot command
Check Proxy Settings
If you deploy the CE in an environment where egress traffic is through a proxy, you must specify the proxy while running the curl command using the -x option.
For example, enter curl -Lk --connect-timeout 10 -x "http://user:pwd@127.0.0.1:1234" https://foo.com.
F5 Distributed Cloud Platform Manager Errors
Problem/Issue Description
If you cannot solve your issue using the steps in the previous sections, review the VPM logs from the CE. The VPM normally retries multiple times when there are failures. You can tail the log file to find relevant log entries.
Resolution
To access the VPM logs:
- For on-premises CE, log into the CE node. Use the username
adminand passwordVolterra123. - To tail the VPM logs, enter
execcli journalctl -fu vpm.
The following sections provide information about common errors.
Check Token Validity
You can create one site token and use it to register multiple CEs. If you use a pre-created token that has expired or that has been deleted from the Distributed Cloud Console, the registration fails.
Note: If you use the Distributed Cloud published Terraform templates, the Distributed Cloud Terraform provider creates a new site token for every new CE.
If the token is incorrect or is deleted from the Distributed Cloud Console, the logs show the following error:
Feb 01 21:59:31 ip-10-10-0-207.us-west-2.compute.internal vpm[1901]: register.go:701: Registration failed: Registration request: Request Register failed: Response with non-OK status code: 500, content: "Unknown token: Token doesn't exist:2024-02-01 21:59:32.158638891 +0000 UTC m=+48549.350034300,, retry in 1m3.154185427s
To fix this issue, use a valid site token to redeploy the CE.
When the CE is successfully registered, the CE node must appear in the Distributed Cloud Console. To view the CE node, click Manage > Site Management > Registrations.
Check the Kube API Server
If VPM logs show the Kube API health endpoint check failing, it might mean a misconfiguration has caused the Kubelet service to fail.

Figure: Kube API health endpoint check failure message
- Log in to the CE node. Use the username
adminand passwordVolterra123. - Check the Kubelet status. Enter
execcli systemctl-status-kubelet.
Check for Pod Failures and Service Status
If VPM logs show the message, Replicas are not in desired state, it means that pods are not starting.
Some pods can take longer to start, so this issue might resolve itself. For pods that are stuck in the same state for 20 minutes or more, use the volterra-status command to check the status of all services.
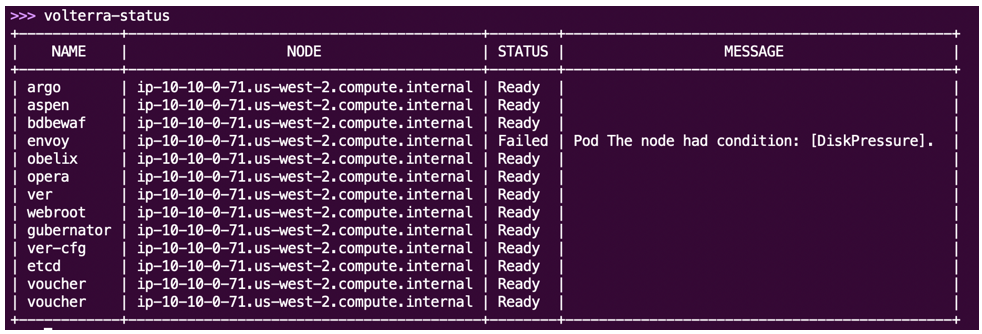
Figure: 'volterra-status'command
In the above example, the CE does not have enough disk capacity, which causes the envoy service to fail. To resolve this, increase the disk size and reboot the CE.
Contacting F5 Support
If the troubleshooting steps in the previous sections do not resolve your issue, you can open a support ticket from the Distributed Cloud Console. For information, see How to create a support ticket via F5® Distributed Cloud Console.
Important: For support with Terraform templates, open a GitHub issue in the GitHub repository that you used to deploy your site. Note that the code in this repository is community supported and is not supported by F5.
AWS: https://github.com/f5devcentral/terraform-xc-aws-ce/tree/main.
Important: When you open a case with F5 Support, mention any status error messages that display in your logs.
F5 requires you to attach the following information to the support ticket:
- Debug logs
- Diagnosis tool output
- Completed questionnaire
Collect the Debug Log
To collect debug log:
- Log into the CE CLI prompt. Use the username
adminand passwordVolterra123. - From the CLI prompt, run the
collect-debug-infocommand. - Run
exec ls /tmp/debuginfo/to check if the log tar file is ready.
When the log tar file is ready, the following message displays:

Figure: Debug logs
You can also download from the local network using curl on your laptop: curl https://admin:<password into local UI>@<IP address of CE>:65500/debug-info/files/debuginfo-<date>-<site-name>.tar.bz2 --insecure --output debuginfo-<date>-<site-name>.tar.bz2.
Collect Diagnosis Output
The CE has a built-in tool to run most of the above commands and to list their output.
- Log in to the CE CLI prompt. Use the username
adminand passwordVolterra123. - From the CLI prompt, run
diagnosis. - Copy the output to the support ticket.
The diagnosis tool output is a continuous list of outputs of multiple commands the tool runs. It can be difficult to understand, but it helps F5 Support check the status of connectivity, interfaces and processes on the CE.
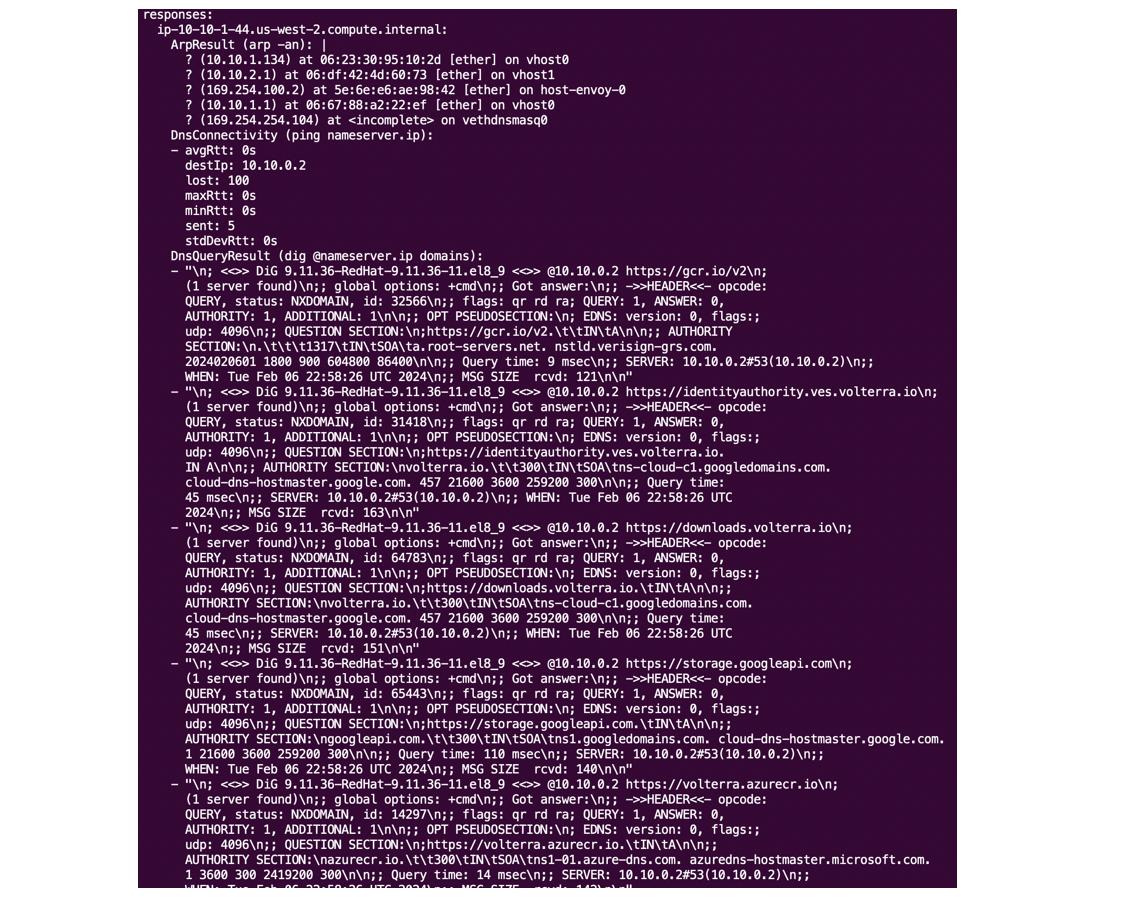
Figure: Diagnosis tool output
If the Kubelet has not initialized on the node, the command displays the following error:

Figure: Kublet not initialized
Complete the Debug Questionnaire
Compile answers to the following questions and include them in the support ticket.
- How was the CE deployed?
- Using Distributed Cloud published Terraform.
- Manually deployed instances using images.
- Describe the topology in which the CE is deployed.
- Site type (ingress-egress/ingress only/App Stack)
- Node size (CPU, memory, disk) / instance type if cloud deployment
- Provider (AWS/Azure/GCP/VMware/KVM/Bare metal/etc.)
- Gateway type (Internet gateway/ NAT gateway)
- External FW/ proxy present?
- Region name if deployed on public cloud
- What is the site name?
- Can the CE reach the Internet?
- Are there any DNS resolution issues?
- Are any of the required endpoints unreachable?
- Are there any error messages on the CE service status?
- Provide a screenshot of the secure mesh site dashboard and the message if a software update has failed.
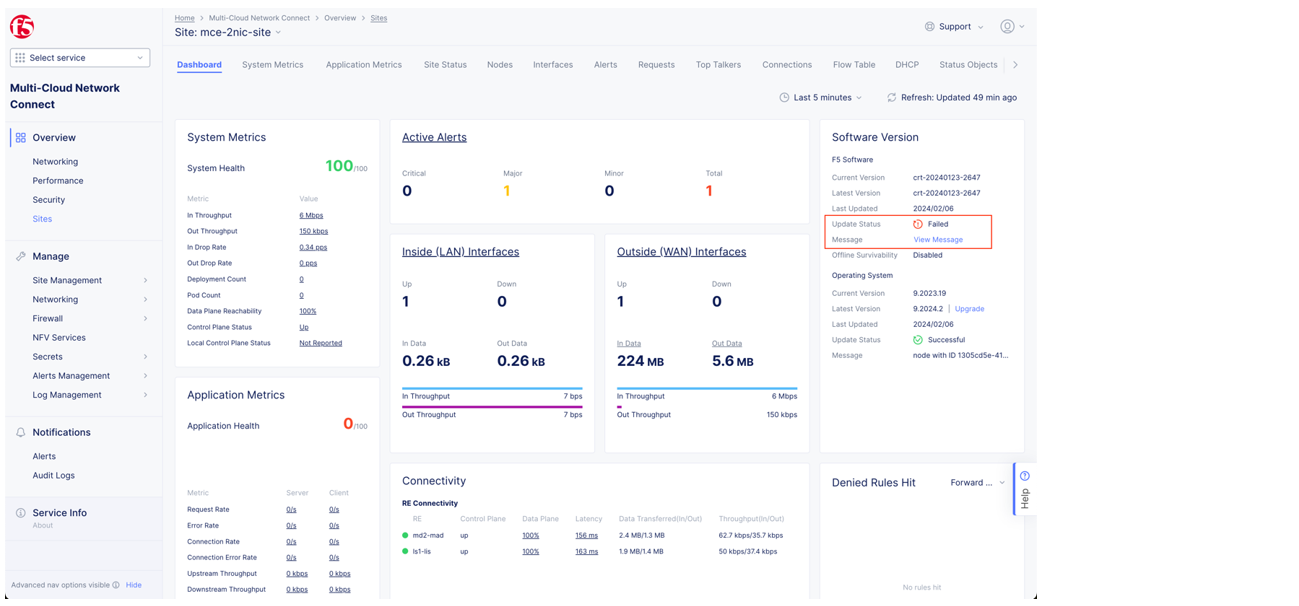
Figure: Secure mesh site dashboard
On this page:
- Objective
- Prerequisites
- Troubleshooting
- F5 Distributed Cloud Published Terraform-Related Apply Errors
- Networking and Security-Related Issues
- Check Instance Size
- Check Internet Connectivity
- Check Endpoint Reachability
- Check Proxy Settings
- F5 Distributed Cloud Platform Manager Errors
- Check Token Validity
- Check the Kube API Server
- Check for Pod Failures and Service Status
- Contacting F5 Support
- Collect the Debug Log
- Collect Diagnosis Output
- Complete the Debug Questionnaire