Create Advanced HTTP(s) Synthetic Monitor
Objective
This guide provides instructions on how to create an HTTP(s) Synthetic Monitor leveraging many of the more advanced features. These parameters will help you to fine tune your monitors in order to get the most out of them.
Using the instructions provided in this document, you can create an HTTP(s) Synthetic Monitor to validate and alert on the health and performance of your HTTP(s) applications.
Configure HTTP Monitor
Step 1: Create a new HTTP Monitor.
-
Log into the F5® Distributed Cloud Console.
-
Navigate to either the Observability workspace tile or menu.
Note: The homepage is role based, and your homepage may look different due to your role customization. Select All Services drop-down menu to discover all options.
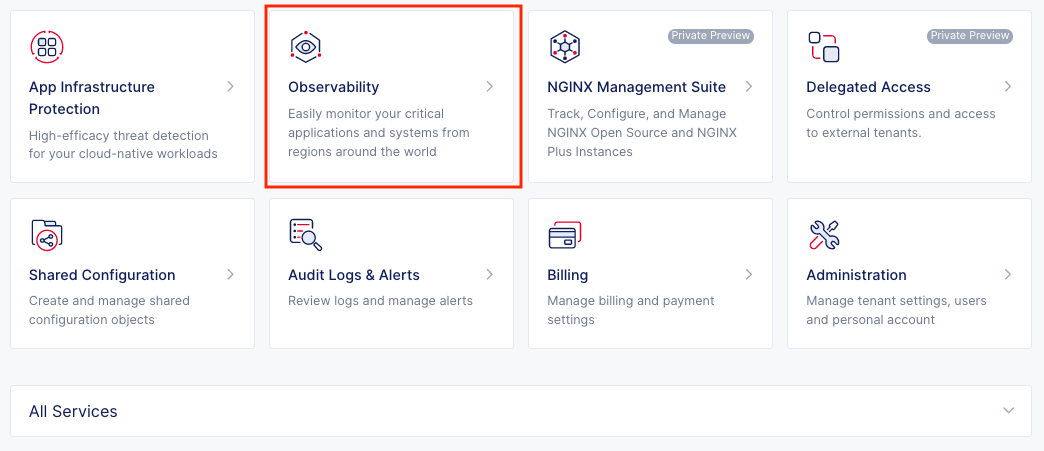
Figure: Observability Tile
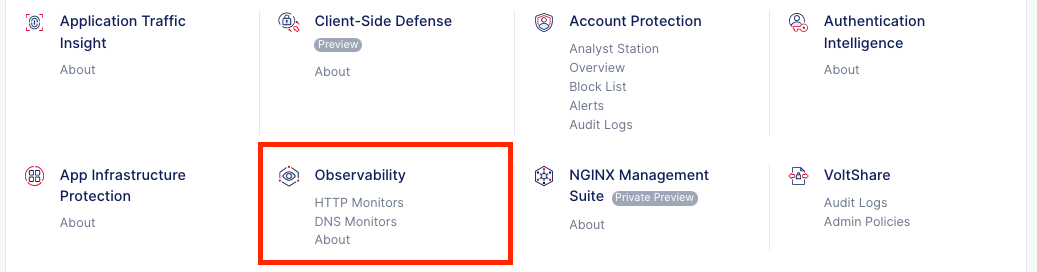
Figure: Observability Menu
- Select Manage > Synthetic Monitors > HTTP Monitors.
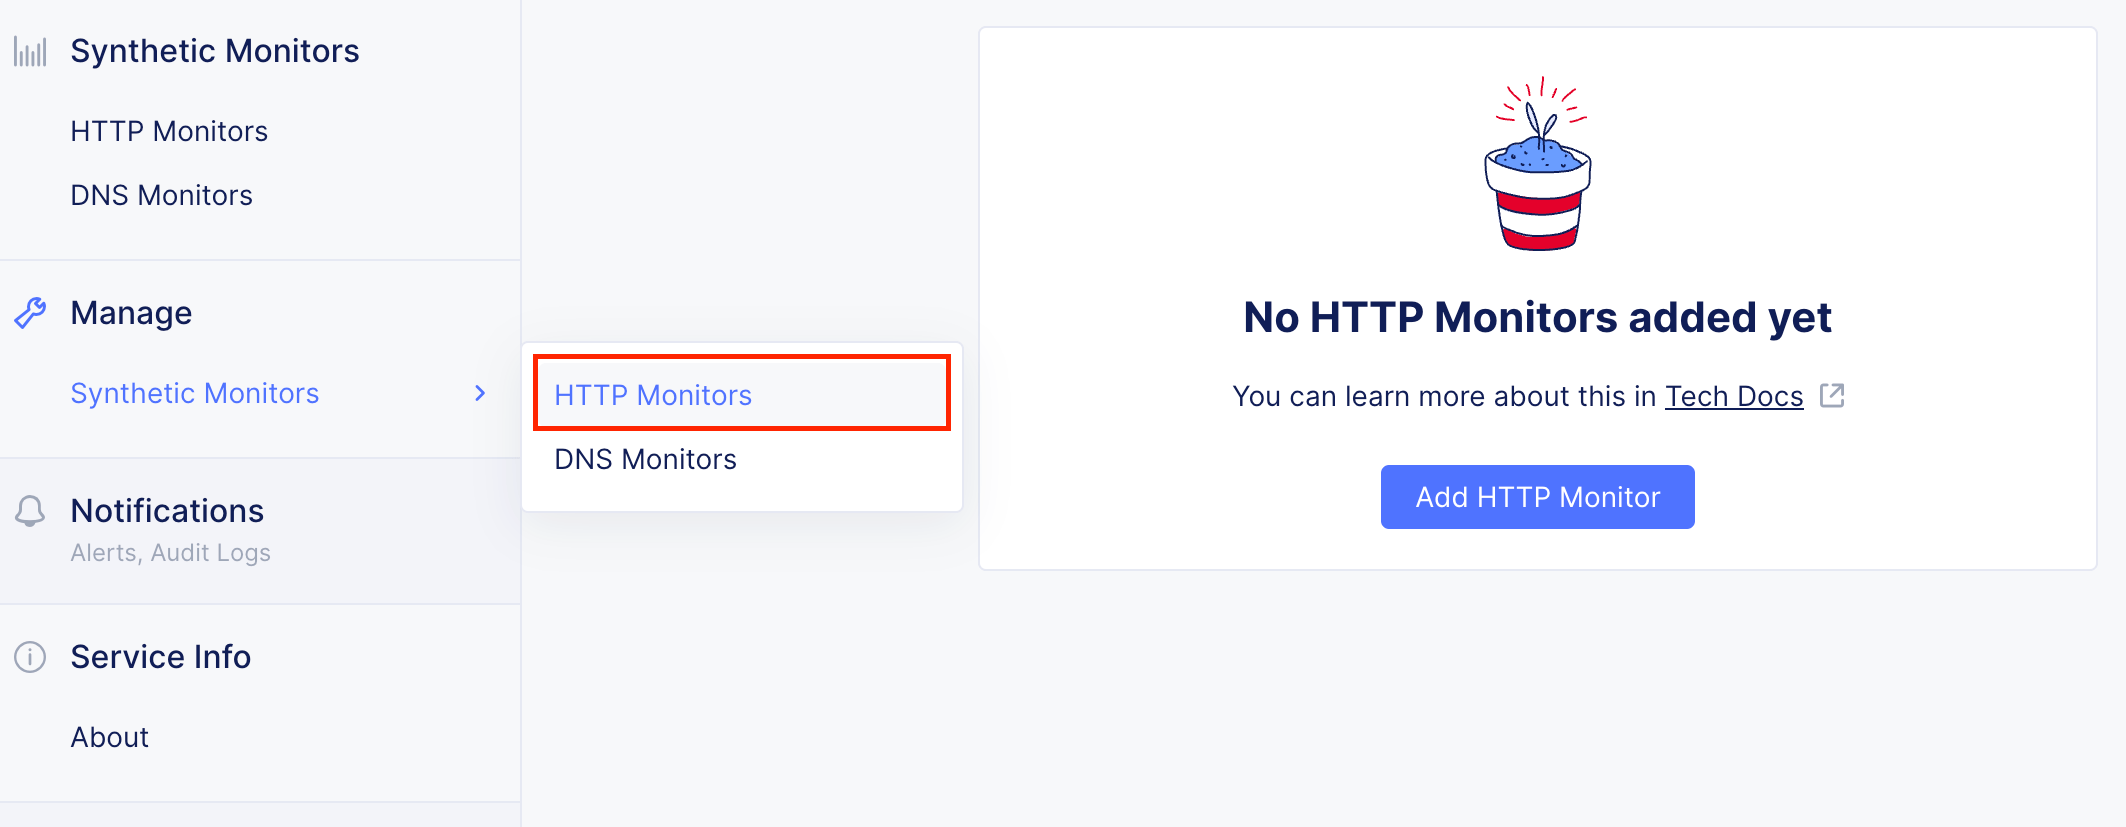
Figure: Manage Menu
- Click Add HTTP Monitor.
Step 2: Configure Metadata.
- Enter Name, Labels, and Description as needed.
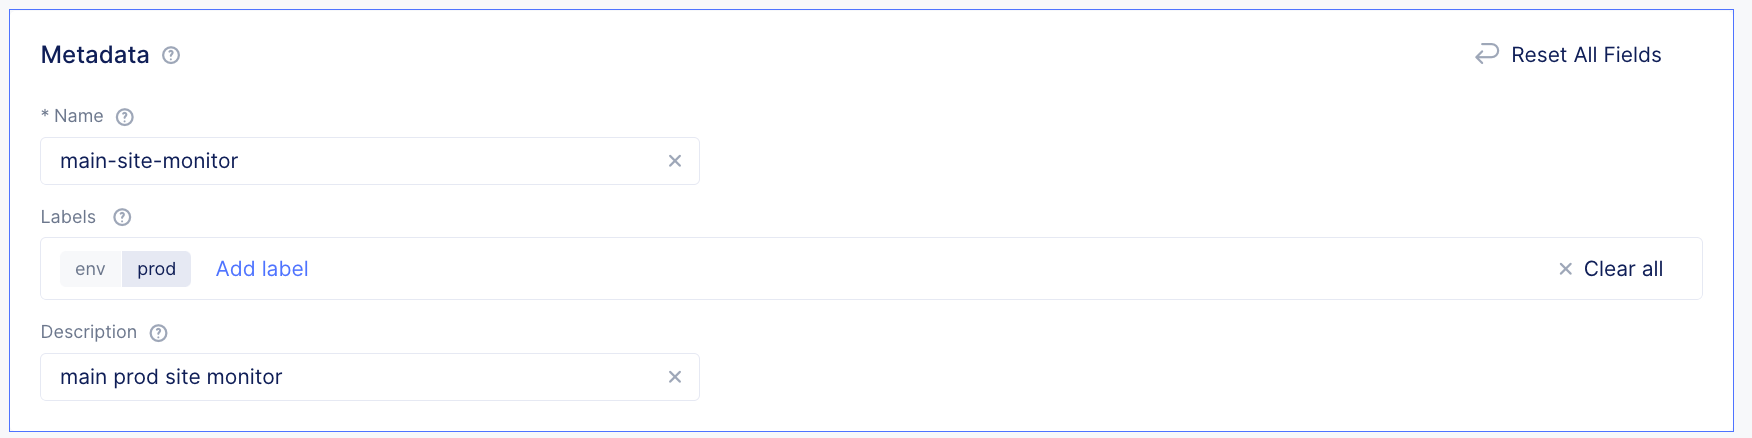
Figure: Metadata
Step 3: Configure what to monitor.
Step 3.1: Set the monitor URL, interval, and HTTP request method type.
-
Enter the URL that you would like to monitor.
-
Set the monitor frequency Interval for how often you would like the monitor to run from each source region configured later in the form.
-
From the Select Method Type menu, set the HTTP request to use for the monitor.
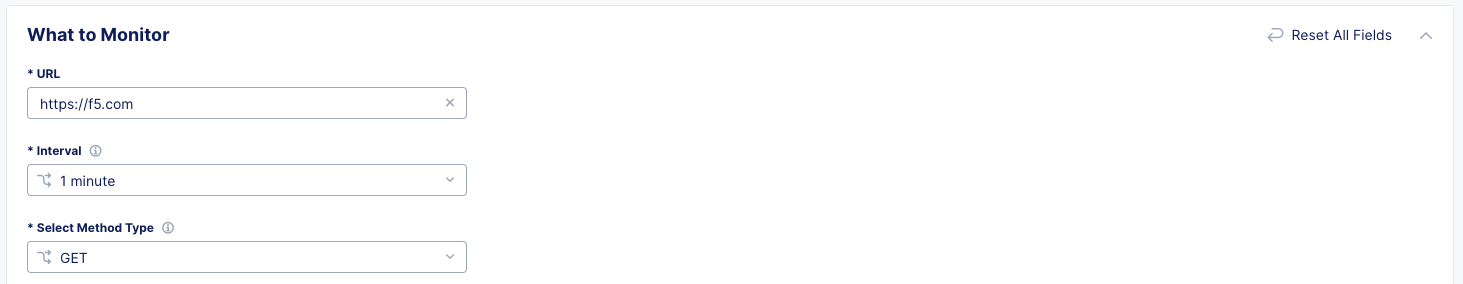
Figure: URL, Interval, and HTTP Request Method
Step 3.2: Optionally, set Request Headers.
Note: Some applications require specific headers to be present either for functionality or logging purposes.
-
Enter the Key as for the header name.
-
Enter the Value as the header value.
-
Select Add item if you require additional Request Headers to be added.
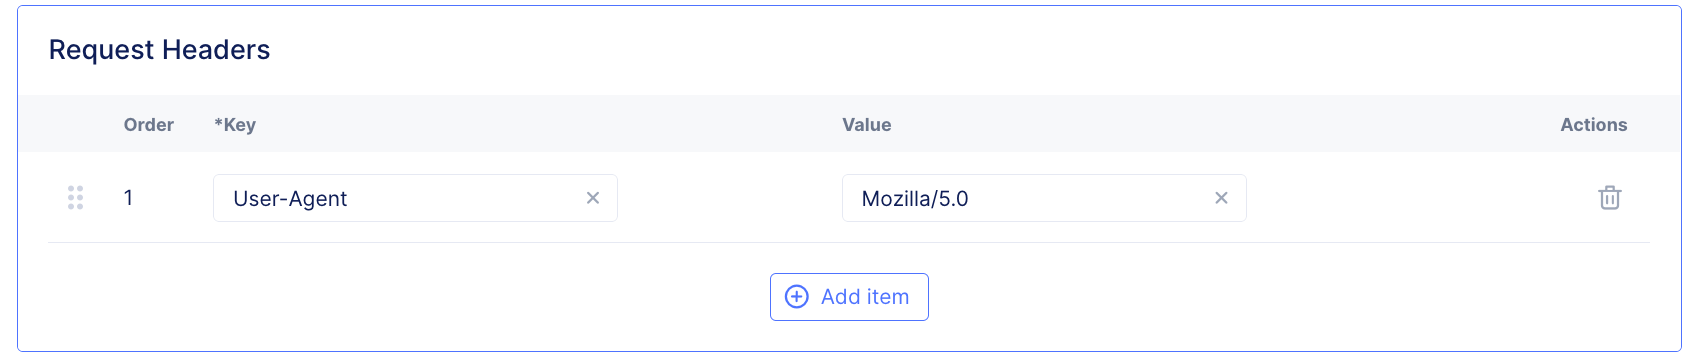
Figure: Request Headers
Step 3.3: Optionally, update the Valid Response Codes.
Note: A monitor will be considered healthy by default if the response code is within the 200 or 300 response code range. Valid Response Codes allows for the use of wildcards(*) so that the user does not need to manually input every allowed response. For example, 2** covers any 200 response code. If 202 was explicitly set with no other codes then all response codes other than 202 would be considered Critical.
- Add, remove, or modify the Valid Response Codes to match what you expect from your HTTP(s) endpoint.
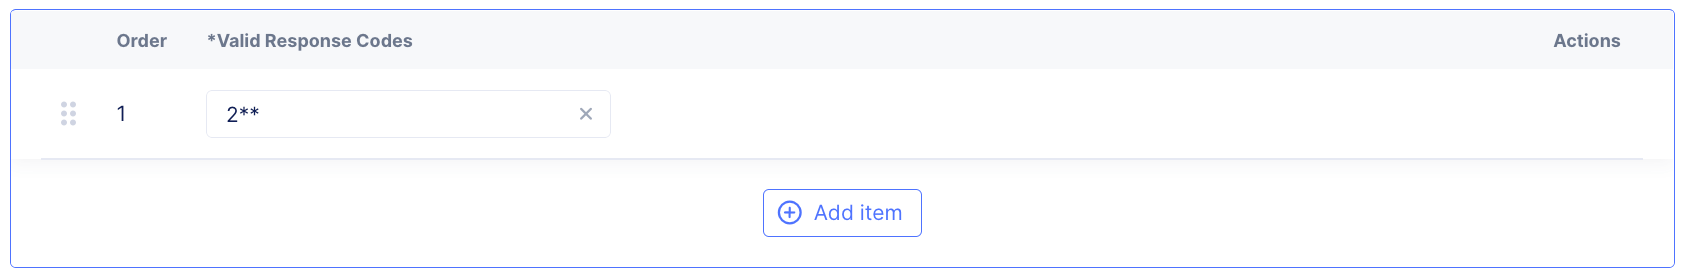
Figure: Response Codes
Step 3.4: Optionally, set an SNI Host Override value.
- Modify the SNI Host Override in order to send an SNI value other than the URL host value.
Step 3.5: Optionally, set a Receive String.
- Modify the Receive String field to a value that is required to be within the response body of the monitored endpoint. If the response does not include the string then it will be marked Critical. The example below would match up or healthy.
Step 4: Configure where to monitor from.
Note: Each source provider and region added will monitor the endpoint configured for the monitor. The combined health from all regions will generate the overall monitors global health.
- In the Sources section, click Add Item to begin adding sources for the monitor.
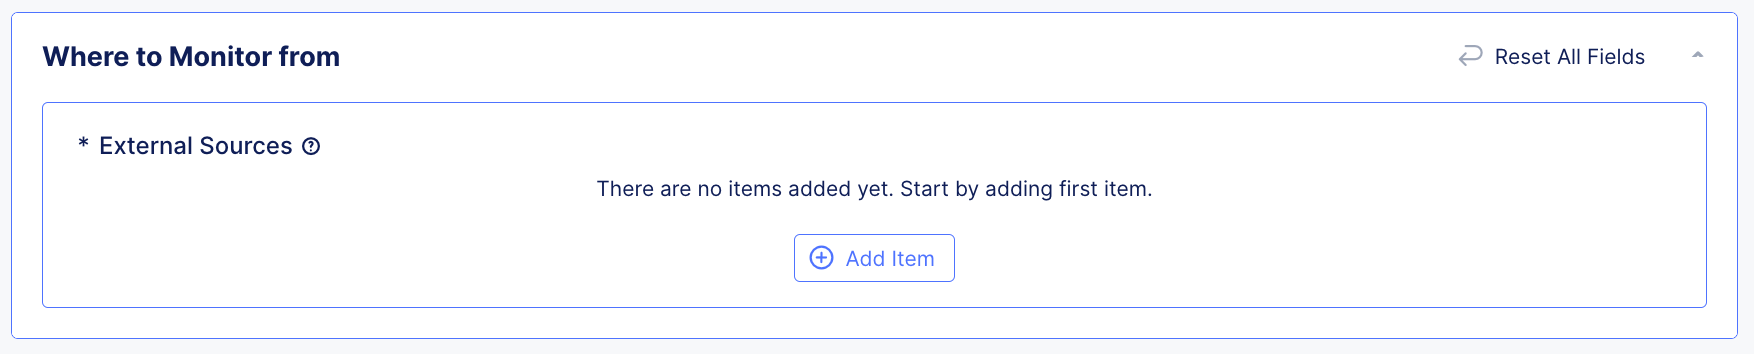
Figure: Empty Sources
-
Select the desired Provider for which you would like to source the monitor from.
-
With the Provider selected, click the Regions dropdown and select which Region you would like the monitor to run from.
-
Select additional regions from the dropdown if you would like to add more Regions for the current Provider.
Note: As a general practice, the F5 team suggests you always configure synthetic monitoring from multiple geographic locations (regions, availability zones). This provides redundancy and reduces the risk of false positives due to localized issues.
The F5 team suggests that customers pick more than one region. In addition to Regional Edge (RE) sites, use other probing locations, such as cloud provider edge locations (for example: AWS, CEs), to decouple monitoring from RE infrastructure and improve resilience.
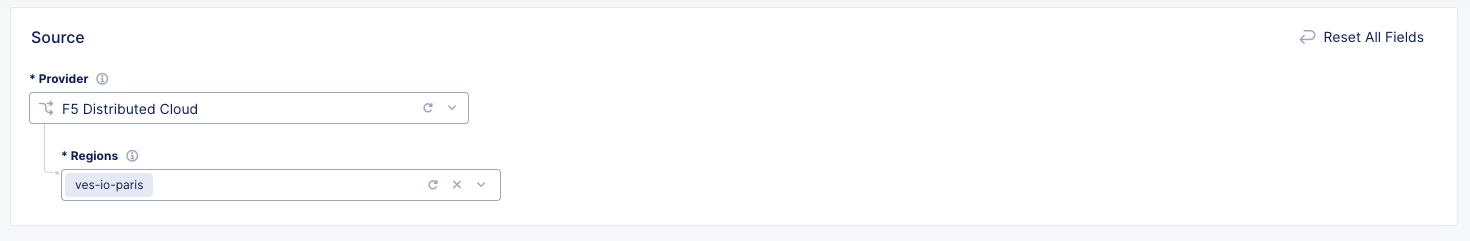
Figure: Provider Regions
-
Click Apply to add the current Provider and Regions to the monitor.
-
Back in the primary Sources section, select Add Item and follow the steps above if you would like to add additional Providers and Regions.
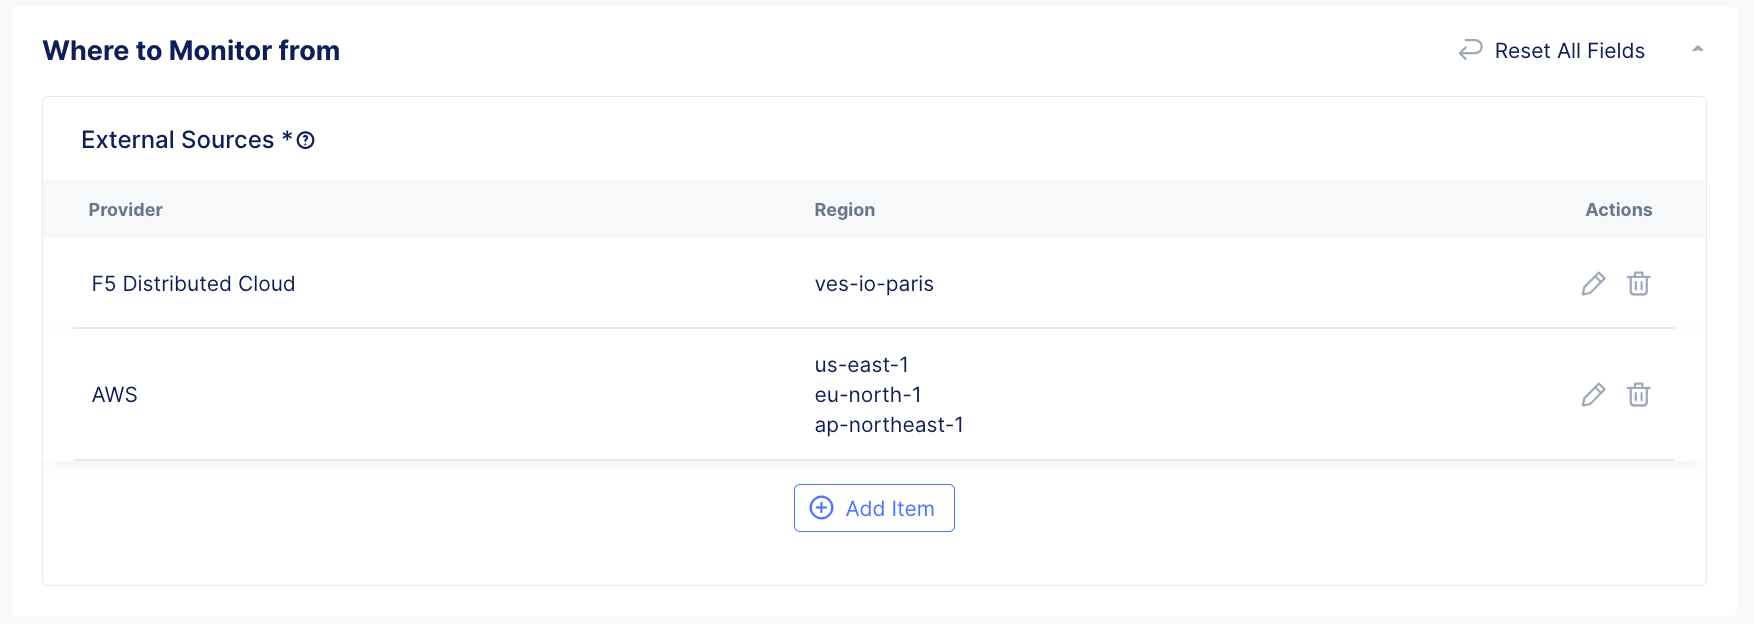
Figure: Sources
Step 5: Configure how to monitor.
-
Update Response Timeout (ms) to control how long a monitor will wait for a response before considering the URL in Critical state.
-
Update Number of consecutive test failures to control how many Critical responses must be received before the Global health changes to Critical.
-
Update Number of Failed Locations to control how many source Provider-Regions must fail before the Global health changes to Critical.
-
Optionally enable Ignore Cert Errors to have the monitor exclude TLS errors when determining the health.
-
Optionally enable Follow Redirects to have the monitor follow redirects before determining health.
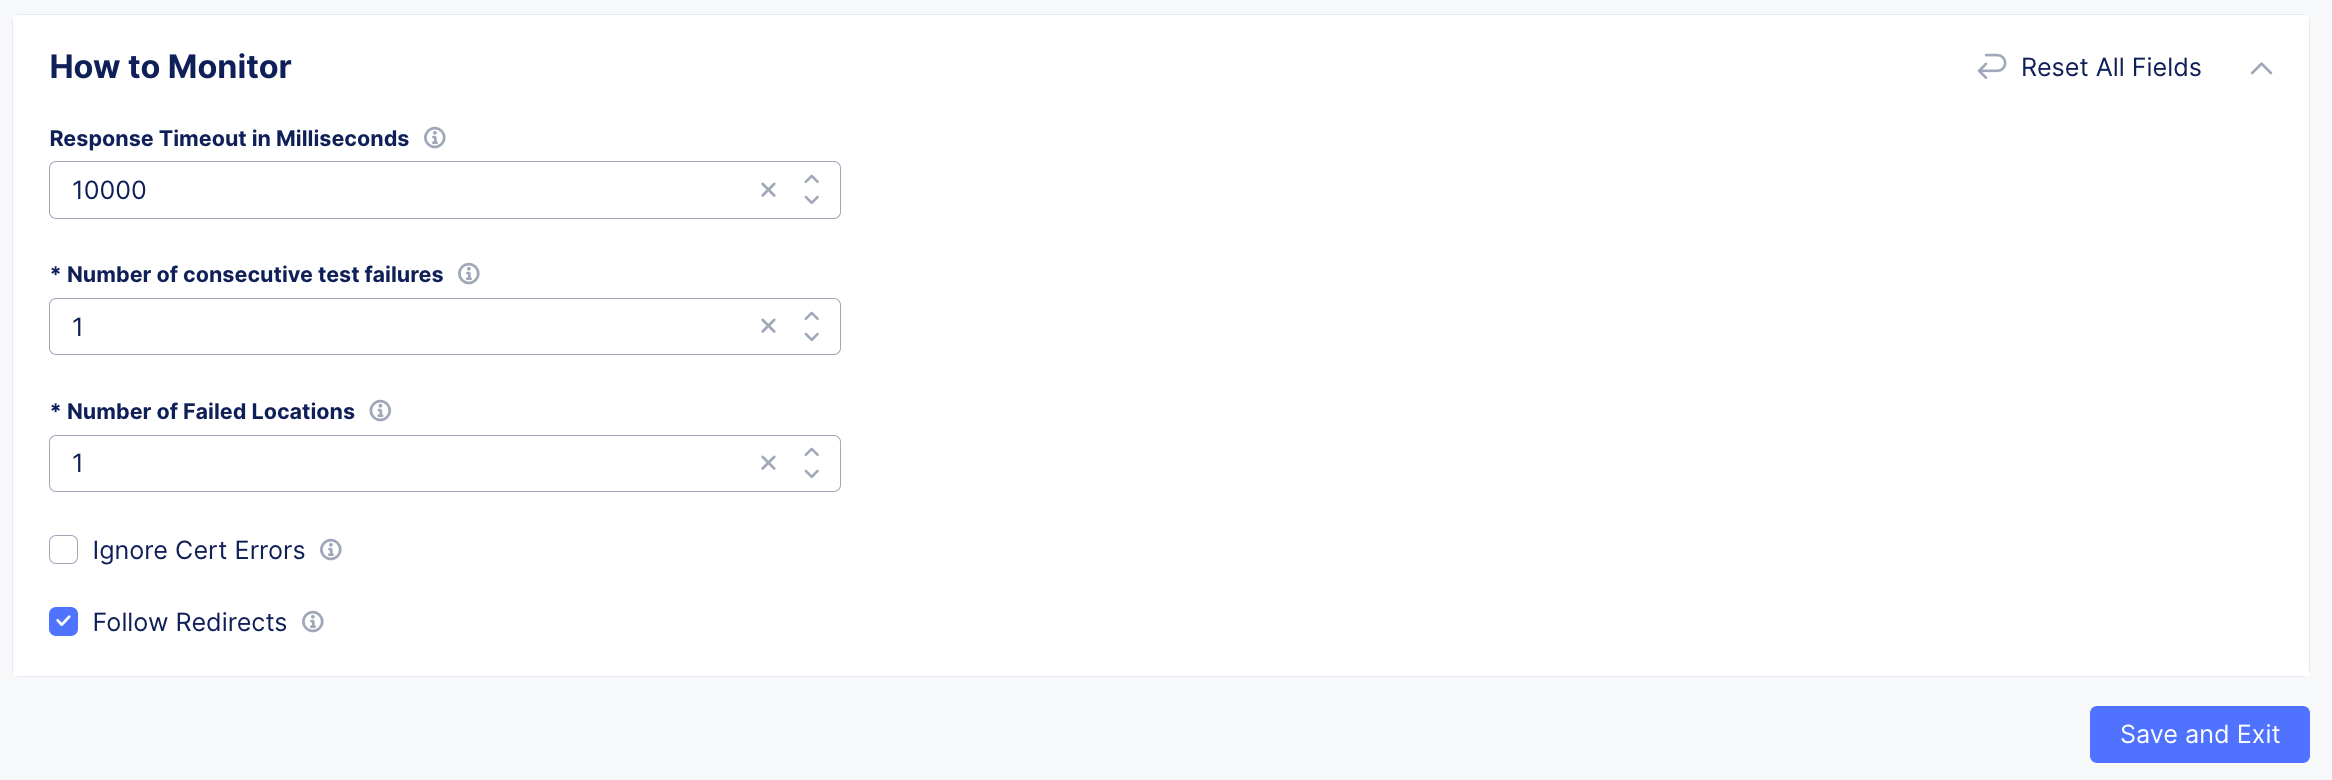
Figure: How to Monitor
- Optionally, enable Health Policy to set a dynamic and/or static threshold when determining the health.
- When a dynamic threshold is enabled, a rolling average of the last 7 days of response time data will be analyzed to dynamically set a response time threshold. If that threshold is exceeded for a period greater than the defined evaluation period, the monitor health will turn critical. A higher standard deviation value will generate fewer alerts, while a lower standard deviation value will increase alerts.
- When a static max threshold is enabled, monitor health will turn critical if the defined max response time is exceeded for a period greater than the defined evaluation period.
- When a static min threshold is enabled, monitor health will turn critical if the response time is lower than the defined min response time for a period greater than the defined evaluation period.
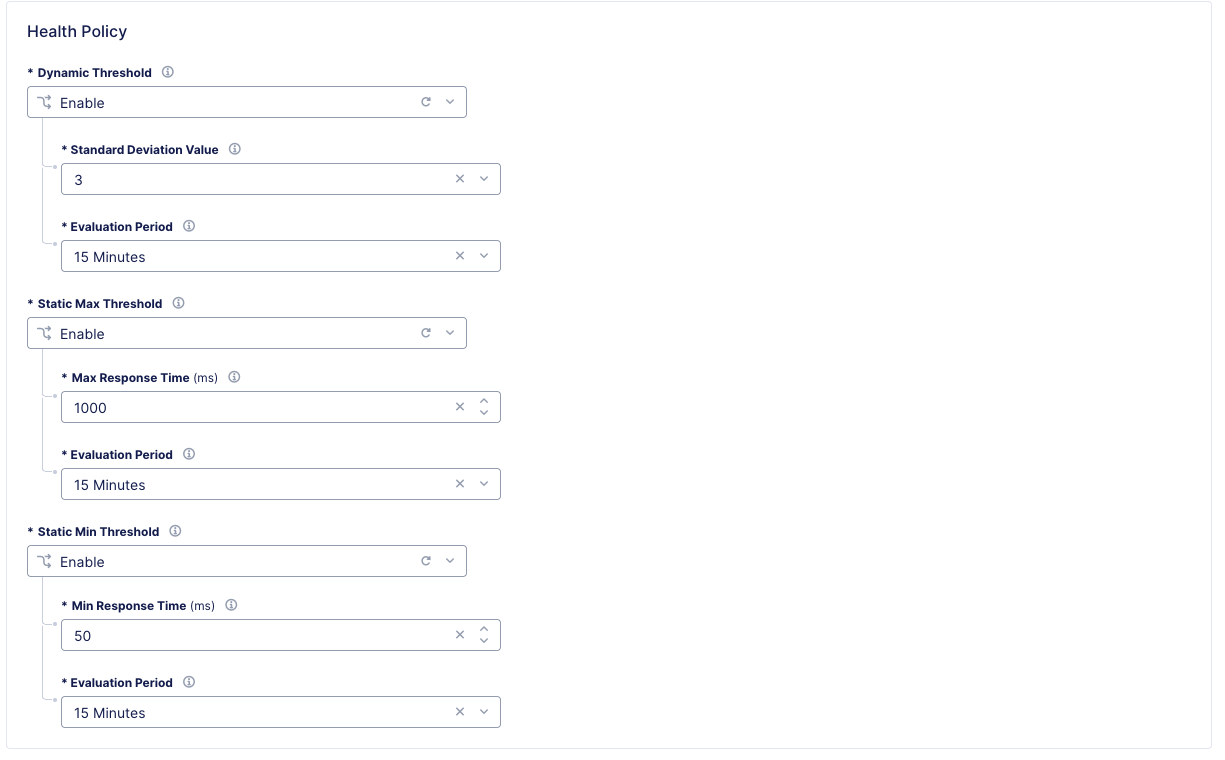
Figure: Setting health policy
- Select Add HTTP Monitor to save the new HTTP Synthetic Monitor.
Step 6: Set up alerting.
Alerting for Synthetic Monitoring can be configured similar to other F5® Distributed Cloud services following the Alerting guides.
Optionally, filter your Alert Policy to only send notifications to the receiver based on alerts coming from Synthetic Monitoring by either matching the Group to Synthetic-Monitors or matching the Alert Name to SyntheticMonitorHealthCritical.
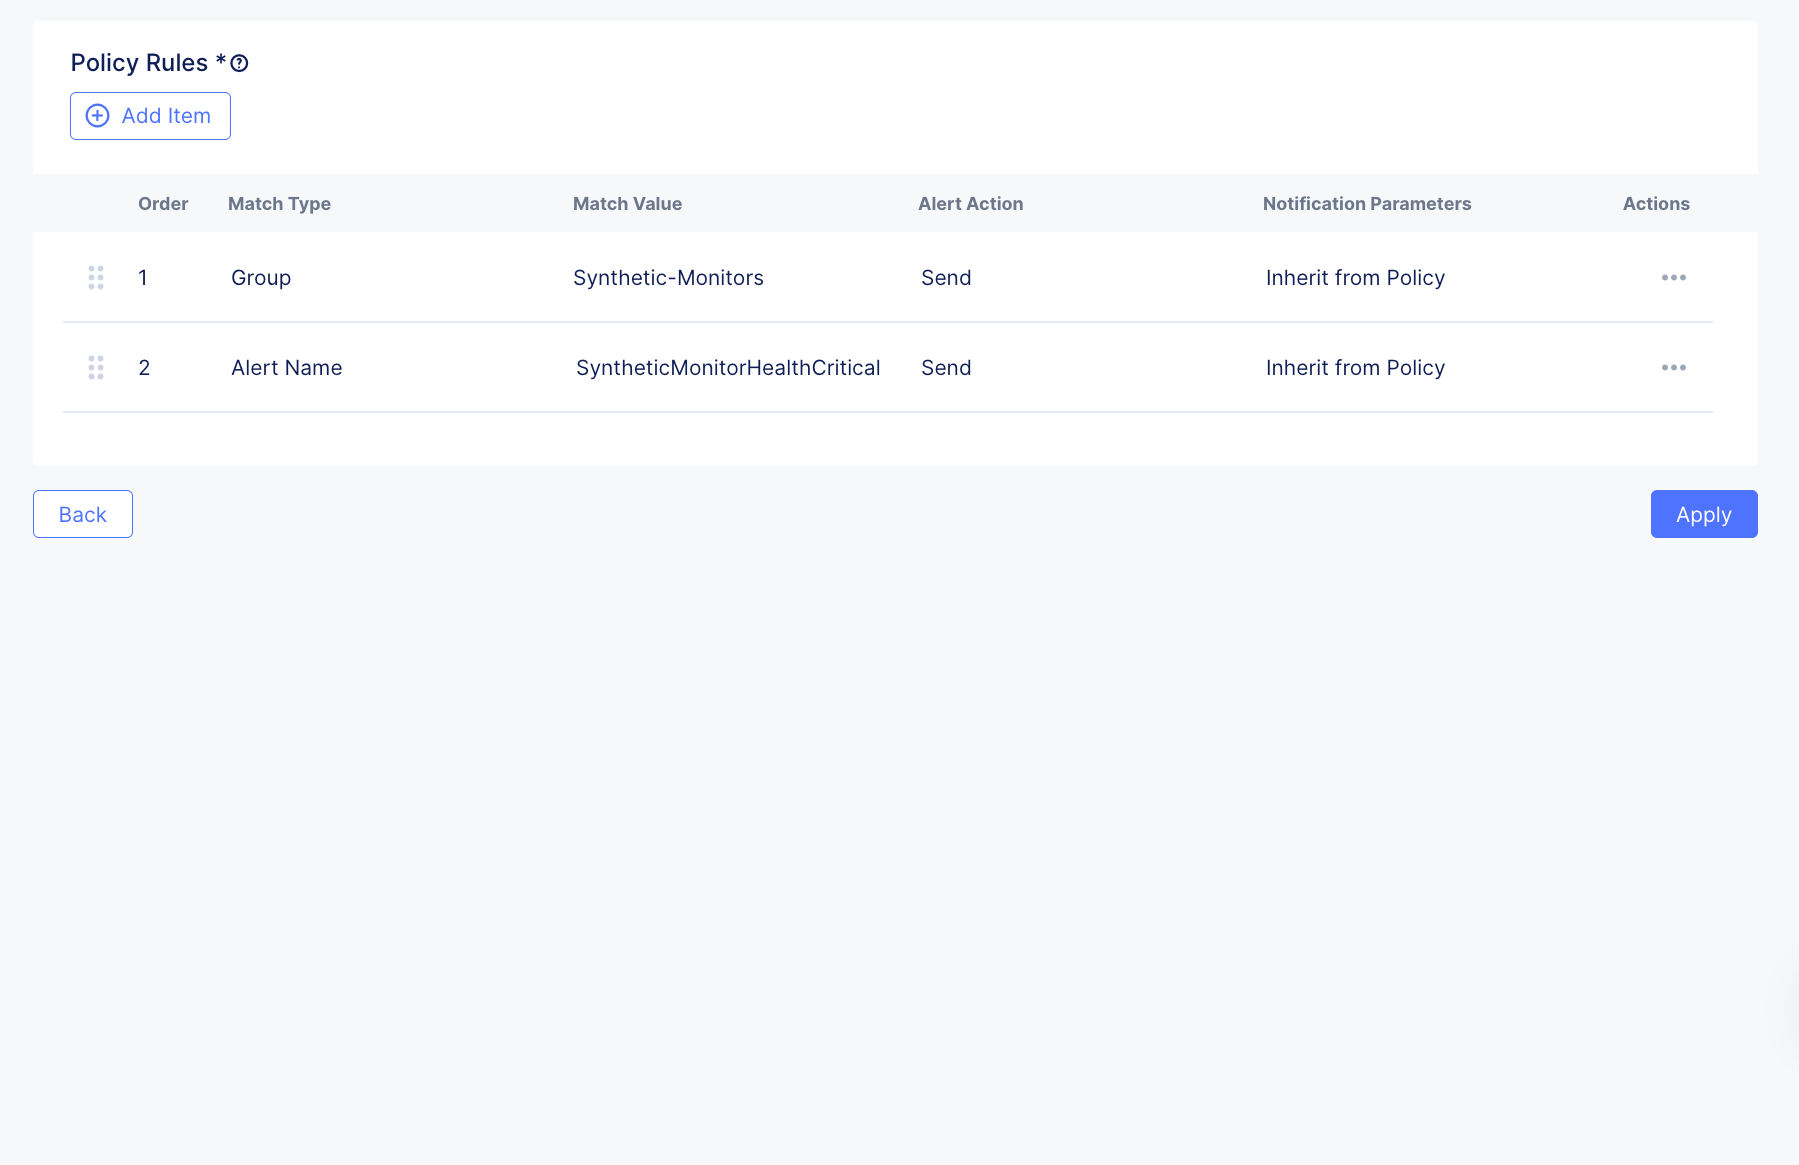
Figure: Alerting