Monitor Site Security
Objective
This document provides instructions on using the site security monitoring view in F5® Distributed Cloud Console to view the security status for the various sites of your tenant. To learn more about site and how Console provides monitoring support, see Distributed Cloud Site and Monitoring.
Using the instructions provided in this document, you can look at an overview of the firewall security for your site, and you can investigate details of firewall events and logs.
Prerequisites
-
An F5 Distributed Cloud Account. If you do not have an account, see Getting Started with Console.
-
One or more cloud or edge locations with a Site. Install the node or cluster image in your cloud or edge location. See Create a Site for more information.
Activities of Monitoring
In the Multi-Cloud Network Connect workspace, select Site Security. This page defaults to the Firewall Dashboard, which provides a security overview of your site. You can also view your site's specific events on the Firewall Events tab, you can use the Firewall Logs tab to see your site's requests in both tabular and graphic views, or you can view your network functions virtualization (NFV) on the NFV services tab.
Firewall Dashboard
The Firewall dashboard shows an aggregation of all firewall activity related to all your apps running on all your sites. Various information is presented in different sections within the dashboard.
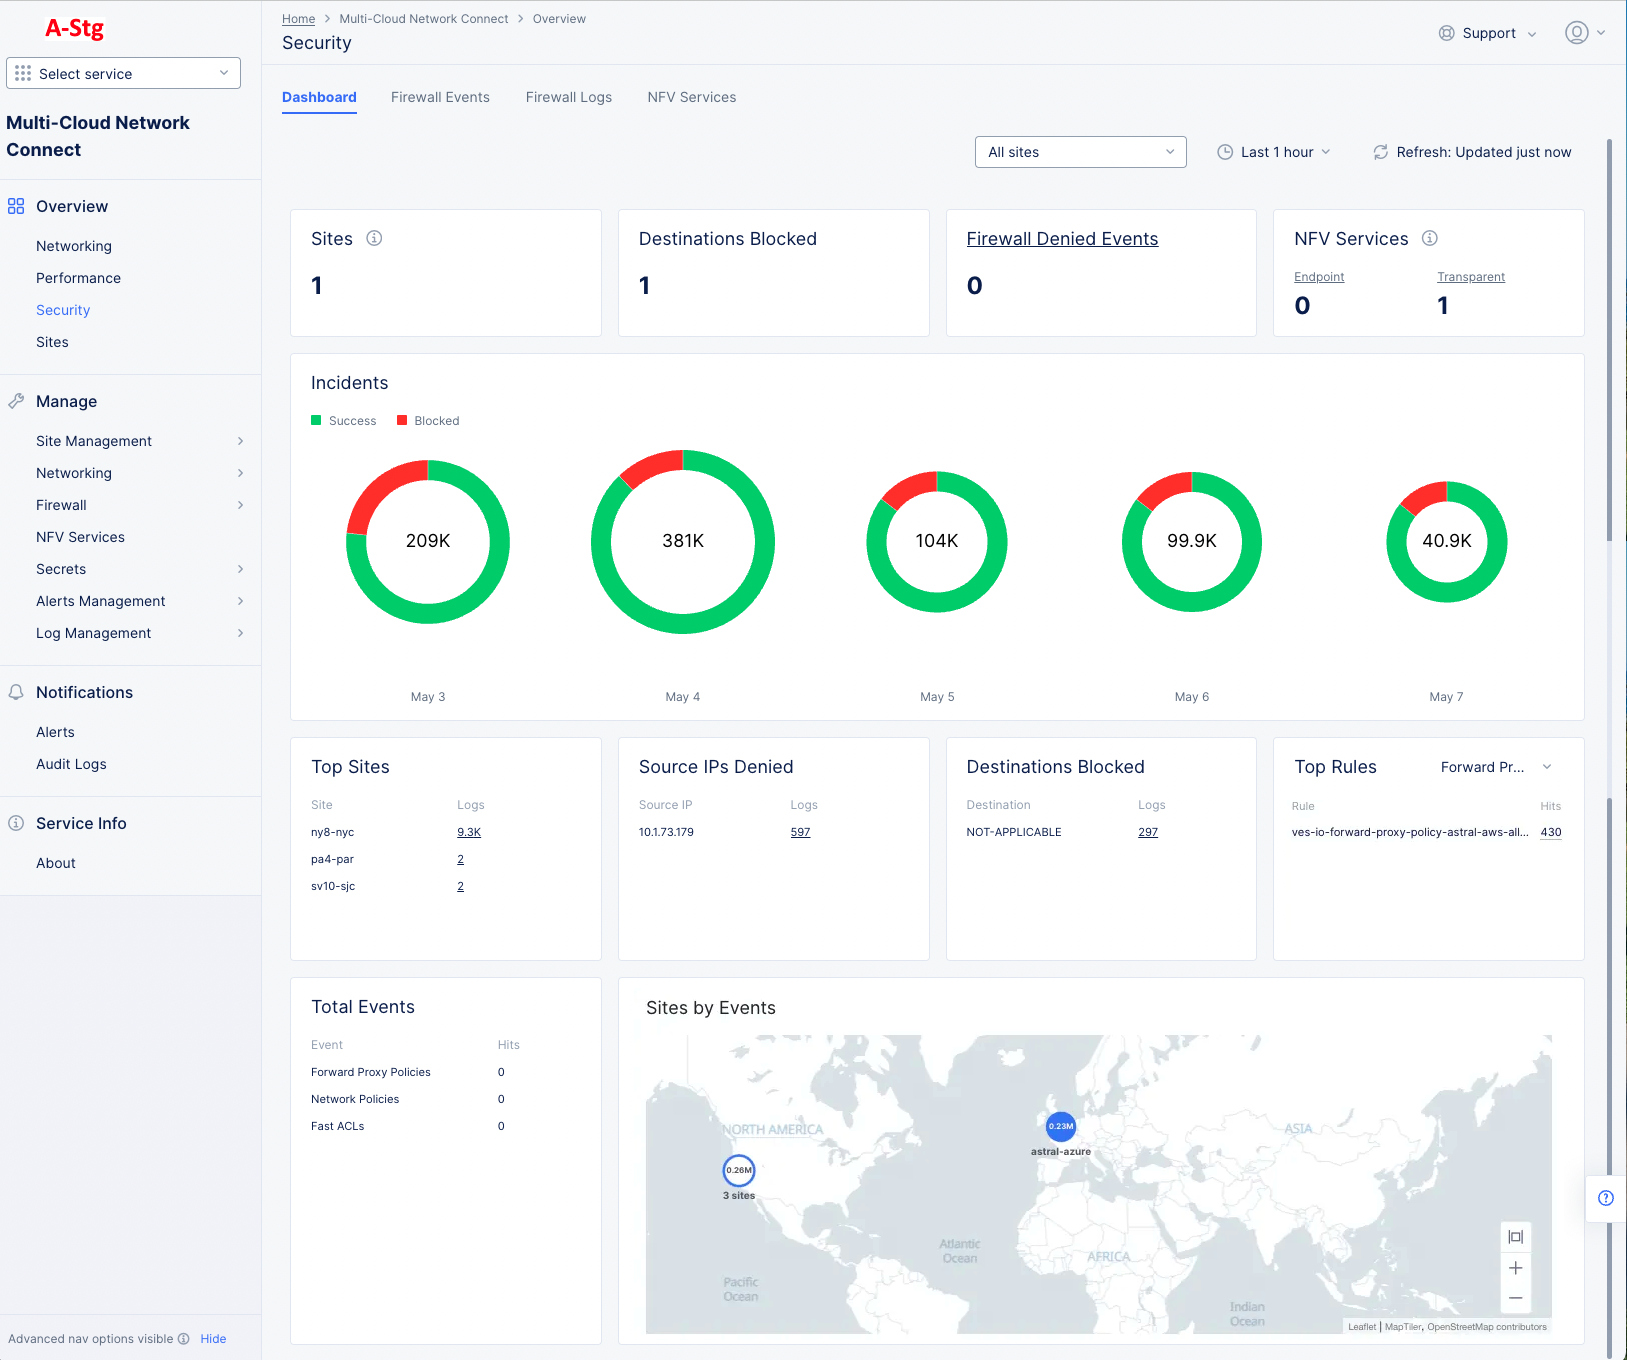
Figure: Site Firewall Dashboard
Dashboard Filters
The dashboard contents are dependent on the settings in the right-justified, top bar of options.

Figure: Dashboard content controls
- The sites drop-down determines which site(s) is shown in the dashboard. The default is All sites.
- The time drop-down allows you to specify the time frame for the data shown, including both quick-pick options like Last 24 hours and the ability to specify a custom time frame. Note that the data retention for some logs, such as firewall logs and event logs, is seven days.
- Click the Refresh button to update the contents of the dashboard manually.
Aggregate Statistics
The top row of summary sections contain counts for their respective section titles, giving you a quick overview of key firewall parameters.
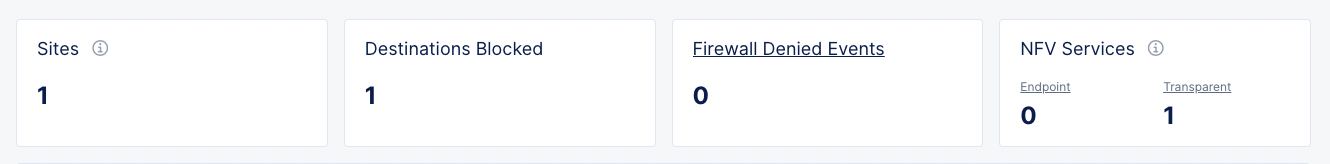
Figure: Aggregate Statistics
-
Sites shows the total number of sites reporting an issue. If you have selected a single site with the site dropdown, then the value will be either zero or 1 indicating whether or not the selected site has raised any alerts.
-
Destinations Blocked shows the number of specific client IPs that were blocked from accessing a destination for the specified site(s) and time frame.
-
Firewall Denied Events shows how many events were denied by the firewall for the specified site(s) and time frame. You can click on the section title to see the firewall events.
-
NFV Services shows number of services you have by type. You can click on Endpoint or Transparent to see the specific services of the respective type in the NFV Services tab.
Incidents
The Incidents section shows a donut chart for each of the last five days. The number at the center of the donut indicates the total ingress traffic for that day. The donut chart will show a green portion representing traffic that successfully passed through the firewall and a red portion representing the percentage of Blocked traffic—incidents. You can hover over a donut to see the actual number incoming requests broken down into of Success and Blocked quantities. See the example below. You can also click on the ring of a donut to see the logs view for the day represented by that donut chart.
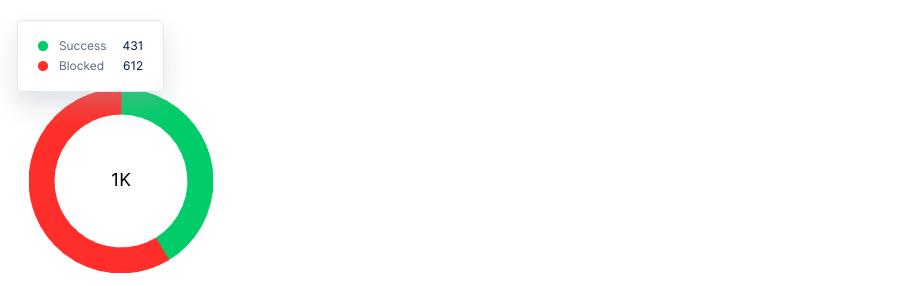
Figure: Incident donut graph
Logs
The next set of sections shows quantities of different categorizations from the log files.
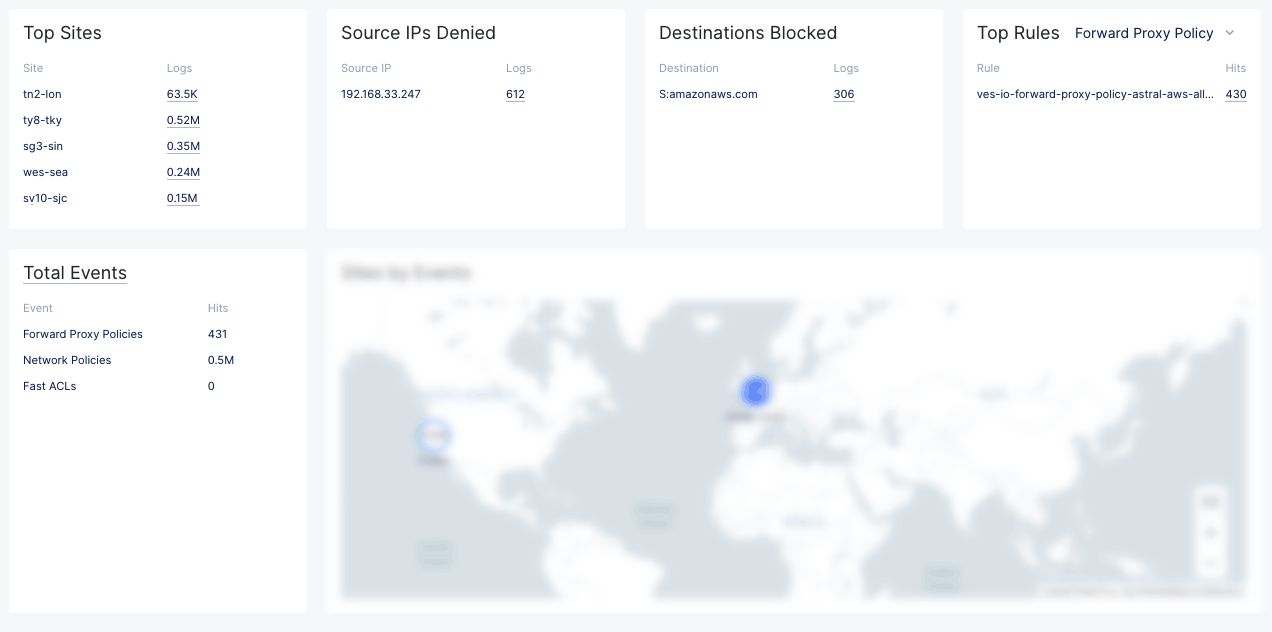
Figure: Log Summary Sections
-
Top Sites shows the sites in your tenant with the most traffic along with the associated number of log entries for each site. Click on a number in the Logs column to see traffic details for the corresponding site.
-
Source IPs Denied shows the IP addresses that were denied and how many times they were denied. Click on a number in the Logs column to see all the denials for the corresponding IP address.
-
Destinations Blocked shows the destination URLs that were blocked and how many times they were blocked. Click on a number in the Logs column to see all the individual denials for the corresponding URLs.
-
Top Rules shows the list of top rules within a policy that are being used by the firewall for the existing traffic. Select the desired policy type from the policy dropdown in the top right corner of the section. Then click on a number in the Logs column to see the list of events that was affected by the corresponding rule.
-
Total Events shows the number of hits per policy type. Click on Total Events to see a list of all events. This will show all content in the firewall logs.
Note: All logs are shared upon raising a request using the support ticket. For information on raising request, see Support Process.
Sites by Event
The Sites by Event section shows a world map with the sites in your tenant that have had events.
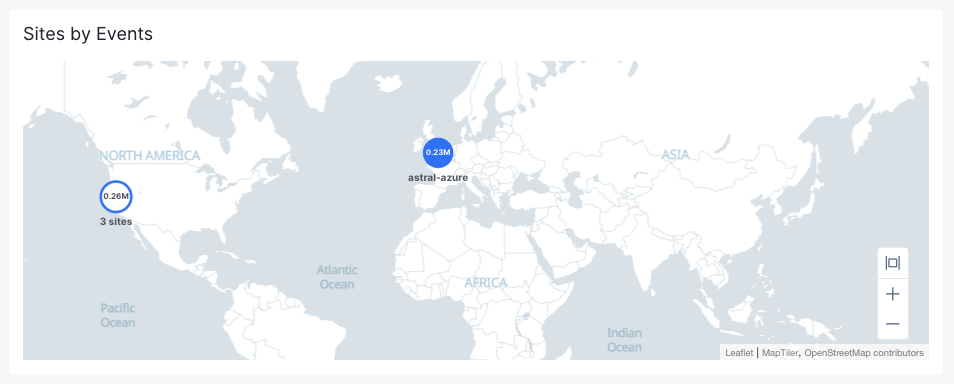
Figure: Sites by Events
The number of events is shown within the blue circle representing the site. If there are multiple sites close together, then a blue/white circle represents all the close-together sites, the number of sites represented is shown below the circle, and the number of events for all sites is shown within the circle. You can hover over either type of circle to see how many of the events were blocked.
Firewall Events
The Firewall Events tab provides a detailed view of all traffic going through the firewall.
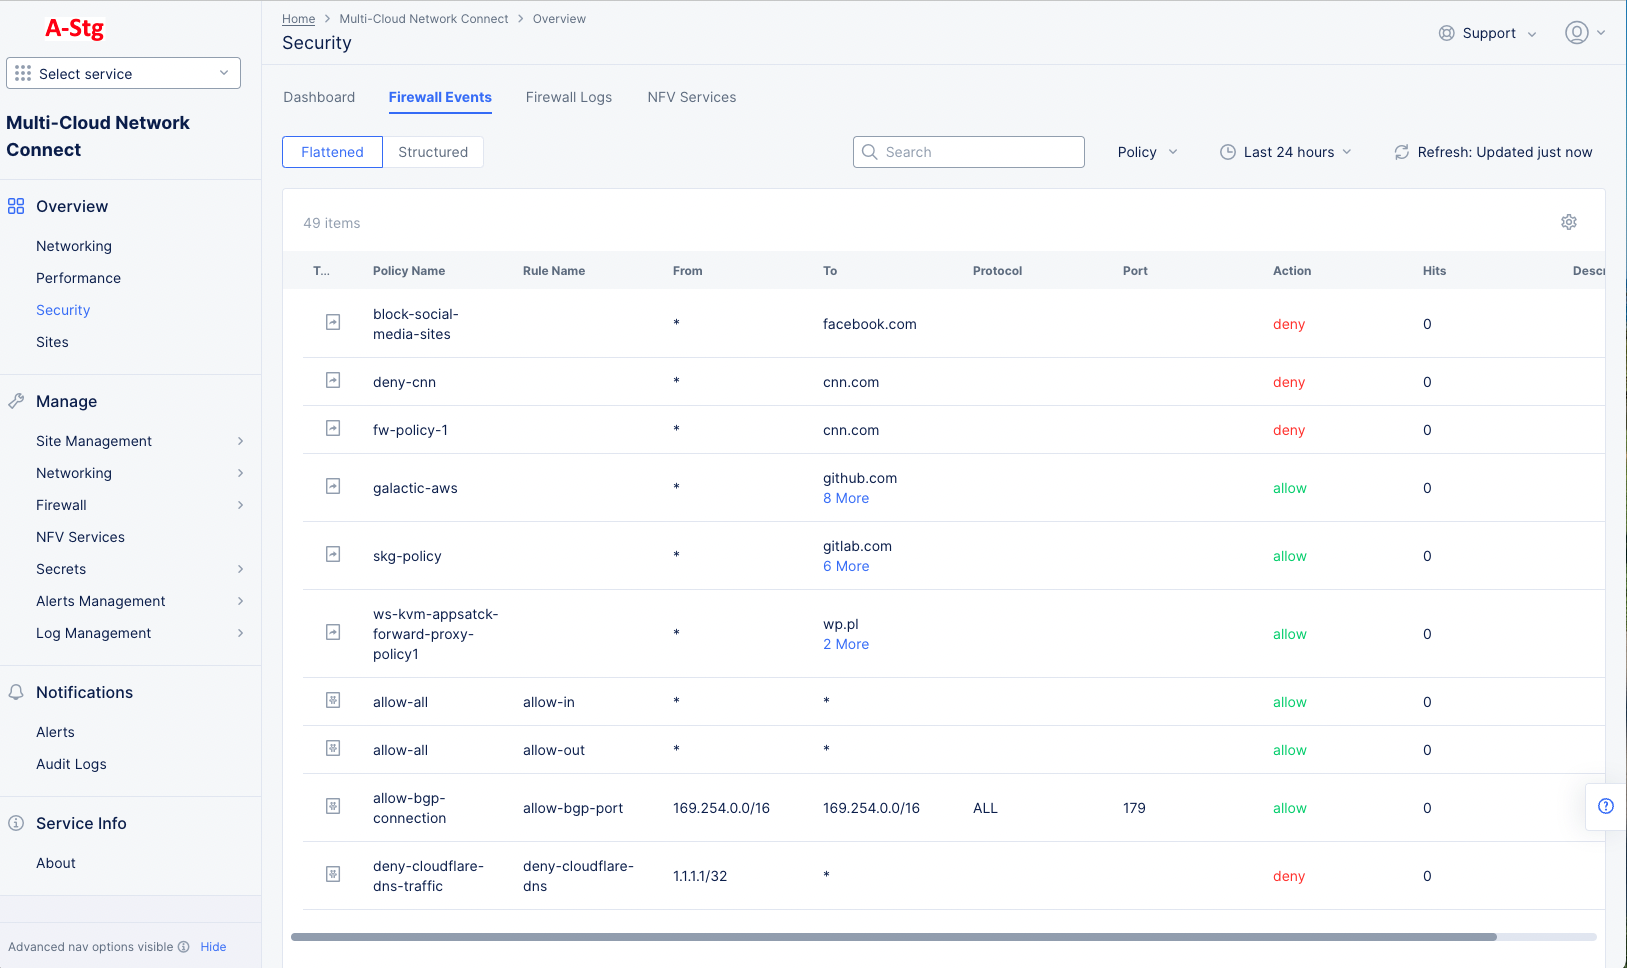
Figure: Firewall Events tab
Firewall Events Filters
Above the table are filtering options for choosing what data is shown and how it is shown:
- Choose Flattened to see all data in a single table or Structured to see separate tables by policy name.
- Search for content within the table, even if it's not shown on the current page.
- Use the Policy drop-down to only show selected policies. If no policies are selected (default), then all policies will be shown.
- Click Refresh to update the table with the latest traffic.
- Use the time drop-down to select the time frame for the data in the table. Choose from Last 5 minutes to Last 24 hours or specify a custom time frame.
Table Controls
Controls within a flattened table:
- The settings icon at the top-right allows you to select which columns are shown.
- Hover over a column name to see column options:
- Click on the column name to sort by that column. Click again to invert the sort.
- Drag a column border to change the width of a column.
- Drag the six-dot icon to move a column.
- Click on # More within the To column to expand an abbreviated row.
- At the bottom of the table, you can select the number of items shown per page and which page is shown.
Controls within a Structured table:
- Click the policy name or the down arrow to the far right of the policy name to expand the content giving one or two flattened tables, depending on the type of policy.
- Click the pencil icon to the right of a policy name to edit the policy.
Firewall Logs
The Firewall Logs tab provides a detailed view of the traffic that has passed through your firewall.
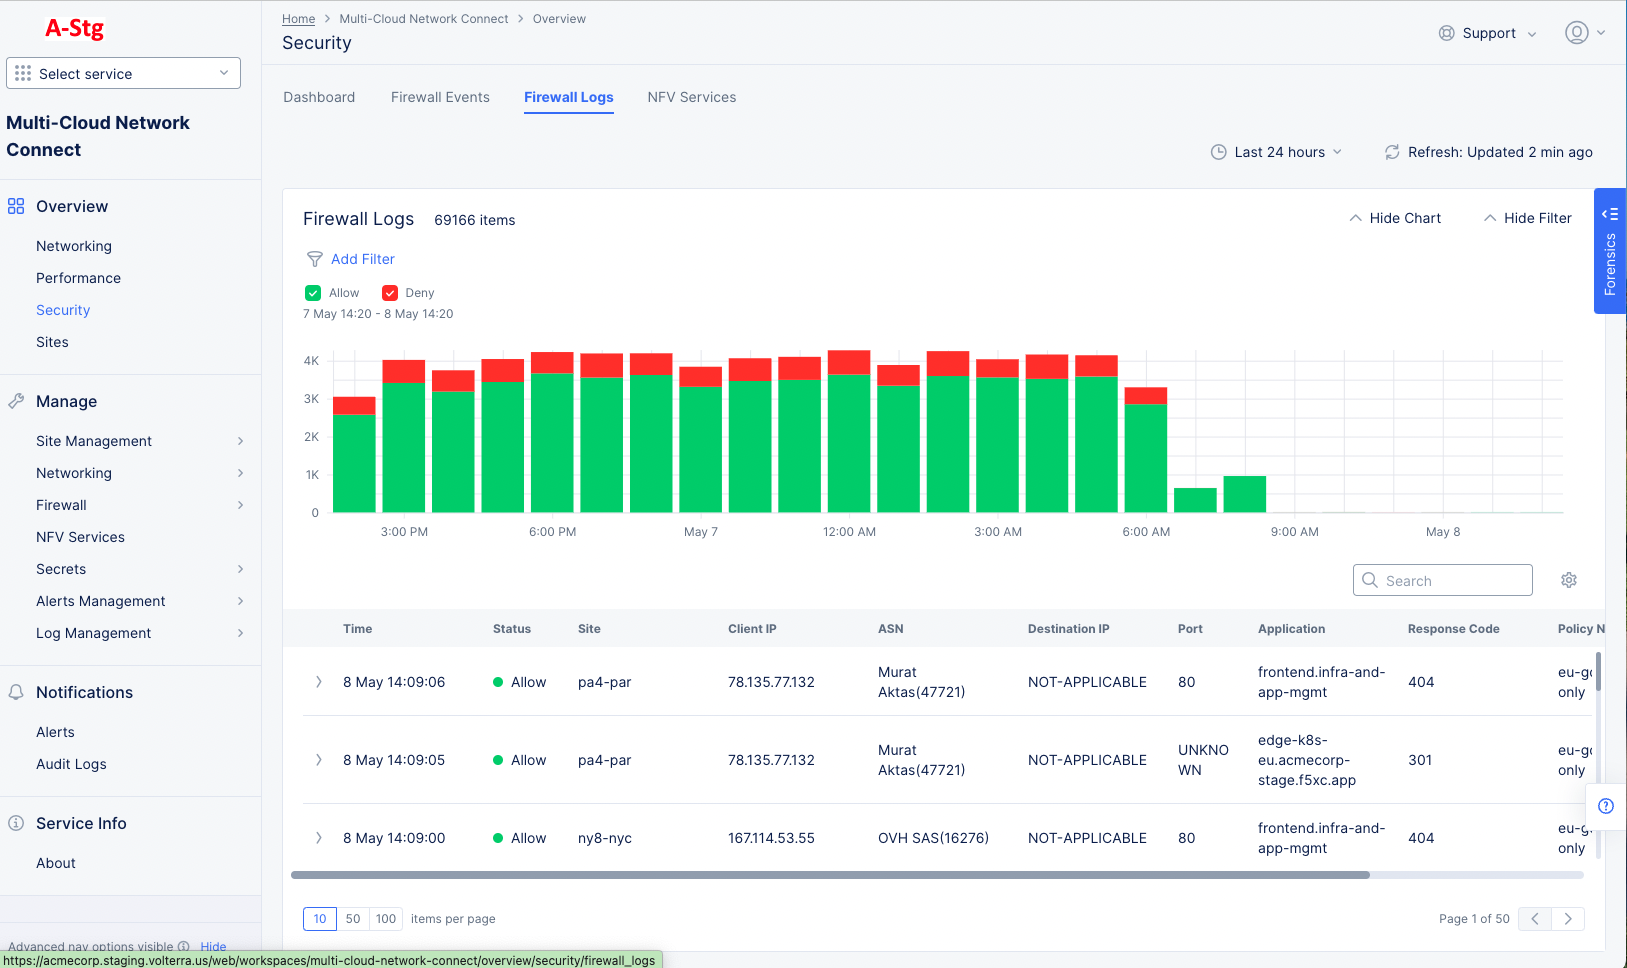
Figure: Firewall Logs tab
Firewall Logs Filters
The top of the table contains filtering options for choosing what data is shown and how it is shown:
- Click Refresh to update the chart and table with the latest traffic.
- Use the time drop-down to select the time frame for the data in the chart and table. Choose from Last 5 minutes to Last 24 hours or specify a custom time frame. Note that a custom time frame must be within the last 7 days, which is the log retention limit.
- Click the chart visibility button to toggle between Hide Chart and Show Chart. The chart is shown by default each time the Firewall Logs tab is opened.
- Click the filter icon to add a filter for the content shown in the chart and table.
- The Allow and Deny labels are quick filters that show (bright color) or hide (dim color) allowed and denied traffic.
Chart Controls
- Drag the gray vertical bars on the left and right sides of the chart to change the time frame for data in the chart and table.
- Hover over a column in the chart to see summary information for that column's time frame.
- Click on a column to zoom to that time frame. The chart and table will both reflect the new time frame, and the chart will further subdivide the time frame into a new set of smaller time frames represented as new columns.
Table Controls
- Search for content within the table, even if it's not shown on the current page. The filtered content will be used for both the chart and the table.
- The settings icon at the top-right allows you to select which columns are shown.
- Click on a column name to sort by that column.
- Hover over a column name to see column options.
- Click on the column name to sort by that column.
- Drag a column border to change the width of a column.
- Drag the six-dot icon to move a column.
- At the bottom of the table, you can see the number of items per page and which page is shown.
Forensics view
The blue, vertical Forensics button at the top right of the page pulls out a slide panel showing some statistical information and give you another way to filter the logs display.
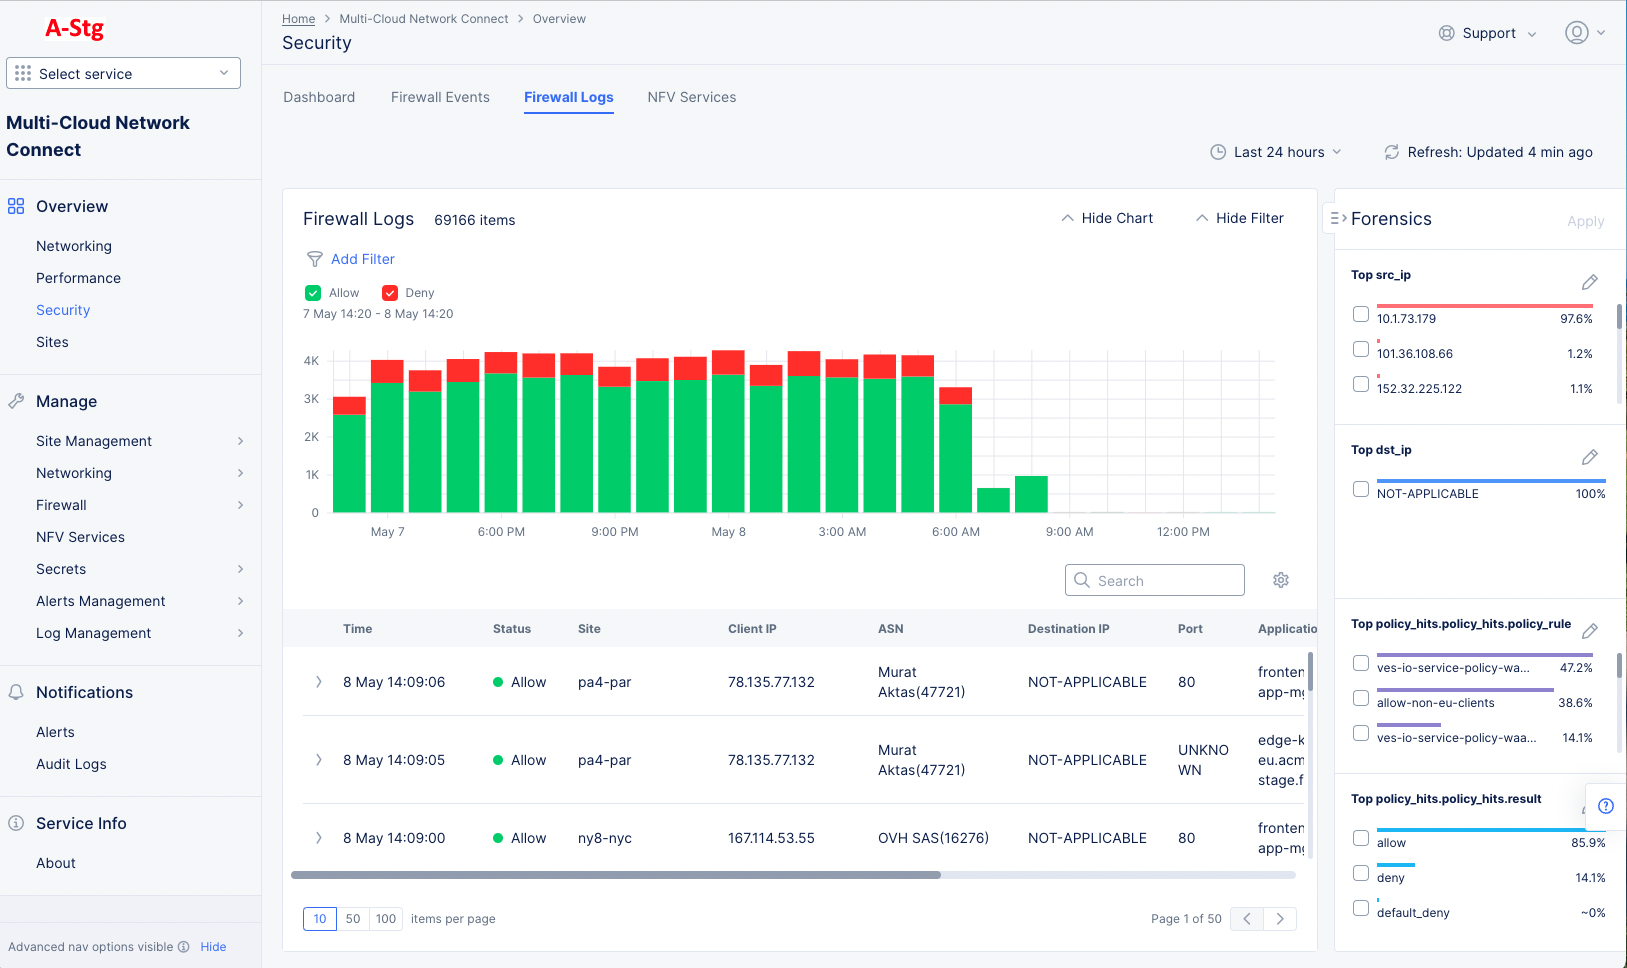
Figure: Firewall Logs Forensics
The Forensics panel contains four boxes, each showing a metric as the box title and then percentages for their respective metric elements. For instance, a box with the title Top src_ip will show a list of source IP addresses along with a percentage of their activity within the logs.
Controls within the Forensics panel:
- Check a box next to an element or percentage bar to select the element. Click Apply at the top right of the Forensics panel to show only firewall log data related to that element. You can select multiple elements from the same or separate boxes to apply.
- Click the pencil icon at the top right of any box to change the metric for that box. Note that the metric of each box must be unique, so if you select a duplicate metric, the duplicate will be changed to an unused metric.
NFV Services
The NFV Services tab provides a list of your NFV services with each entry showing some traffic information and alert counts for that service.
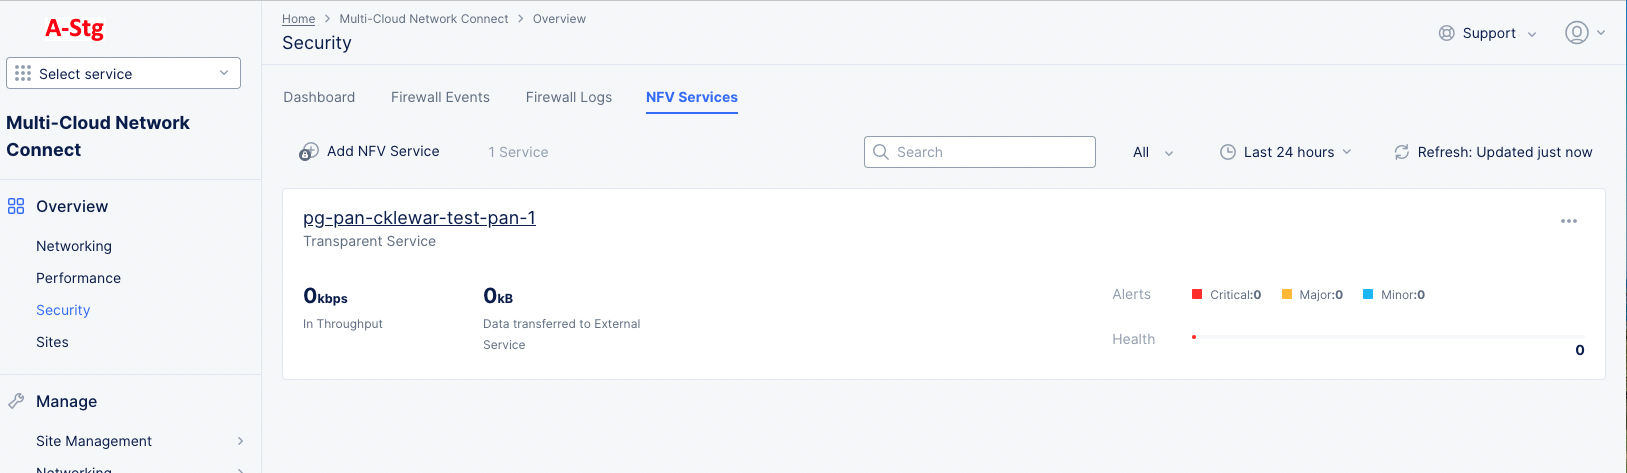
Figure: NFV Services Overview
NFV Services tab actions
- Click Add NFV Service to add a new service. Not all roles have the ability to add a new NFV service.
- Enter a string in the Search field to only show services containing that string.
- Use the service type drop-down menu to select the types of services you want displayed in the table. The default is All, and you can optionally select Endpoint Service or Transparent Service.
- Use the time drop-down menu to select a time frame to use for the Alerts display.
- Click Refresh to update the Alerts display manually.
- Click the service name to see the security dashboard for this service.
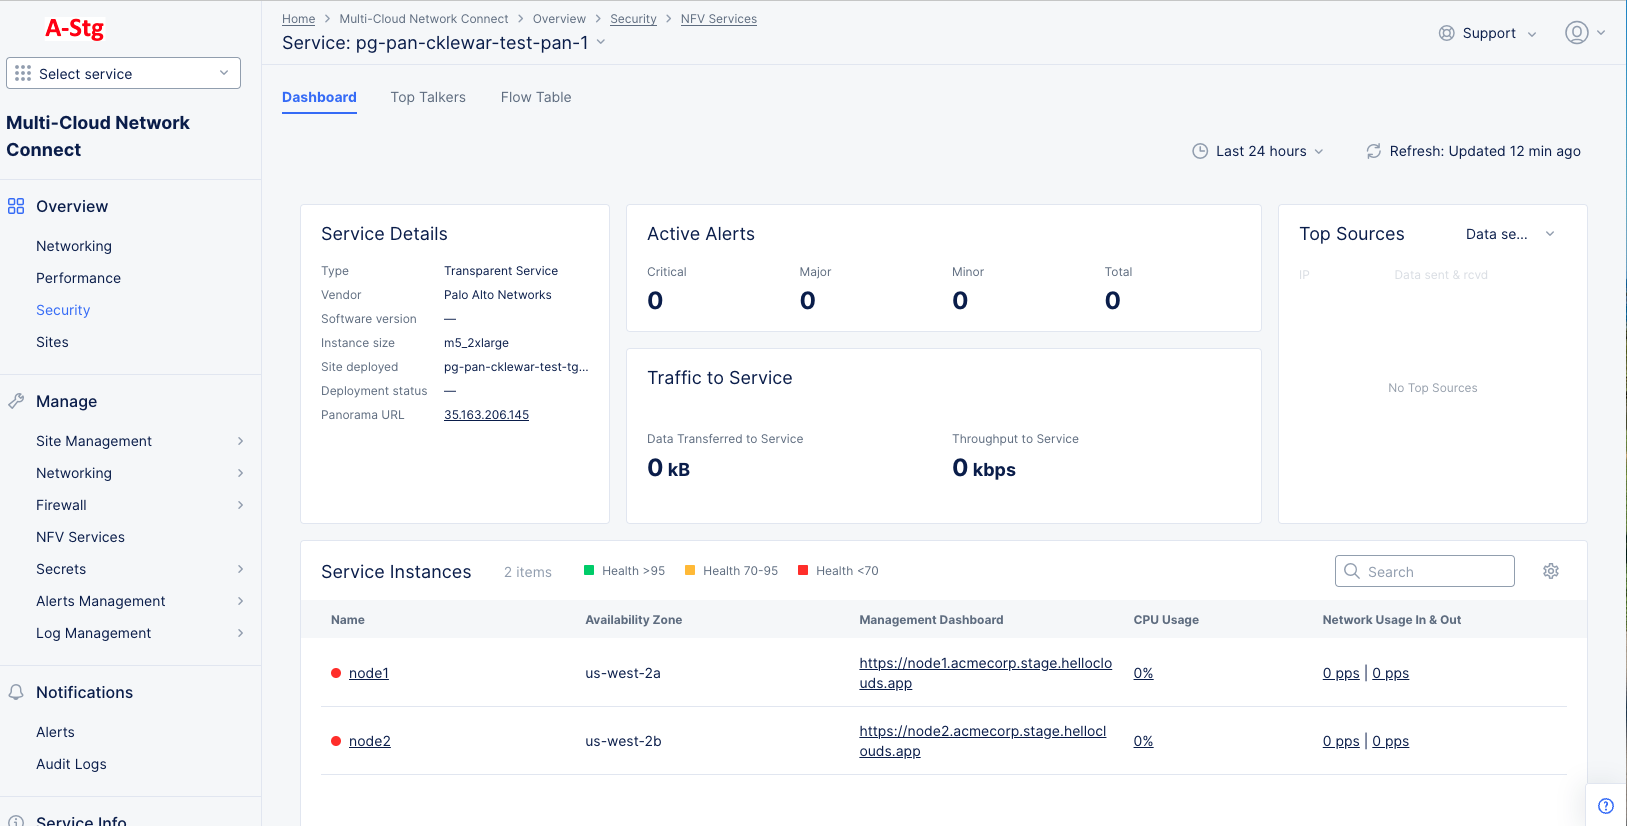
Figure: NFV Services Security Dashboard
- The Dashboard gives an overview of the service, alerts, traffic, top sources, and service instances.
- The Top Talkers tab provides more details on the service's traffic, including top 10 sources, destinations, applications and flows.
- The Flow Table tab provides details on how traffic is flowing through the service.