Monitor Managed K8s
Objective
This document provides instructions on how to monitor your managed K8s cluster using F5® Distributed Cloud Console. To know more about Managed K8s, see Create and Deploy Managed K8s.
Using the instructions provided in this document, you can view the various dashboard views associated with your managed K8s cluster and take appropriate steps as per your requirement to enhance its functioning or deliver corrective actions.
Prerequisites
-
An F5 Distributed Cloud Account. If you do not have an account, see Getting Started with Console.
-
A managed K8s cluster with apps deployed. See Create and Deploy Managed K8s for more information.
Monitor Managed K8s Cluster
Log into the Console and perform the following actions:
Find Managed K8s Cluster Site
-
In the Distributed Apps workspace, select System from the Namespace drop-down menu.
-
Click Managed K8s > Overview.
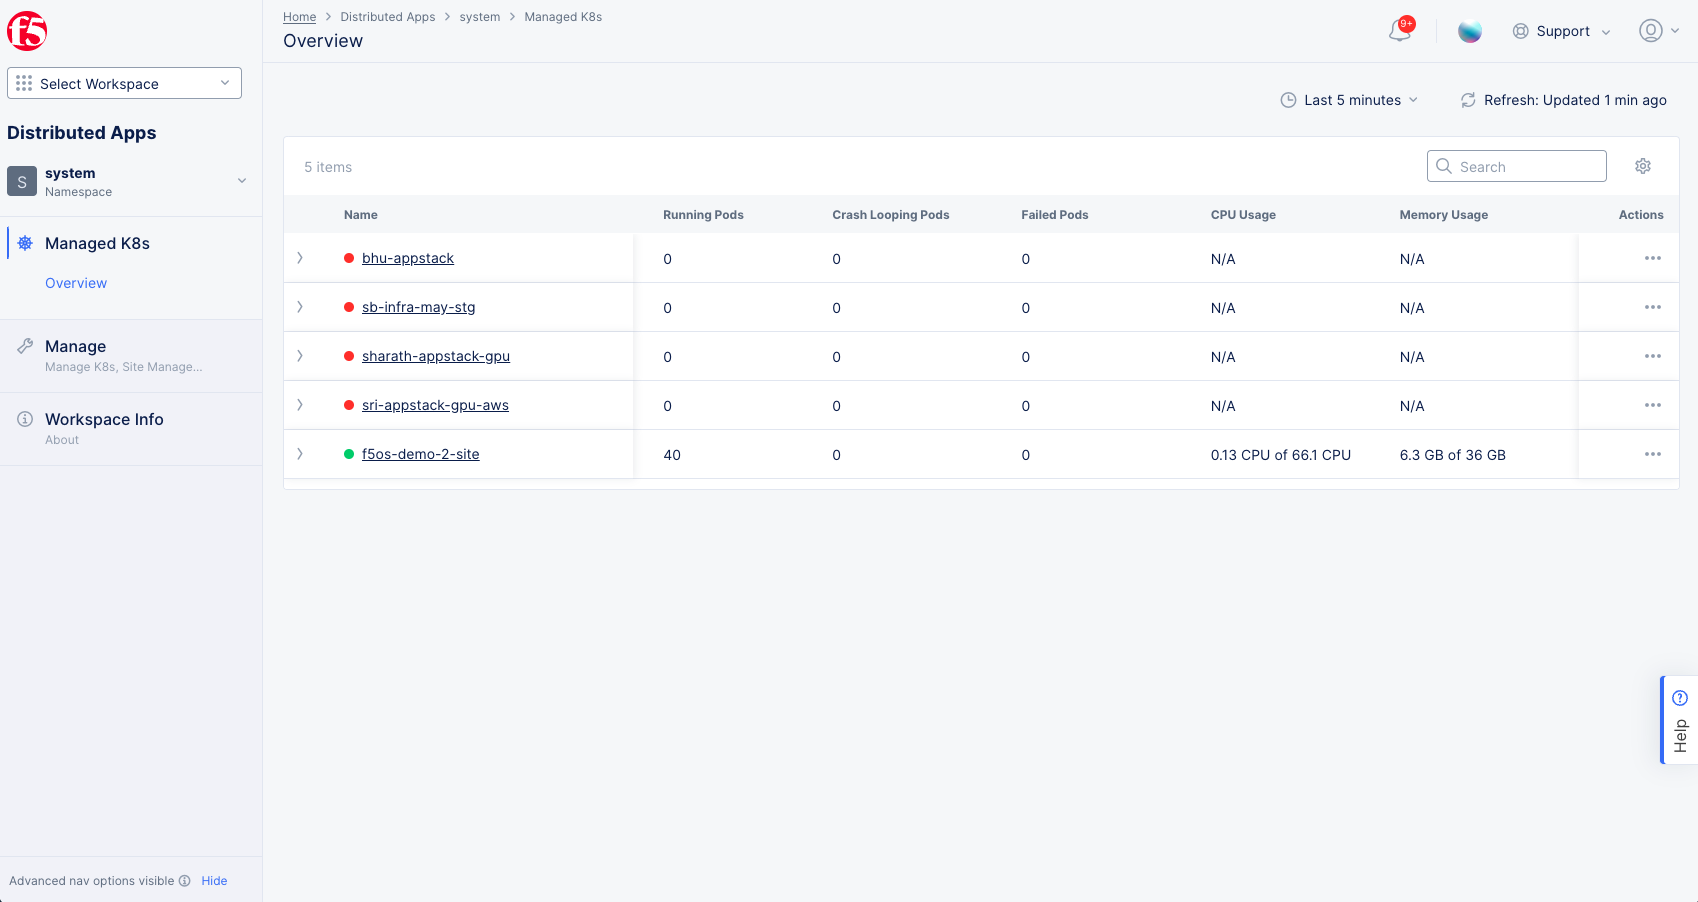
Figure: Managed K8s Overview
- Click the name of the managed K8s you want to monitor.
Note: The monitoring option is only visible if you have an App Stack site with a K8s cluster enabled.
Explore Managed K8s Cluster
The K8s cluster monitoring shows a dashboard view for the K8s cluster and also individual views for associated K8s resources such as deployments, services, jobs, etc.
Some or all of the following utilities are available on the individual tabs. They can be helpful in filtering the display:
-
Managed K8s cluster monitoring provides one or all of the following filters for the various tabs. Click on a filter and select a value from the available list to filter the page display accordingly. You can apply a combination of filters to view information as needed.
- Local Namespace - Select one or more namespaces from the list to display information for the selected namespaces.
- Deployment - Select one or more deployments from the list to display information for the selected deployments.
- Status - Select one or more status values from the list to display information for the selected status values.
-
On the upper right side of a page, you may find options for Search, the time interval selector, Refresh, and ⚙ (gear icon). For some pages, there may be only a few of these options, and for other pages, all these options may be present. You can use these options to set your display preferences or filter the display for a condition or refresh the display.
Note: Click > located on the left side of a listed entry in any tab to display its details in JSON format.
Go through the following list for information on each view.
Dashboard: Inspect the managed K8s dashboard page.
Monitoring of managed K8s cluster displays dashboard page by default. This page shows the snapshot view for the following K8s entities:
- Pods - Shows the pods of this cluster and they are shown grouped as per their status. Click on Pods to switch to the Pods tab for more information.
- VM Intances (VMIs) - Shows the virtual machine instances for the cluster. Click on VM Instances (VMIs) to switch to the Virtual Machine Instances tab for more information.
- Resources - Shows the snapshot view of K8s app resources: Deployments, Stateful Sets, Jobs, Services, and Virtual Machines. Click on any of the resources to switch to its respective tab view.
- Nodes - shows the number of nodes on the site and their statuses. Click on Nodes to switch to the Nodes tab for more details.
- CPU Usage
- Memory Usage
- Storage
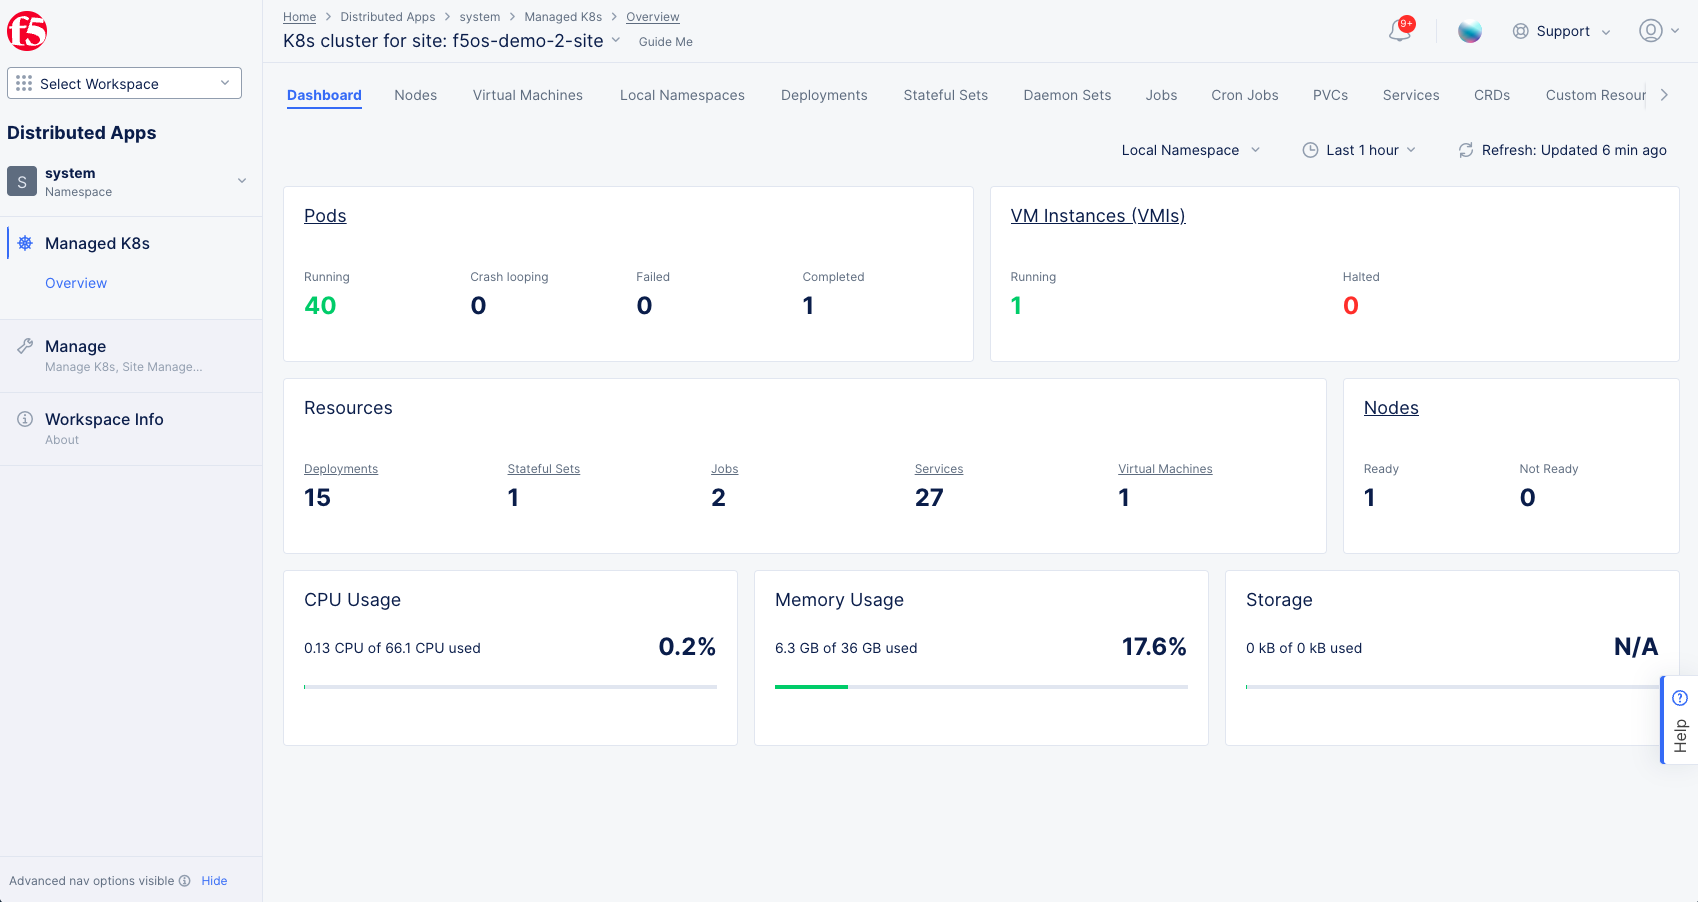
Figure: Managed K8s Dashboard View
Note: Click on the Namespace drop-down list and select a namespace to display the dashboard view only for that namespace. You can select multiple namespaces and the dashboard shows aggregate data. Data for all namespaces is displayed by default.
Nodes: Inspect nodes view.
- Click the Nodes tab to view the nodes of your cluster site.
- Click > for a node to display the status of each node in JSON format.
Virtual Machines: Inspect virtual machines view.
- Click the ... > Show events or Show conditions in the actions column to get virtual machine status information.
- Click ... > Start, Stop, or Restart to affect the running status of the virtual machine. Note that only applicable commands will be shown, e.g. if the VM is running, then the only options are Stop and Restart.
Note: You can use a CLI tool for more VM interactions. See the Manage PK8s with VMs section in Create and Deploy Managed K8s.
Local Namespaces: Inspect namespaces view.
- Click the Namespaces tab to view the list of namespaces in your cluster and associated information. This view also shows the K8s resources in each namespace such as deployments, jobs, services, etc.
- Non-zero entries in the table are short cut links to other tabs that resource monitoring tab filtered for that namespace. For example, if you click on Pods value for the monitoring namespace, the view switches to Pods tab showing the pod details in the monitoring namespace.
Deployments: Inspect deployments.
- Click the Deployments tab to display the list of deployments for each namespace. The deployments page also shows information on pods, sites, and upgrade for each deployment in a namespace. Click > for a deployment to display its details in JSON format.
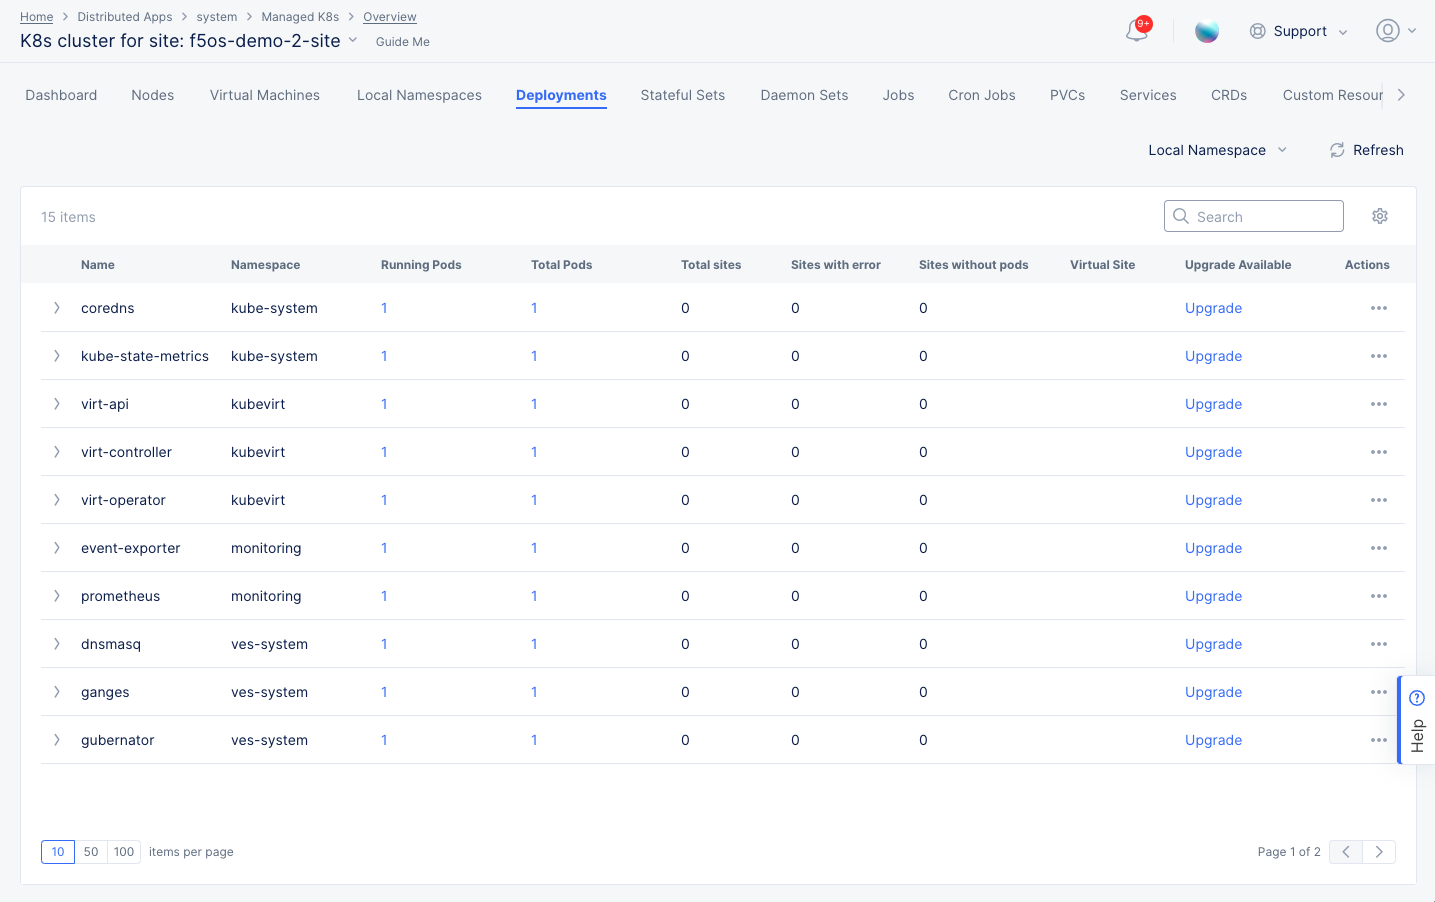
Figure: Managed K8s Deployments View
-
Click a value in the Running Pods or Total Pods column to see more information about your selection in the Pods tab.
-
Click Upgrade in the Upgrade Available column for any deployment to upgrade the deployment. The Update images window slides in showing the list of containers and images. Do the following:
- Click ... > Edit for an image, enter the image version in the new version window, and click Save.
- Click Save in the update images window.
-
Click ... and view events or conditions for a deployment as per the following guidelines:
- Select Show events to display list of recent events related to that deployment. Events within the last 24 hours are displayed by default. Click Last 24 hours drop-down list to select another interval or select Custom to set a custom interval.
- Select Show conditions to display a list of current conditions for that deployment.
- Click > for an event or condition to display its details in JSON format.
-
Click a non-zero numeric value in any column to see details for that item. For instance,
Note: Click on any non-zero value of pods or sites to open the pods page filtered for that namespace.
Stateful Sets: Inspect StatefulSets.
- Click the Stateful Sets tab to view the list of StatefulSets and associated namespaces. This view also shows the number of total and running pods related to each StatefulSet.
- Click on any non-zero value of pods to open the pods page filtered for that namespace. Pods related to the StatefulSet in that namespace are displayed.
- Click > for a StatefulSet to display its details in JSON format.
Daemon Sets: Inspect Daemon Sets.
- Click the Daemon Sets tab to view the list of DaemonSets and associated namespaces. This view also shows the number of total and running pods related to each DaemonSet.
- Click on any non-zero value of pods to open the pods page filtered for that namespace. Pods related to the DaemonSet in that namespace are displayed.
- Click > for a DaemonSet to display its details in JSON format.
Jobs and Cronjobs: Inspect Jobs and Cronjobs.
- Click the Jobs or Cronjob tab to view the list of jobs and associated namespaces. This view also shows the number of total and completed pods related to each job or cronjob.
The following is a sample image for the jobs view. Cronjobs display is similar to the jobs view.
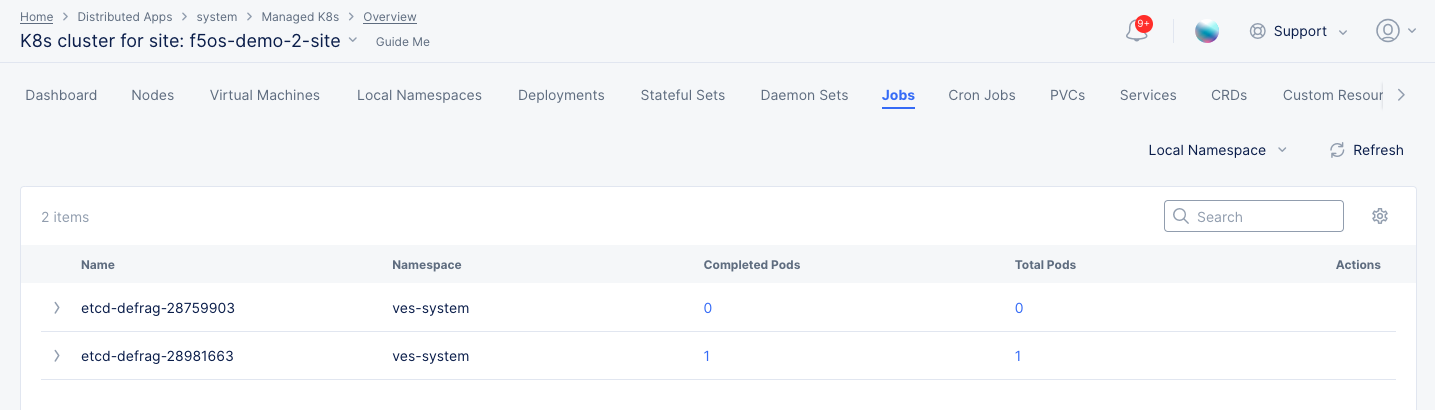
Figure: Managed K8s Jobs View
- Click on any non-zero value of pods to open the pods page filtered for that namespace. Pods related to the job or cronjob in that namespace are displayed.
- Click > for a job or cronjob to display its details in JSON format.
PVCs: Inspect PersistentVolumeClaims (PVCs).
- Click the PVCs tab to view the list of PVCs and associated namespaces. This view also shows volumes, resource, and resource version columns for each PVC.
- Click on any non-zero value of volumes to see the information for each volume. The information displayed includes the storage capacity of the volume, host path, and access modes. Click > for a volume entry to display its details in JSON format.
- Click > for a PVC to display its details in JSON format.
Services: Inspect services.
- Click the Services tab to display the list of K8s services and the namespaces in which they are deployed. This page also shows columns such as type, endpoints, ports, age, etc. Click > for a service entry to display its details in JSON format.
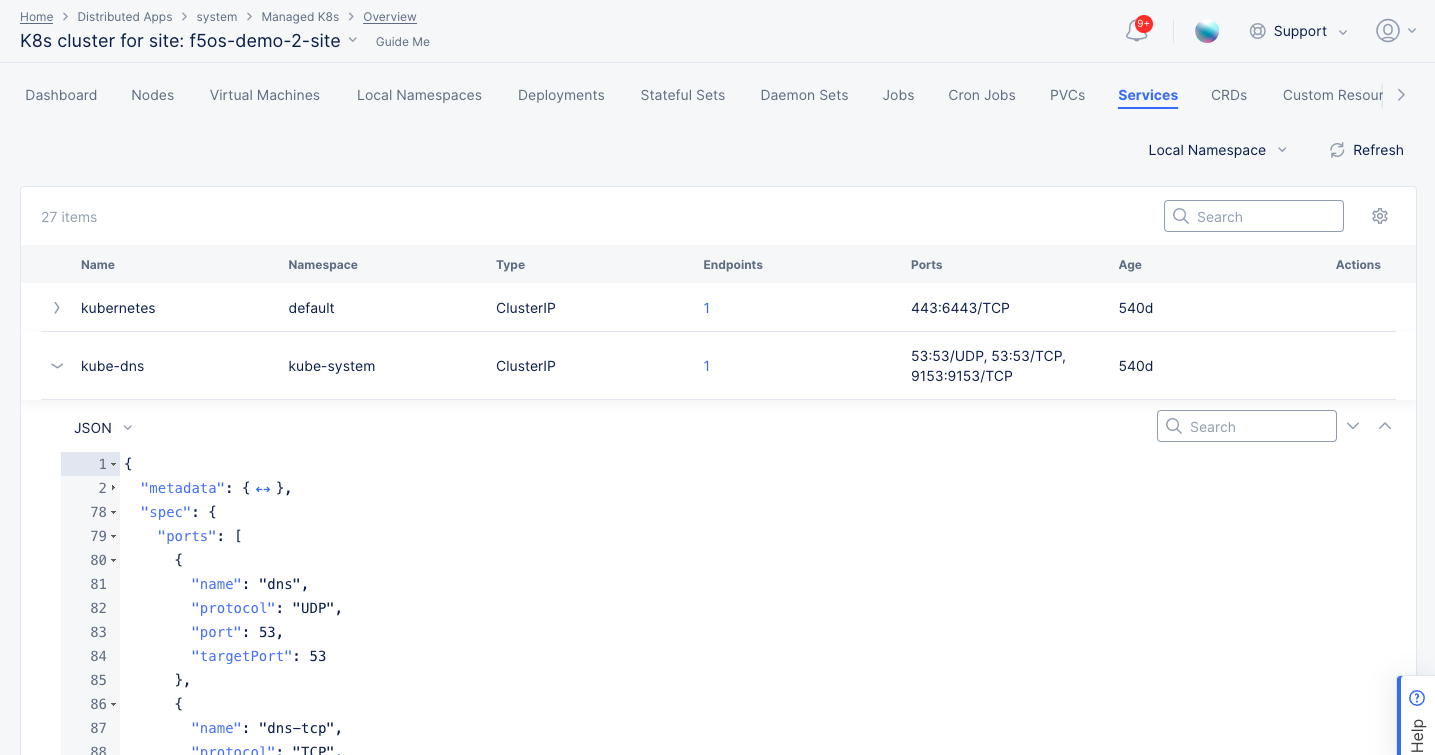
Figure: Managed K8s Services View
- Click on any non-zero value of Endpoints column to view the endpoints information in a slide-in window. Click > for any endpoint entry to display its details in JSON format.
CRDs & Custom Resources: Inspect Custom Resource Definitions and Resources.
-
Click the CRDs or Custom Resources tab to view the list of Custom Resource Definitions or Custom Resources and their associated status information.
-
Click > for a name in the list to display its details in JSON format.
ConfigMaps: Inspect ConfigMaps.
-
Click the Configmaps tab to view the list of ConfigMaps and associated namespaces. This view also shows datacount and age fields for each ConfigMap.
-
Click > for a ConfigMap to display its details in JSON format.
Secrets: Inspect secrets.
-
Click the Secrets tab to view the list of secrets and associated namespaces. This view also shows UID and age fields for each secret.
-
Click > for a secret to display its details in JSON format.
ReplicaSets: Inspect ReplicaSets.
-
Click the Replica Sets tab to view the list of ReplicaSets and associated namespaces. This view also shows UID and age fields for each ReplicaSet.
-
Click > for a ReplicaSet to display its details in JSON format.
VMIs: Inspect virtual machine instances.
- Click on a value in the Status column to see all container statuses for that pod.
- Click on a name in the Pod column to see pod details for that name in the Pods tab.
- Click the ... > Show events or Show logs in the actions column to get virtual machine status information.
Pods: Inspect pods.
-
Click the Pods tab to display the list of pods and associated namespace. This page also shows columns such as its node, number of restarts, status, resource consumption, etc. Click > for a pod to display its details in JSON format.
-
The column Resource shows resource consumption for CPU and memory. It also displays trend in graphical format and hovering over any point on the trend curve shows the time and the consumption at that point of time.
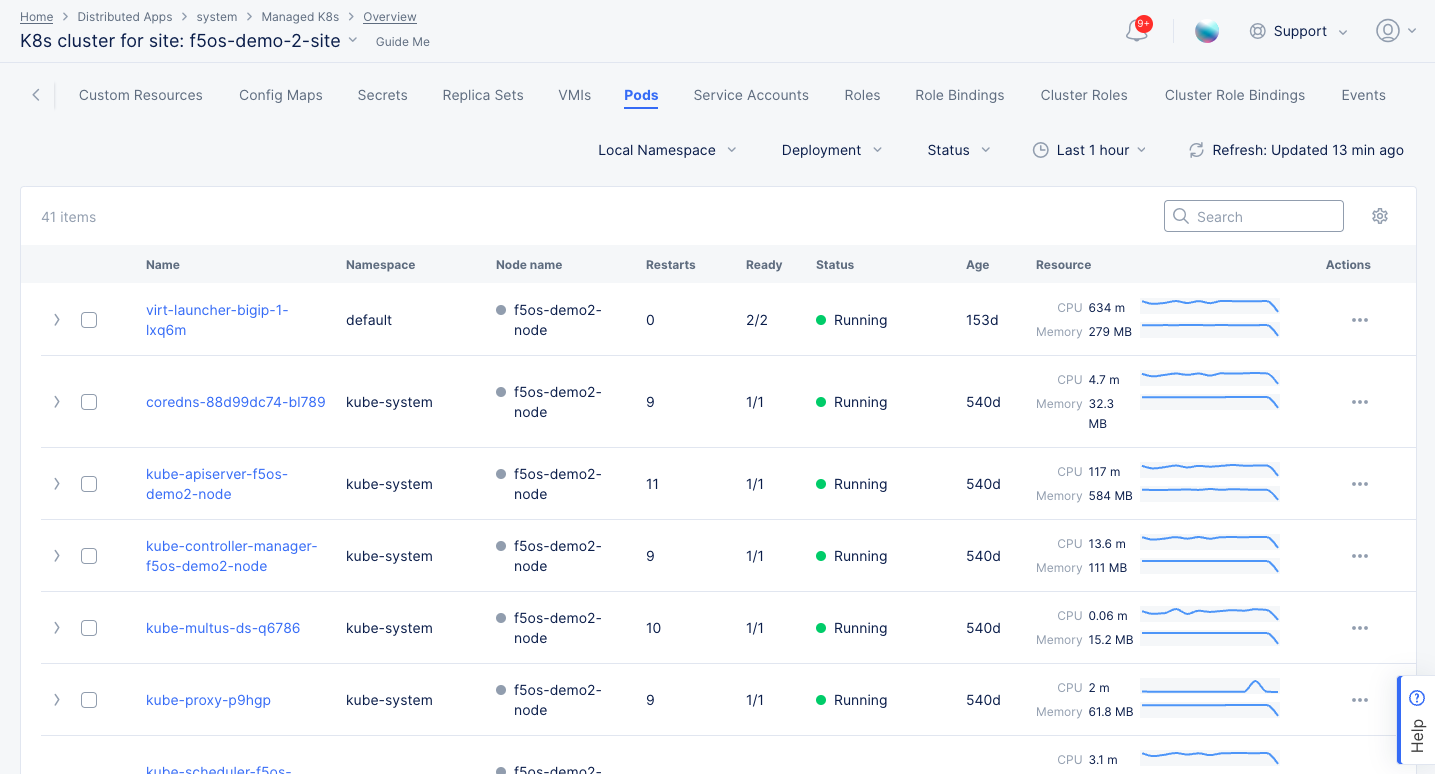
Figure: Managed K8s Pods View
- Click on any pod name in the Name column to view the following pod information in a slide-in window:
- The Events tab shows the pod related event list. You can filter the list to display specific events using the search option or time interval option.
- The Logs tab shows the logs related to a pod selected using the Container to show logs from field. You can also search for a specific keyword using the search option in this view.
- The Terminal tab allows you to execute a command for specific container selected using the Container to exec to option. Enter your command in the Command to execute field and click Connect.
- The Resource Utilization tab shows the CPU, memory, and disk utilization. This page shows container name, usage, requests, request percentage, limits, limits percentage, and graph for the resource utilization over a period of time. Data is displayed for the past 24 hours by default. You can select a specific time interval or another custom 24-hour period using the time interval option. Hovering over any point on the trend curve shows the time and the consumption at that point of time.
Note: You can view the above data also by selecting the ... menu for any pod.
- Click > for a container to display its details in JSON format.
Service Accounts: Inspect service accounts.
-
Click the Service Accounts tab to view the list of service accounts and associated namespaces. This view also shows UID and age fields for each service account.
-
Click > for a service account to display its details in JSON format.
Roles & Role Bindings, Cluster Roles & Cluster Role Bindings: Inspect roles and role bindings, cluster roles and cluster role bindings.
-
Click the Roles, Role Bindings, Cluster Roles, Cluster Role Bindings tabs to view their respective roles and bindings. This view also shows the associated namespace, UID, and age columns.
-
Click > for a role, role binding, cluster role, or cluster role binding to display its details in JSON format.
Events & Audit Logs: Inspect events and audit logs.
- Click Events and Audit Logs tabs to view the graphs/histograms of events and audit logs respectively. This view also shows the same data in list format beneath the graphs.
The following image shows events view. View for the audit logs page is similar to this view.
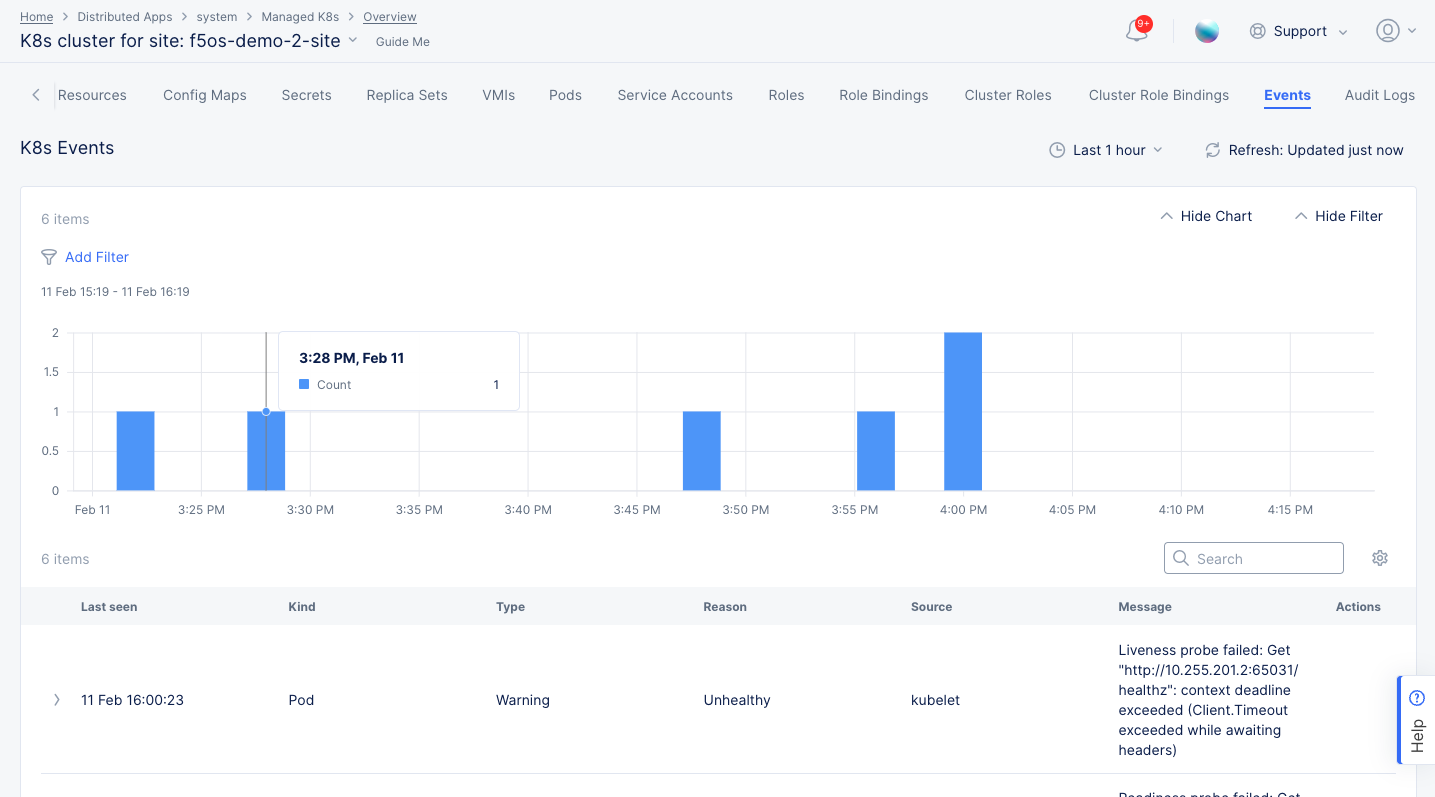
Figure: Managed K8s Events View
- Hover over any bar to view the start time and count of events/audit logs captured for that time interval.
Note: You can use the time interval filtering option on the upper right side to display data for a specific predefined interval or a custom 24-hour interval. Data retention for events is limited to 7 days.
- Click > for an event or audit log list entry to display its details in JSON format.
Note: Click Refresh on the top right side of any page to refresh the information displayed on the page. Next to the Refresh option, there is a drop-down option for some pages to set the time interval over which the view shows the data. You can select from pre-defined options or a set a custom interval for specific dates.