Monitor Application Firewall
Objective
This document provides instructions on how to monitor your application firewall. F5 provides support to monitor your application for security. To know more about how F5 secures your applications, see Security.
Using the instructions provided in this document, you can check the rules hit statistics and security events for your virtual host.
Prerequisites
-
An F5 Distributed Cloud Account. If you do not have an account, see Getting Started with Console.
-
An HTTP load balancer with rule-based application firewall enabled.
Monitor the Application Firewall
Monitoring your application firewall consists of inspecting application firewall and security events.
Step 1: Select the namespace where the app firewall and virtual host are created.
-
Log into VoltConsole.
-
Click
Multi-Cloud App Connect. -
Select your namespace from the drop-down menu.
Step 2: Navigate to the load balancer for which the WAF is enabled.
-
Click
Virtual Hosts>HTTP Load Balancers. -
From the displayed list of load balancers, click on
Security Monitoringfor your load balancer. TheDashboardpage is displayed by default.
Step 3 Inspect the dashboard for WAF events.
-
Inspect the
Security Eventssection to view the snapshot of security events. This displays a list of security events in the last 12 hours by default. -
Click on any event to load its full information.
-
Inspect the
Top WAF Rules Hitsection to check the WAF rule hit statistics. -
Inspect the
Security Events by Locationsection to view the security events arranged in a map view. You can click on the location with hits to load theSecurity Eventspage. -
Inspect the
Recent WAF and Policy Eventssection to view the list of recent WAF events.
Step 4: Inspect security events.
Click on the Security Events tab. This shows various types of security events over default time frame of 12 hours in a graph view. This page also displays filters various types of events that are represented in different colored dots. Beneath the graph, the security event page displays the events in a list arranged into different tabs namely Security Events, Malicious User Events, and DDoS Events.
-
Perform the following to inspect various security events:
-
Click on a dot to select or deselect those events from being displayed.
-
Click on the
Add Filteroption and select a key-value pair to apply specific filters. You can select available key-value pairs. You can also choose a custom entry. Type a key, clickSelect Custom Key, type a value, and clickSelect Custom Valueto apply a custom filter. -
Click on the time interval drop-down menu on the top right side of the page to select another time interval or specify a custom interval.
-
Security Events Inspect security events sub-page.
-
Click the
Security Eventstab beneath the graph chart to view the list of security events. The following list provides information on each field of the list:-
Time: Time the event was created.
-
Country,City: Location of the event.
-
Src IP: Source of the suspicious request.
-
Method: Method type of the HTTP request (GET, POST, DELETE, PUT, etc.)
-
Rsp Code: The HTTP response code (200, 403,404, etc.).
-
Rules Hit: Number of rules hit.
-
Authority: Load balancer domain.
-
Request Path: String of characters that unambiguously identifies a particular resource (for example,
/testcase-6/test.com).
-
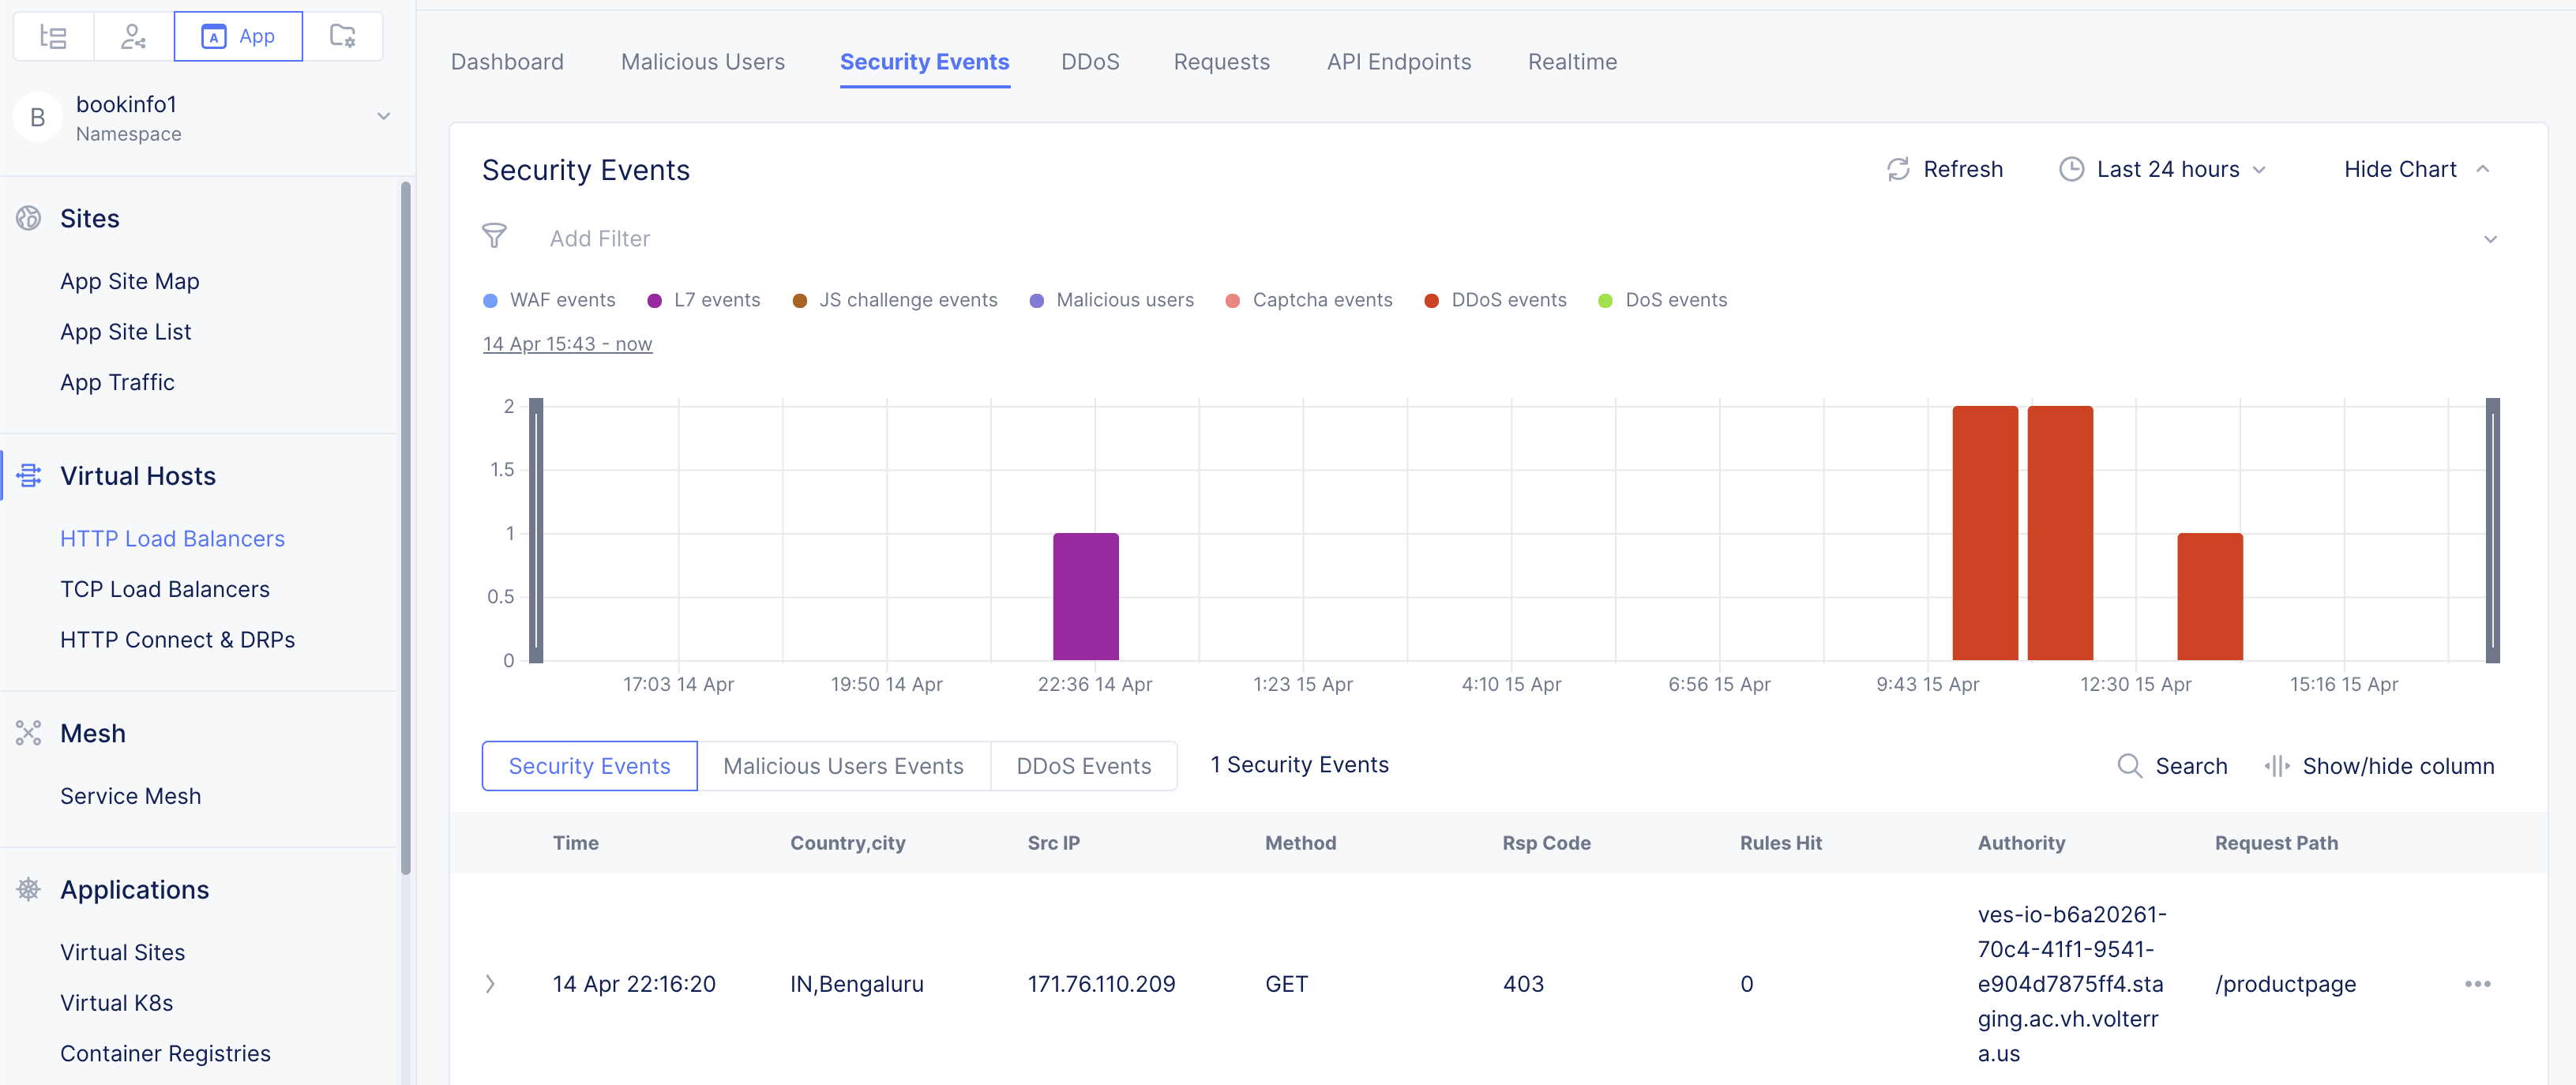
Figure: Security Events Page
Note: You can click
>on any entry to display information of that event in fully expanded view. SelectJSONtab to obtain the information in JSON format.
-
Click
...for an entry on the list of security events and select one option as per the following guidelines.- Select
Create Exception Ruleto create exception for that event so that it is not flagged as a security event. This will open the load balancer edit form with a WAF rule to exclude this event. Enter name, select values forExclude WAF Rulesfield, clickApply, and clickSave and Exitin the load balancer configuration page to apply the exception rule. - Select
Add to Blocked Clientsto add this client to blocked clients. This will open the load balancer edit form with a rule to block the specific client. ClickApplyand clickSave and Exitin the load balancer configuration page to apply the blocking rule. - Select
Add to Trusted Clientsto add this client to trusted clients. This will open the load balancer edit form with a rule to allowlist the specific client. ClickApplyand clickSave and Exitin the load balancer configuration page to apply the trusted clients rule.
- Select
Malicious User Events Inspect malicious events sub page.
Click the Malicious User Events tab beneath the graph to inspect list of events flagged as malicious user events.
DDoS Events Inspect DDoS events sub page.
Note: Click
Refreshon the top right side of the page to refresh the information displayed on the page. ClickHide Chartto hide the graph and show only events list.