Configure DDoS Detection
Objective
This document provides instructions on how to enable anomaly detection using time series analysis on the metrics of your application. The F5® Distributed Cloud DDoS detection is supported for the Request Rate, Error Rate, Latency, and Throughput (RELT) metrics. The DDoS detection is performed using advanced machine learning upon enabling through configuration. To know more about the DDoS detection concepts, see Behavioral Firewall.
The DDoS detection monitors and alerts about the following types of abnormal traffic patterns:
- Unusually large spikes (DoS attack and genuinely high traffic)
- Sudden drops — may indicate reachability issues
- Seasonality patterns — these are periodic patterns
- Missing periodic peaks — may indicate problems with client application
- Unexpected peaks or drops
Note: The DDoS detection includes learning time of day usage patterns.
Using the instructions provided in this document, you can enable the DDoS detection for metrics of your application and monitor the related detected anomalies in the Distributed Cloud service mesh.
Prerequisites
Note: If you do not have an account, see Getting Started with Console.
- One or more applications deployed on Distributed Cloud site and services configured.
Note: See App Management for more information. See Site Management for site creation instructions.
Configuration
The following image describes the configuration work-flow for enabling DDoS detection for your application metrics:
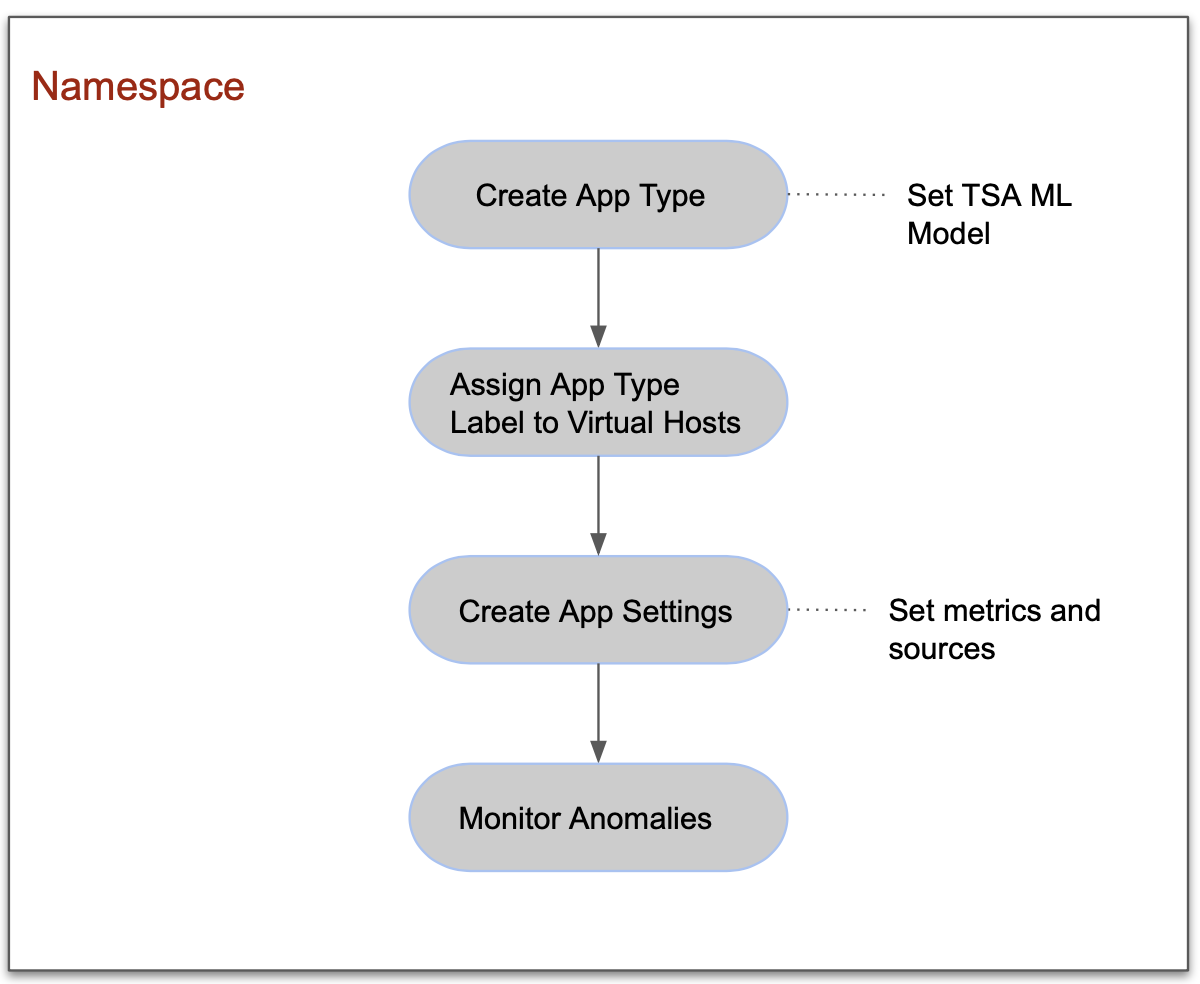
Figure: Work-flow for Enabling DDoS
Configuration Sequence
The following table presents the sequence of activities in enabling the DDoS detection:
| Activity | Description |
|---|---|
| Create App Type | Create app type and configure the DDoS detection features. |
| Create App Settings | Select metrics and components such as nodes, edges, or load balancers for DDoS detection and associate them with the app type. |
| Monitor Anomalies and Alerts | Monitor the service mesh or load balancer to check for anomalies detected and reported by DDoS detection. |
Create App Type
To enable anomaly detection for your application services, it is required to first enable DDoS detection for those services using the app type object.
The app type object is created in the shared namespace. The load balancers of that app type in different namespaces need to be assigned with the label of the app type object.
Perform the following to create app type and enable generating the anomaly model.
Step 1: Navigate to the App Types page.
- Select the
Shared Configurationservice. - Navigate to
Security>AI & ML>App Types.
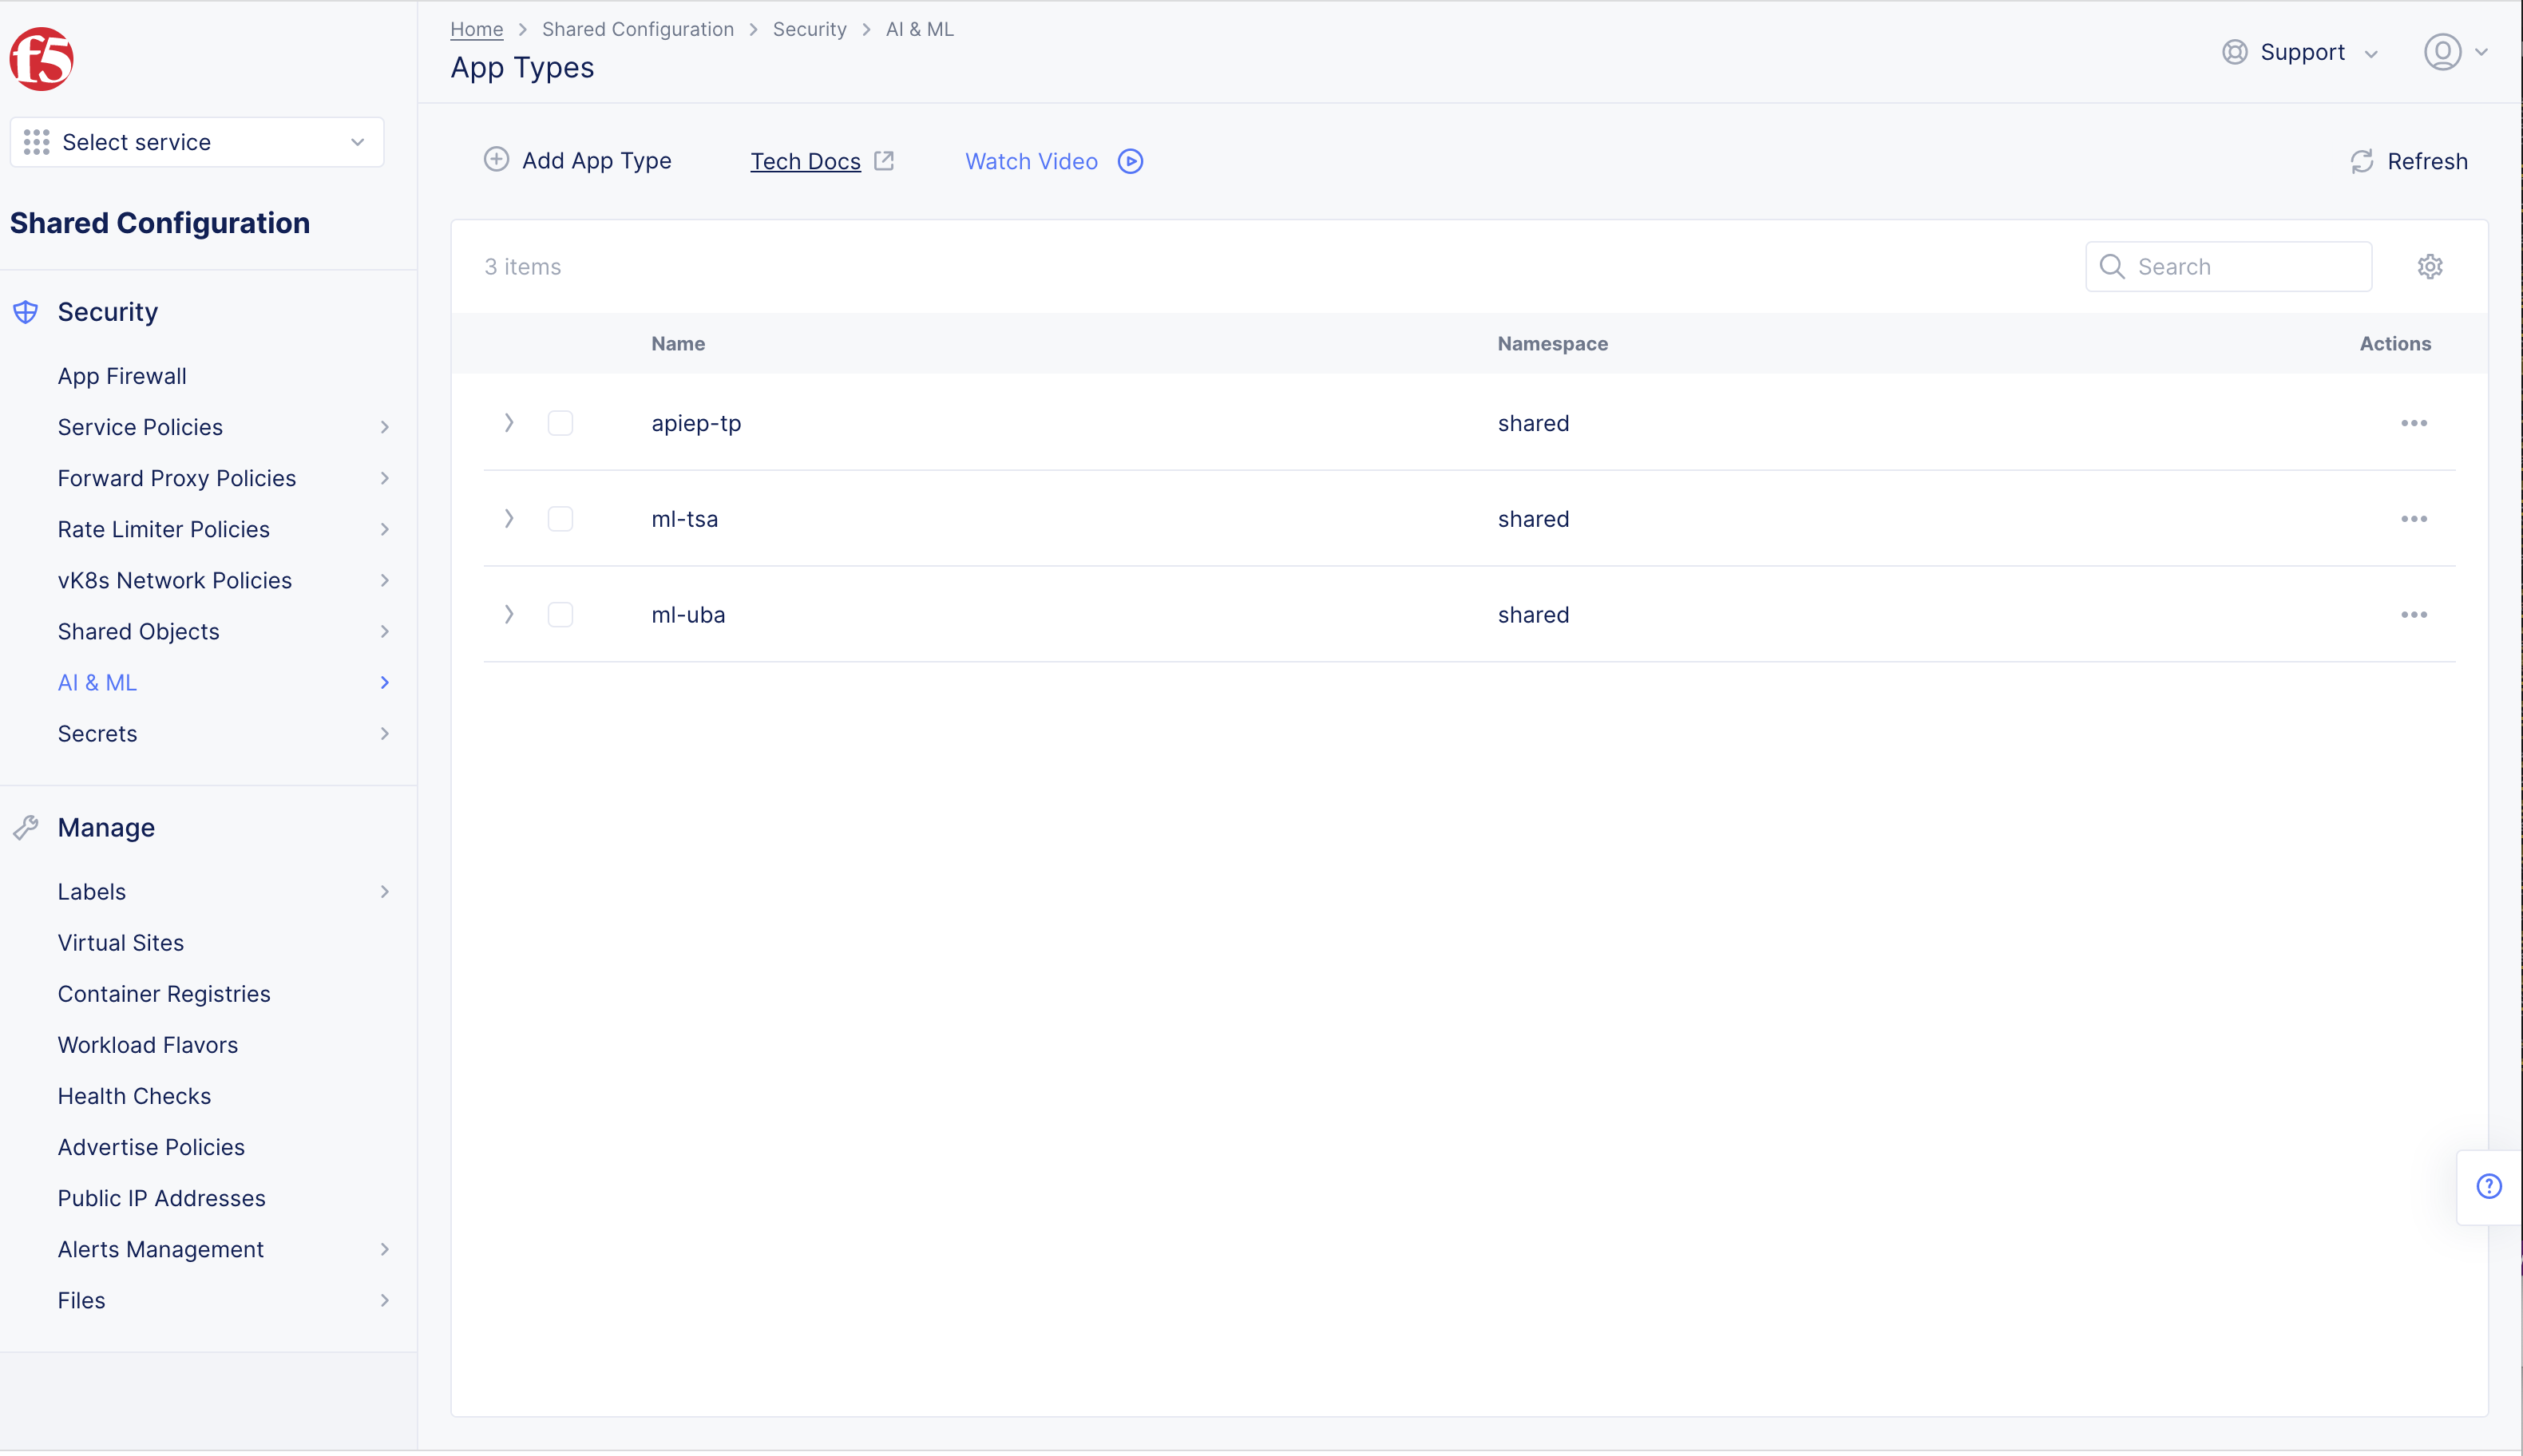
Figure: Navigate to App Type Configuration
Step 2: Configure app type object settings.
- Select
+ Add App Typeand enter the configuration in the app type object creation form using the following guidelines:
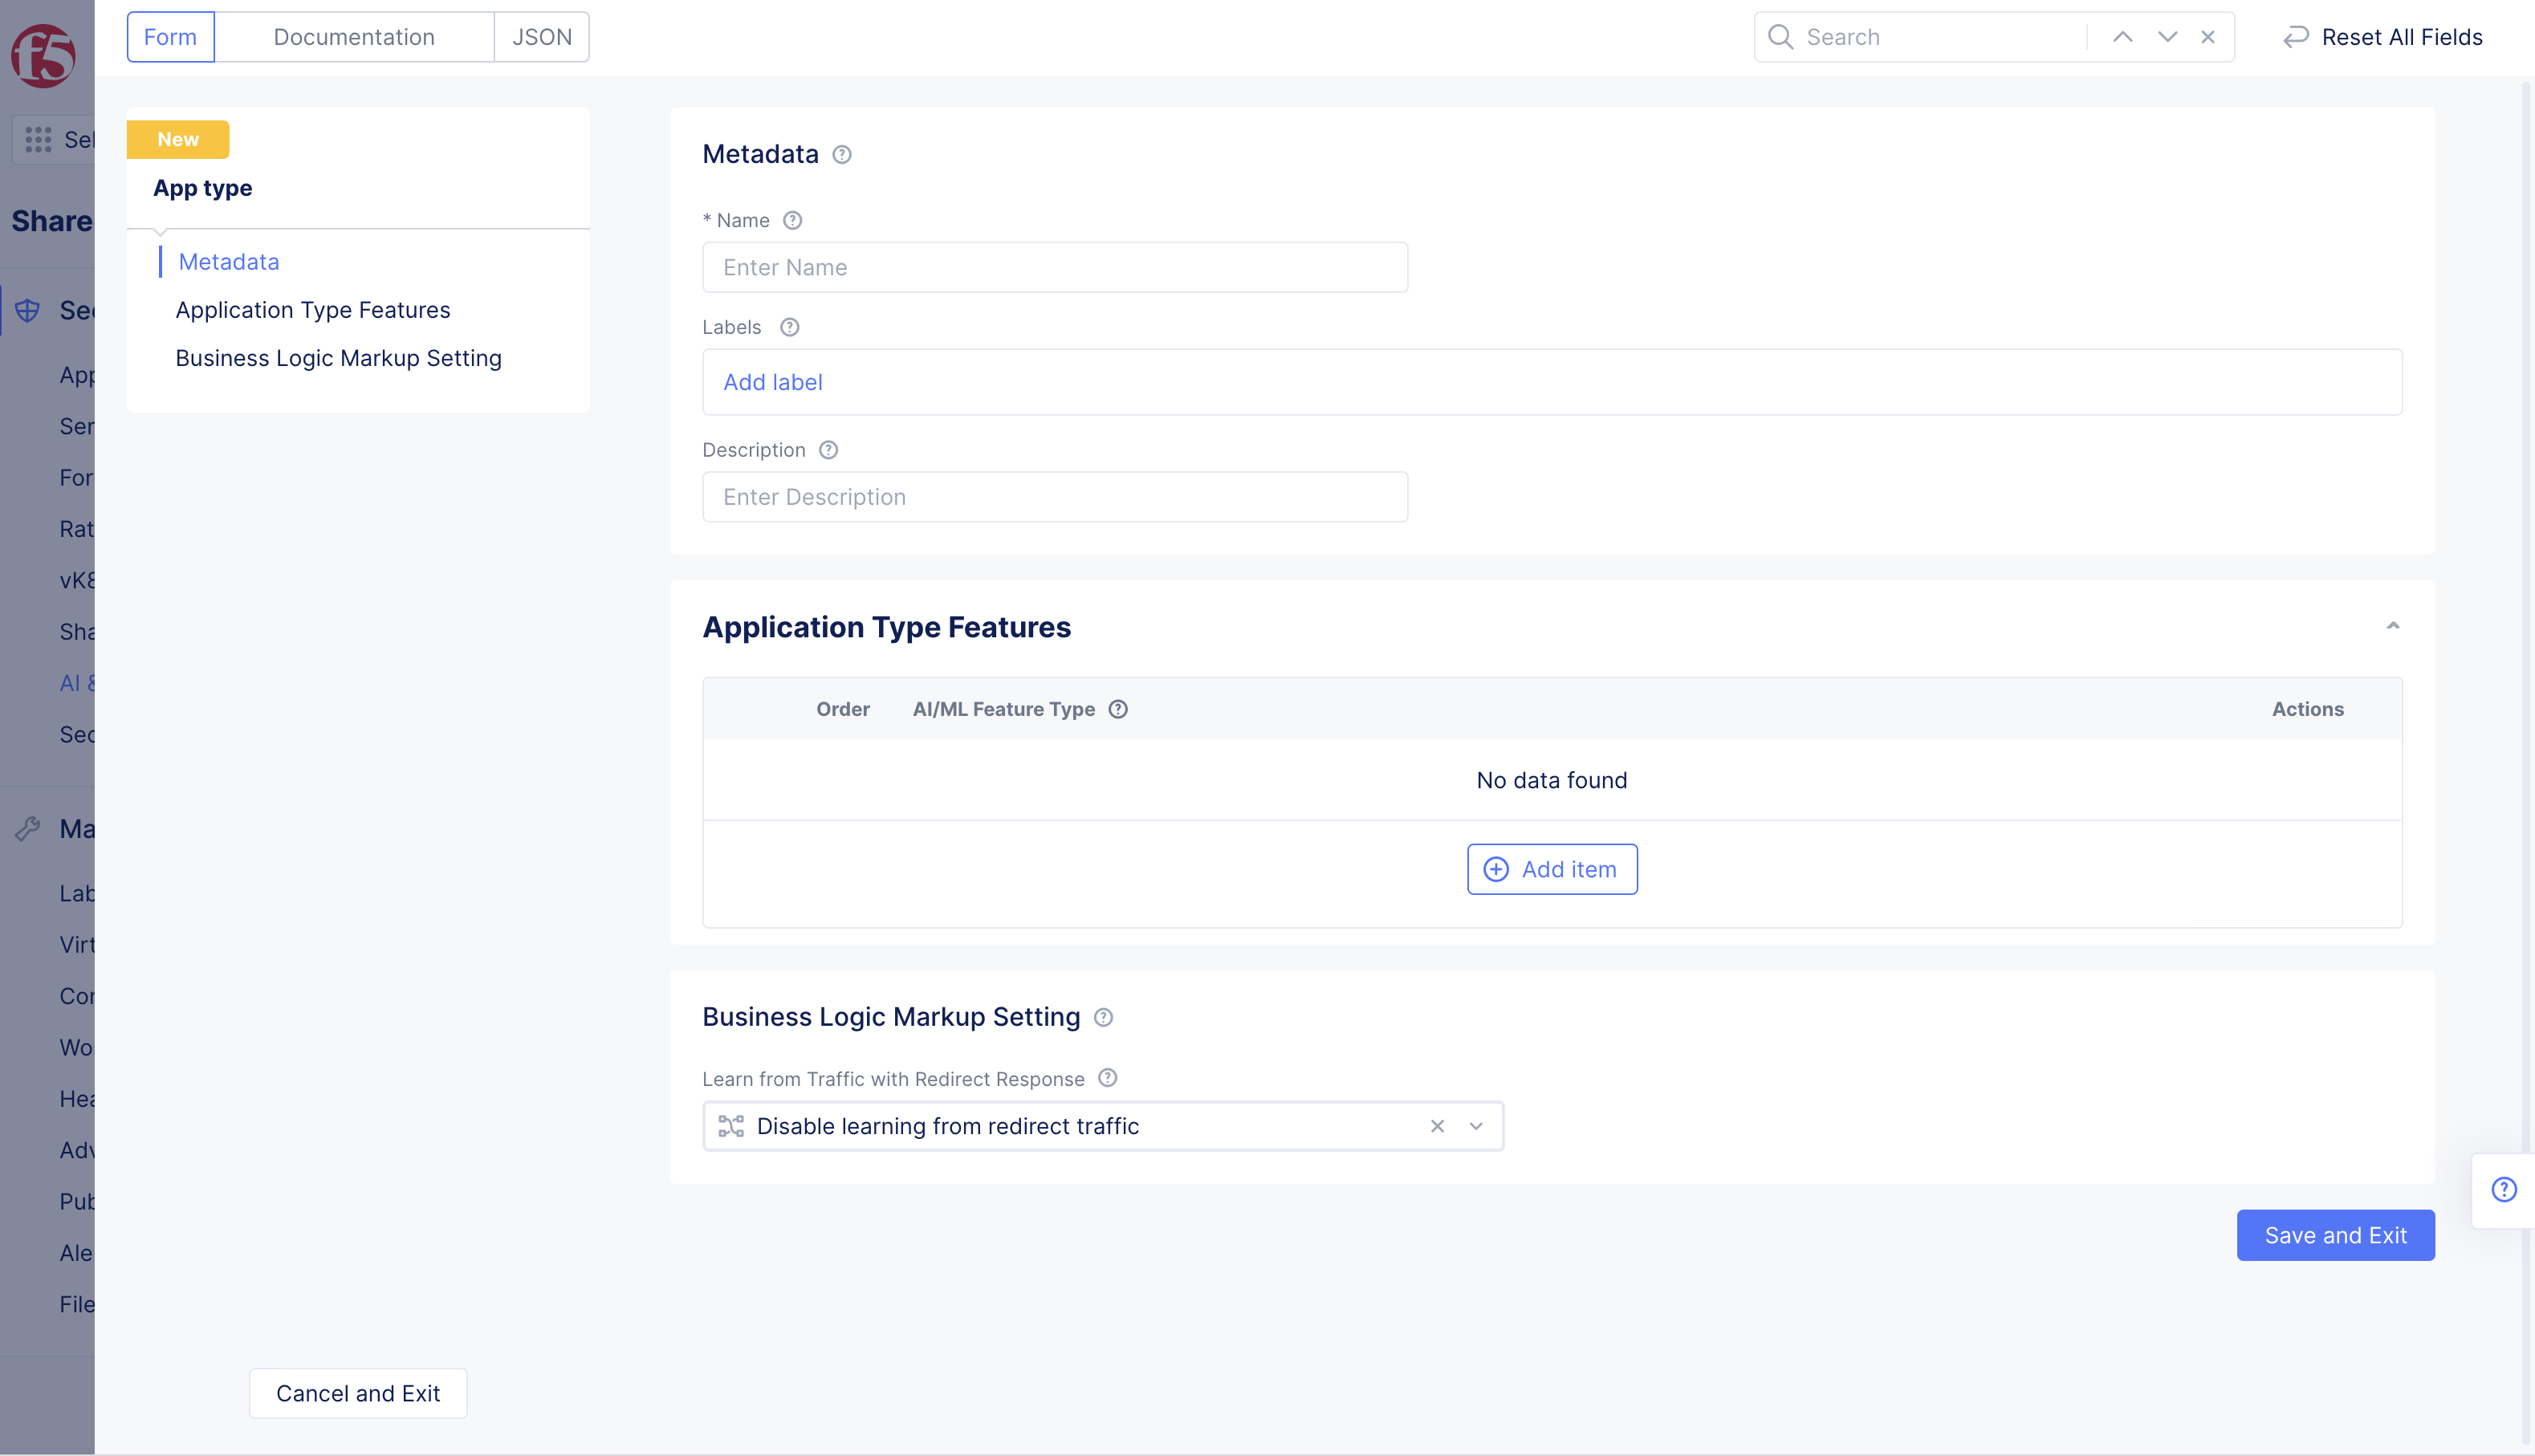
Figure: App Type Feature Configuration
-
Enter
Namefor the app type. This is the value for the app type label to be assigned to the load balancers for which the DDoS detection needs to be enabled. -
Select
+ Add itemin theApplication Type Featuressection and select a type for theAI/ML Feature Typefrom the drop-down list using the following guidelines:- Select
API Discoveryfor enabling analysis on interactions between the services. - Select
DDoS Detectionfor enabling analysis on RELT metrics. - Select
Per API Request Analysisfor enabling detection per API request. - Select
Malicious User Detectionfor enabling user behavior analysis.
- Select
Note: You can add all the features using the
+ Add itemoption.
-
Optionally, select
Enable learning from redirect trafficoption for theLearn from Traffic with Redirect Responsefield in theBusiness Logic Markup Settingsection. -
Select
Save and Exitto complete creating the app type object.
Assign App Type Label to Load Balancers
After creating the app type, it is required to assign the app type label to the load balancers for which you want to enable DDoS detection.
Note: Enabling DDoS detection for all load balancers in a namespace requires you to apply the app type label to all load balancers in that namespace.
Perform the following to assign the app type label to your load balancers.
Step 1: Navigate to load balancer management.
- Select the
Multi-Cloud App Connectservice. - Select the desired namespace from the
Namespacedrop-down menu. - Navigate to
Manage>Load Balancers>HTTP Load Balancers. - Select
...>Manage Configuration>Edit Configurationfor the load balancer for which the app type label needs to be assigned.
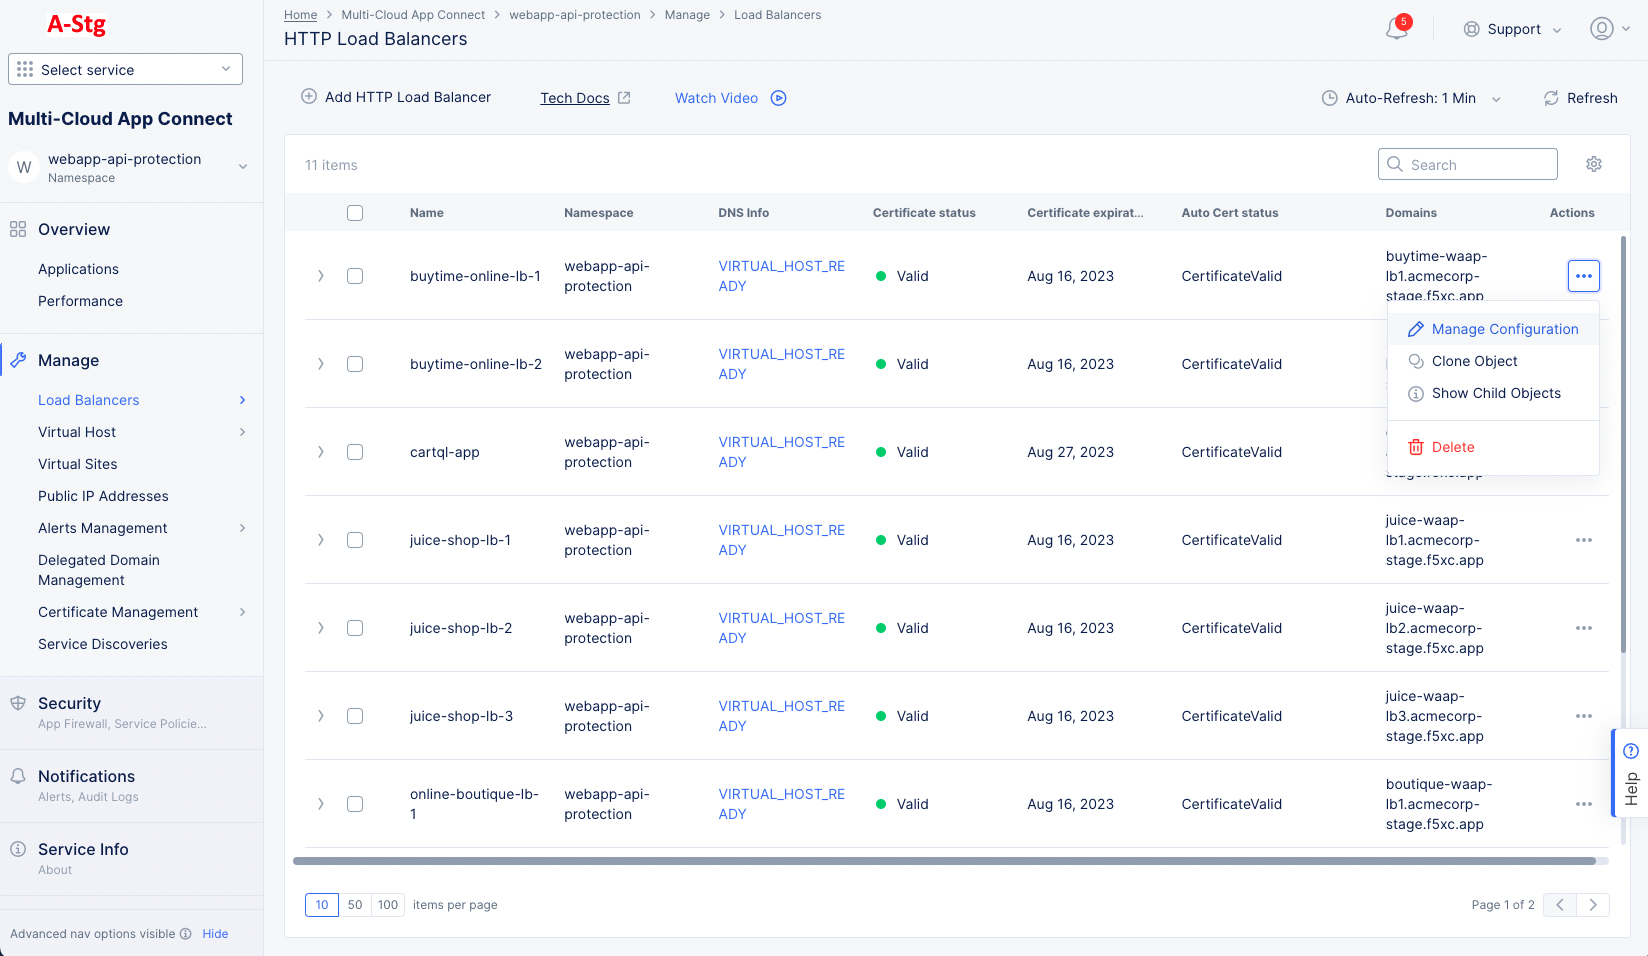
Figure: Navigate to load balancer Edit Configuration
Step 2: Assign the app type label.
- Select
ves.io/app_typefor theLabelsfield and type.
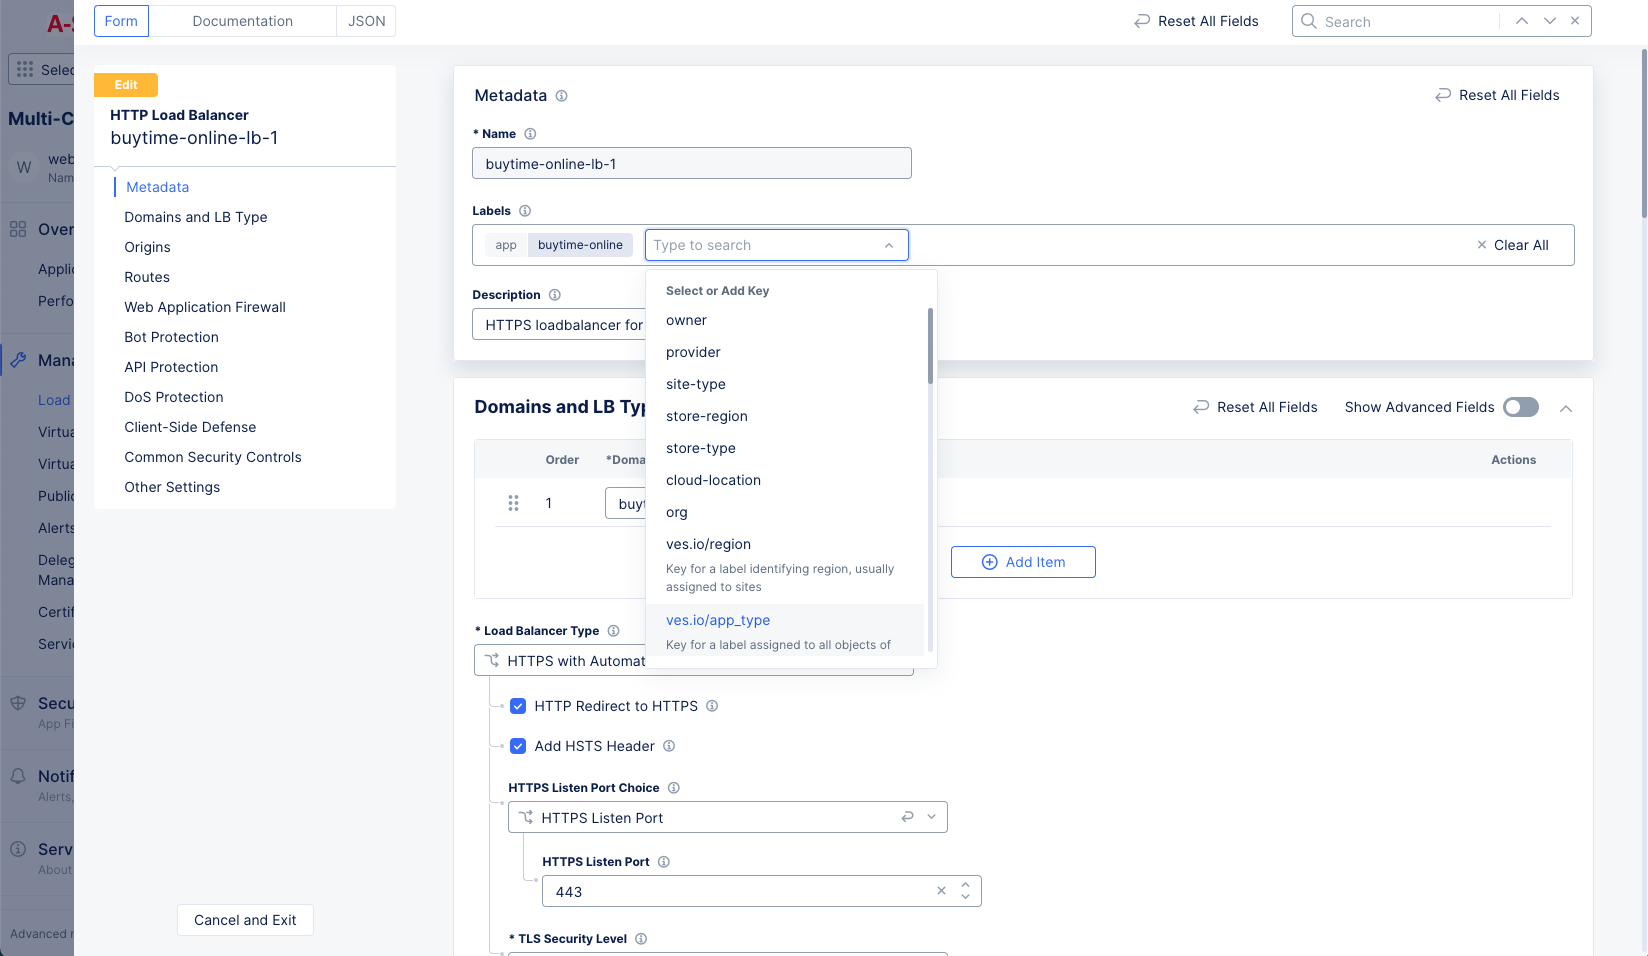
Figure: App Type Label Selection
- Type the name of the app type object created in the previous step, and select
Assign a Custom Valueto add the app type label.
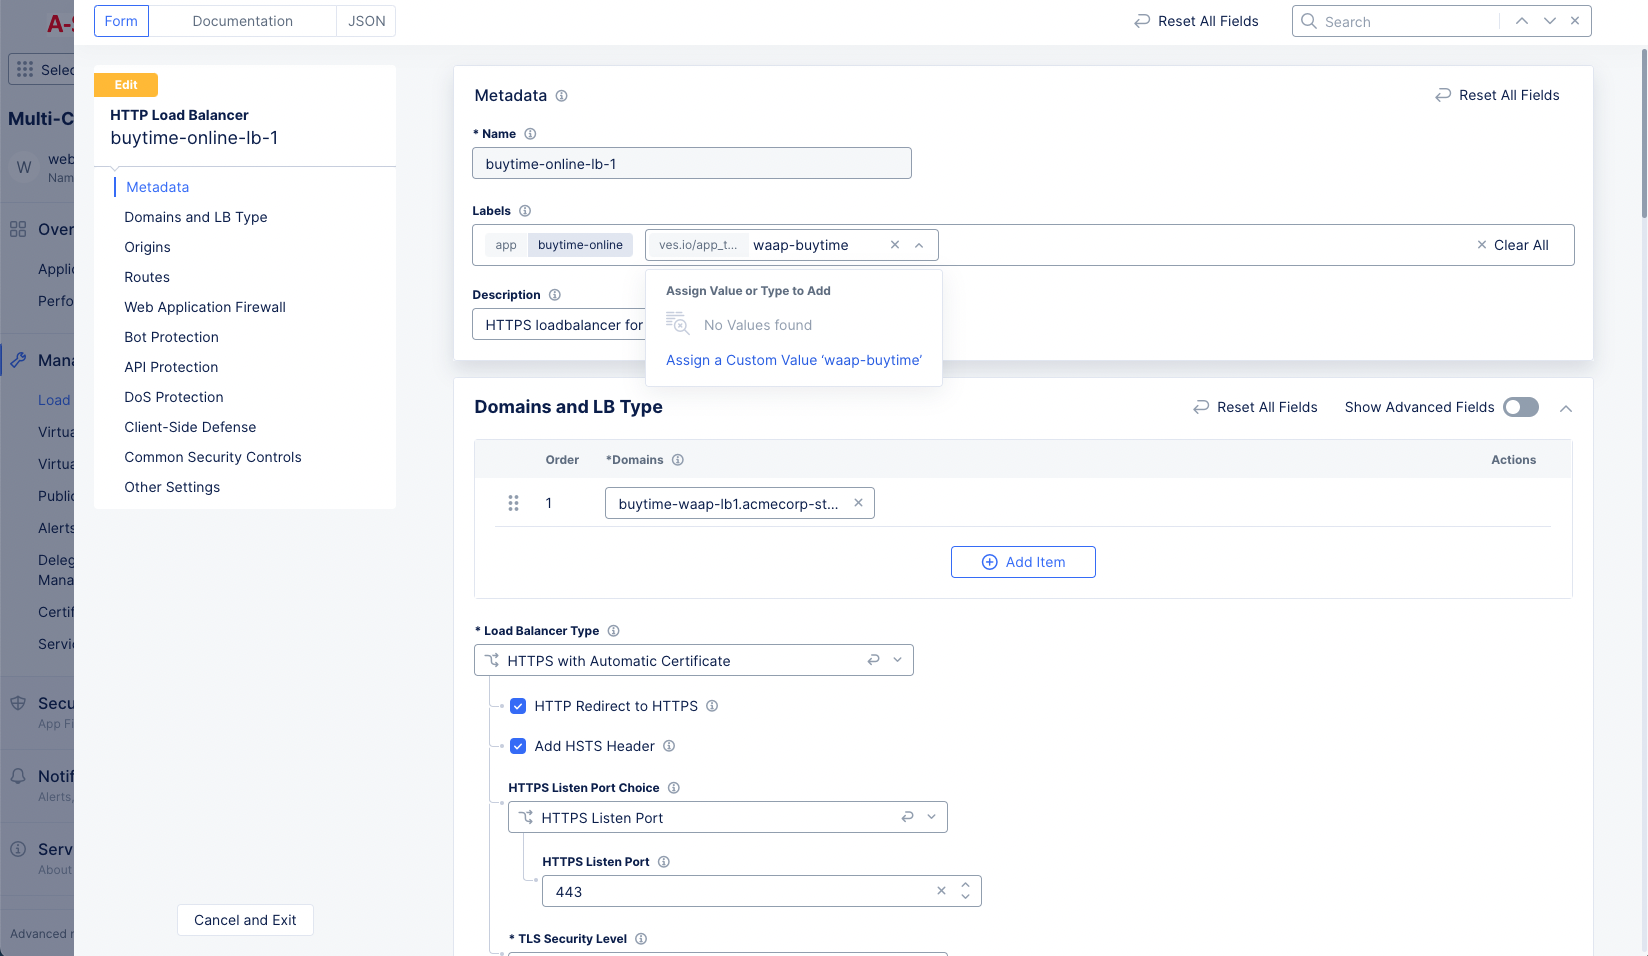
Figure: App Type Label Addition
- Select
Save and Exitbutton to apply the label to the load balancer.
Create App Settings
After creating an app type with the DDoS detection feature enabled, it is required to associate it with the metrics and sources for which the anomaly detection is required. This is done by configuring the app settings object.
The metrics are RELT metrics and sources are of the following types:
- Services
- Service interactions
- load balancers
Perform the following to create the app type object.
Step 1: Navigate to the App Settings page.
- Select the
Multi-Cloud App Connectservice. - Select the desired namespace from the
Namespacedrop-down menu. - Navigate to
Security>AI & ML>App Settings. - Select
Add App settingfor the load balancer for which the app type label needs to be assigned.
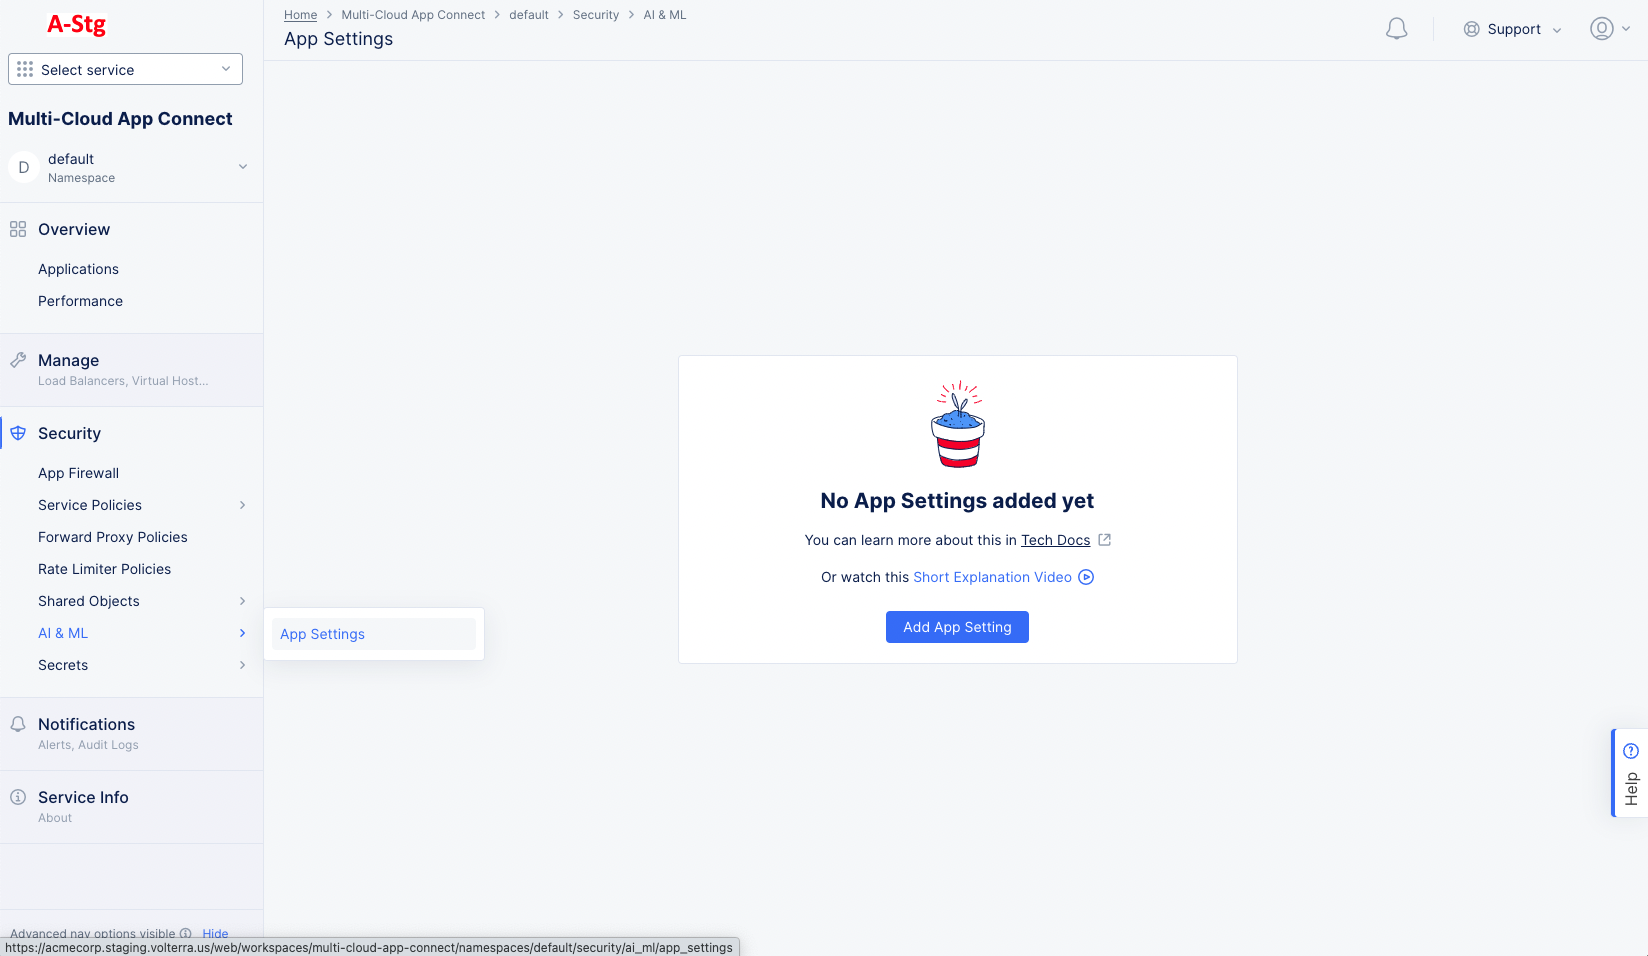
Figure: Navigate to load balancer Edit Configuration
Step 2: Enter configuration for the app settings object.
- Enter a name for the app setting.
- Go to
Application Type Feature Configurationsection and Select+ Add Itemto configure an AppType. - In the
AppTypefield, select the created app type object from the drop-down list. - Select
Configureunder theDDoS Detectionfield. Select+ Add itemin theMetric Selectorssection of the time series analysis setting page. - Select an option for the
Metrics Sourcedrop-down menu from the list of options.
Note: You can add multiple Metrics in the drop-down menu.
- Select
All Servicesfor enabling metric analysis for all services. - Select
All Service Interactionsfor enabling analysis for all service interactions between source and destination services. - Select
All Virtual Hostsfor enabling metric analysis for all virtual hosts. - Select a RELT metric for the
Metricsfield from the list of options. - Select
Applybutton to complete theMetric Selector. - Select
Applyto finish addingMetric Selectors.
Note: You can add multiple metric selectors by using the
+ Add Itembutton in theMetric Selectorslist.
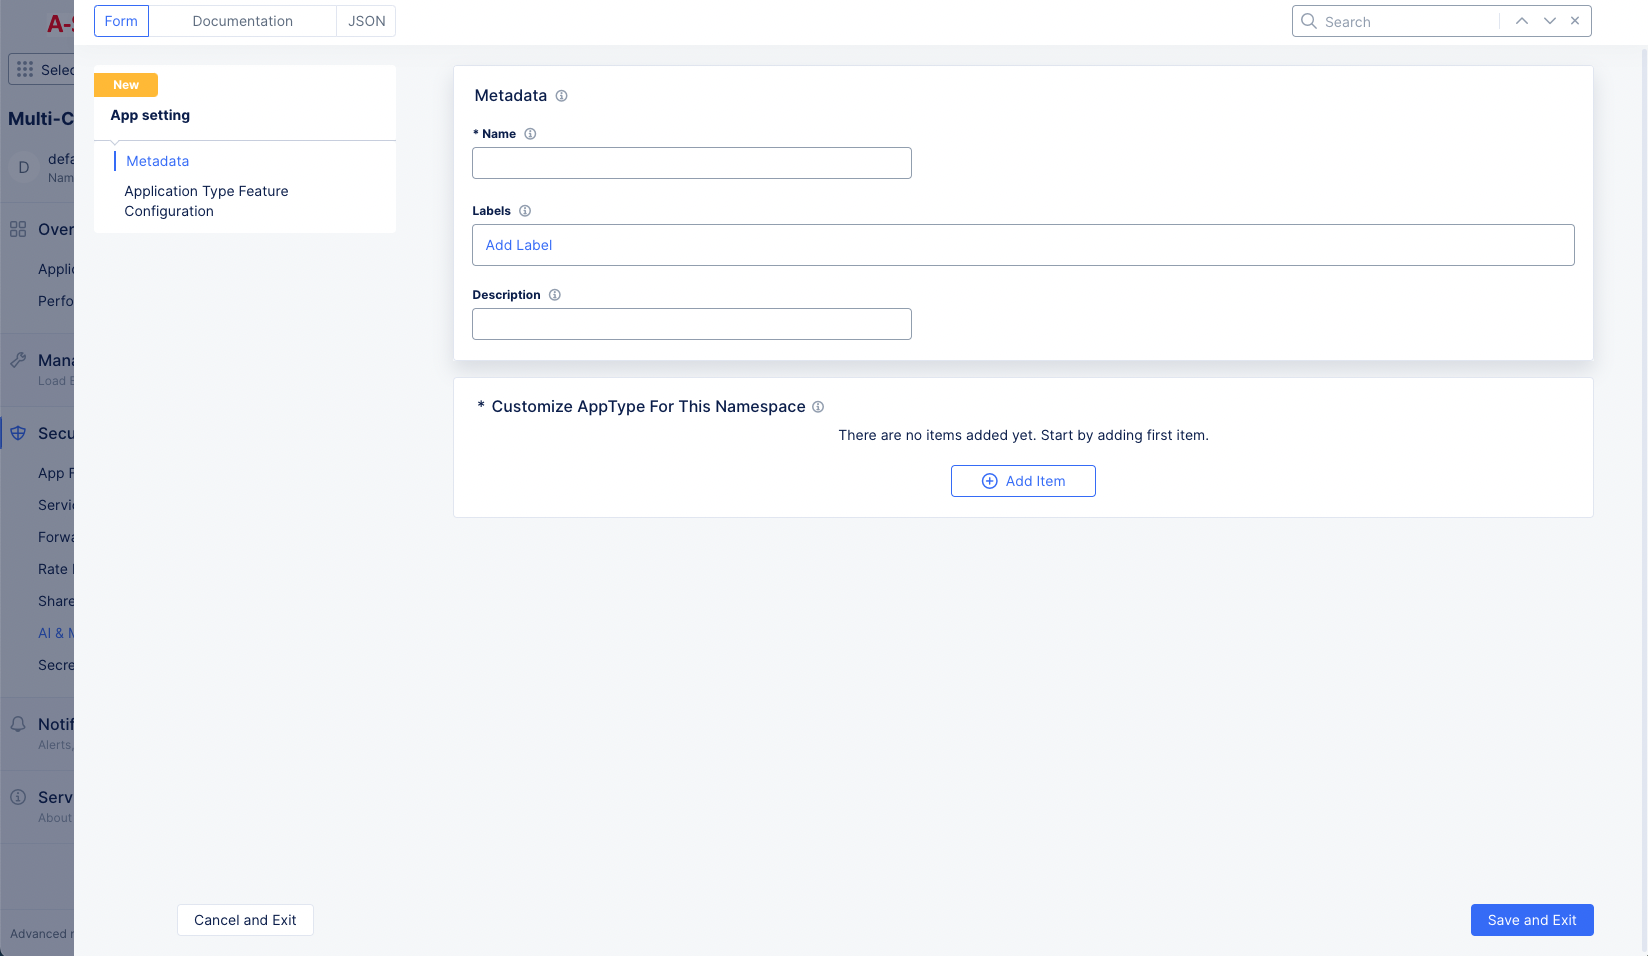
Figure: Time Series Configuration for App Settings
- Select
Applyto complete theAppType Setting.
Step 3: Complete app settings object creation.
Select Save and Exit to complete adding the Application Type Feature.
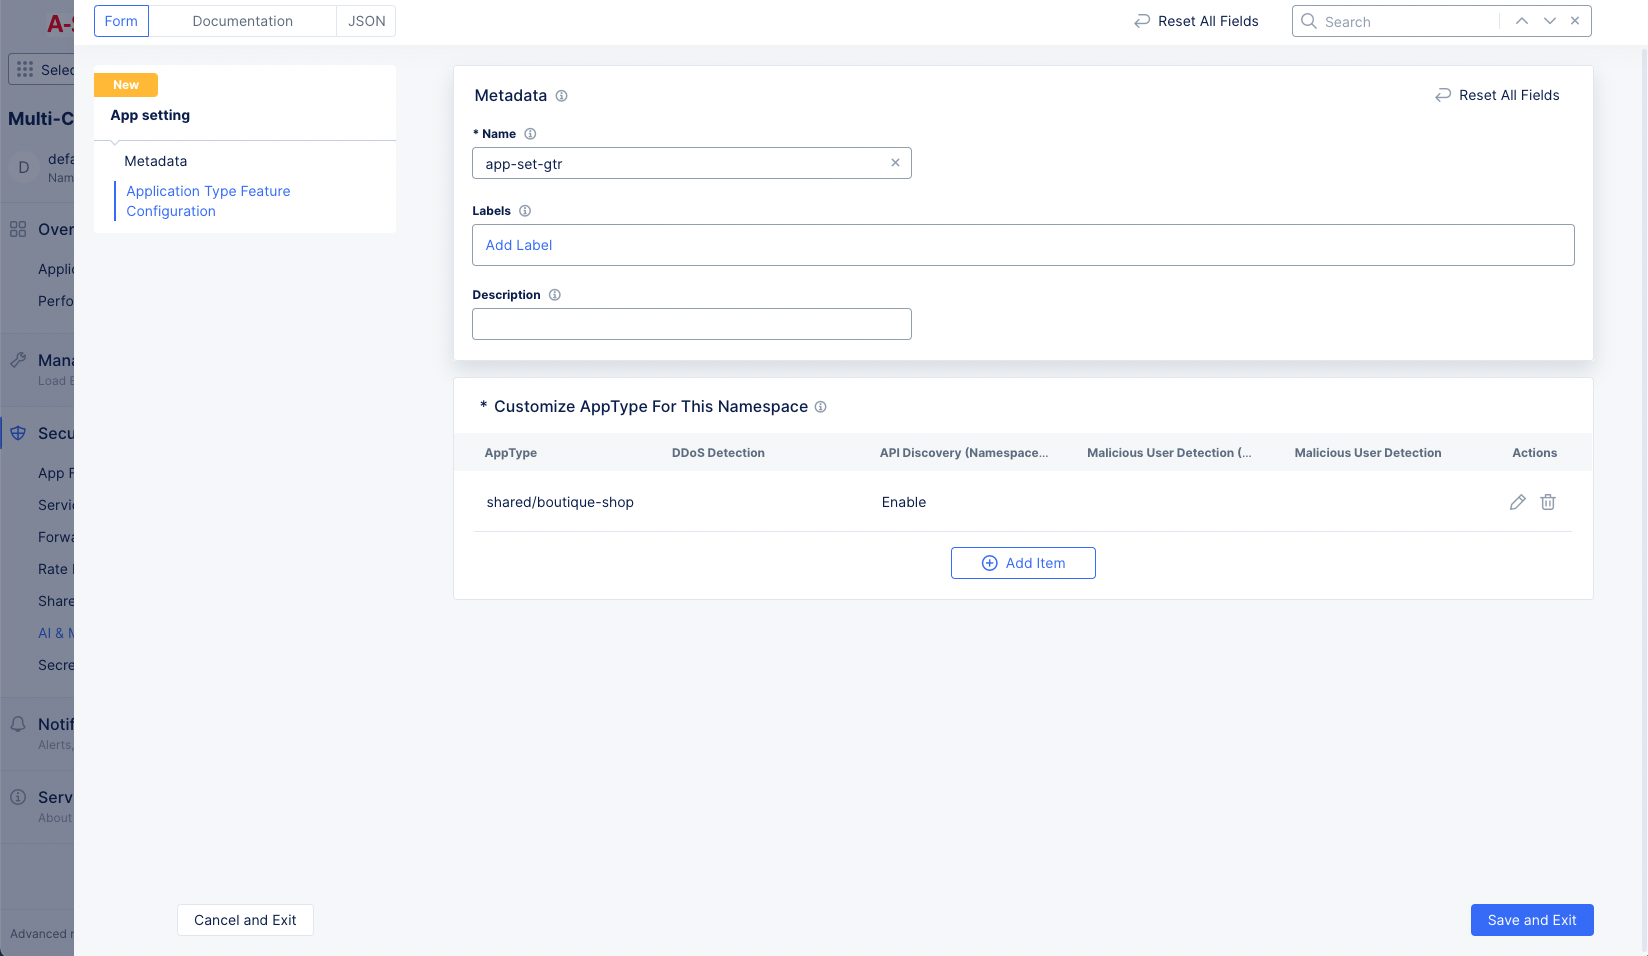
Figure: App Settings Object Creation
Note: You can add multiple app settings using the
Add itemoption.
Monitor Anomalies and Alerts
DDoS detection happens based on your selection of sources in app settings and app type configuration. You can monitor the anomalies using the metrics or alerts or both. The DDoS gets detected and displayed for service mesh or load balancer or both depending on your DDoS configuration.
Step 1: Navigate to service mesh.
- Select the
Multi-Cloud App Connectservice. - Select the desired namespace from the
Namespacedrop-down menu. - Navigate to
Overview>Applicationsto see the applications dashboard. - Select the
Service Meshtab - Select on your application tile from the displayed list to load its service mesh monitoring.
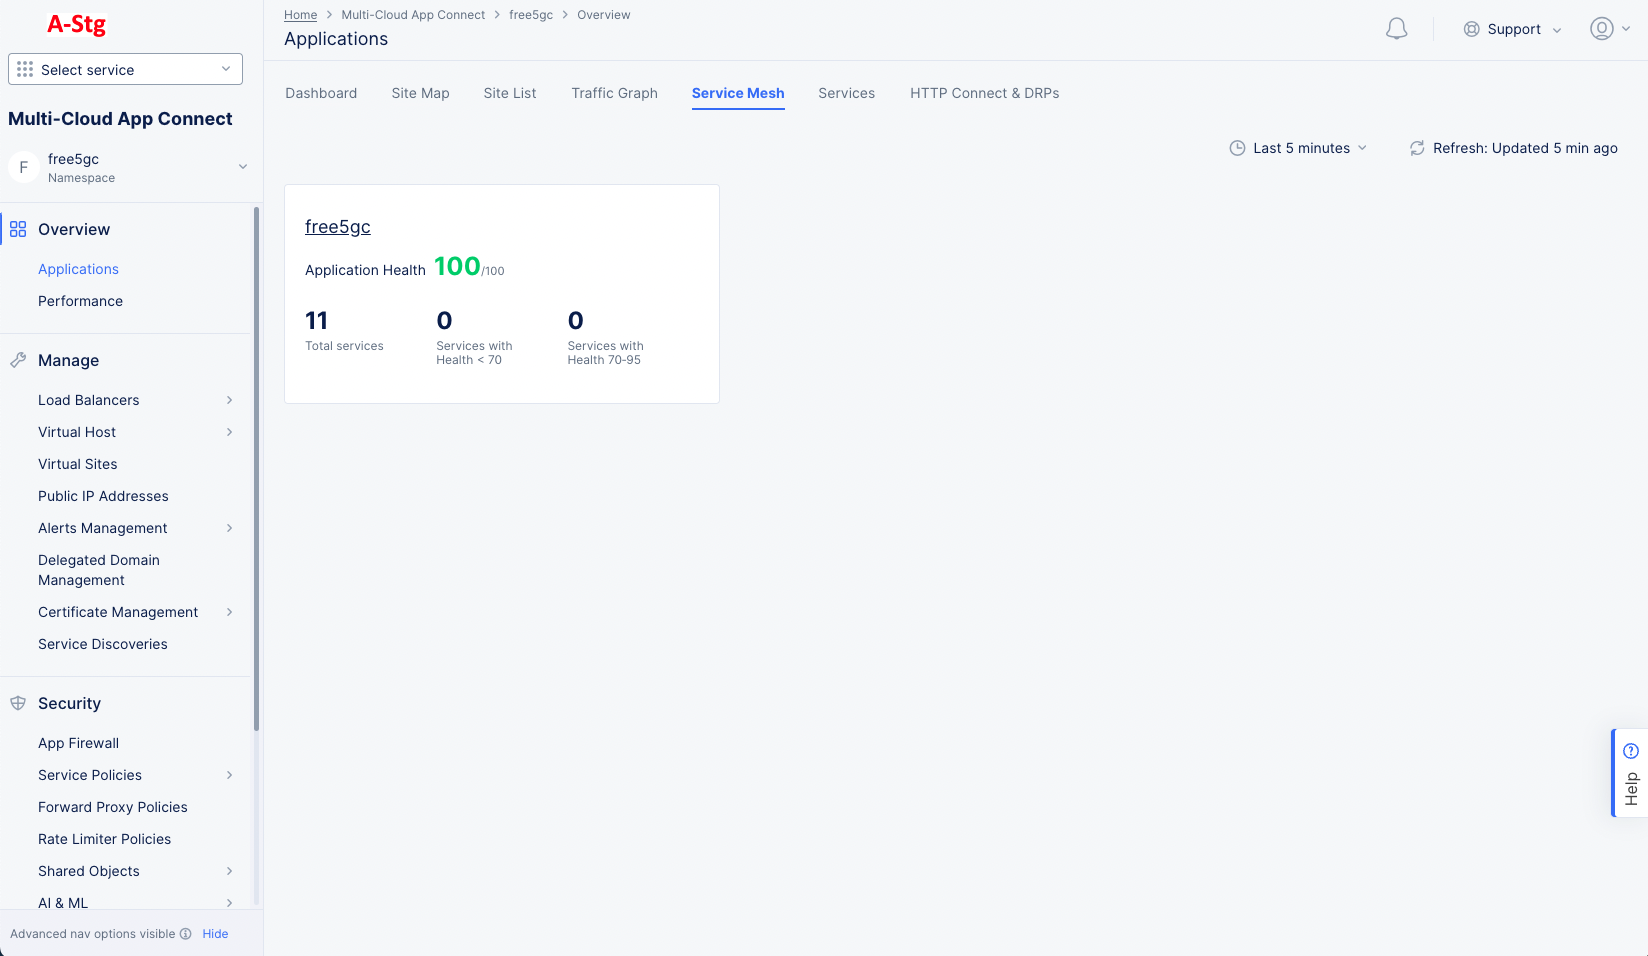
Figure: Navigate to Service Mesh
Step 2: Load the service mesh metrics view.
Select Metrics tab to load the metrics view.
The metrics view presents trend information for your service metrics for a default or configured time period.
When the DDoS detection is enabled for metrics, a shadow is shown over the metrics bars. This is called a Confidence interval. The confidence interval indicates that the metric value crossing this interval is treated as an anomaly. Such instances are marked in red color bars. Hover over or click on any bar to display the metric and confidence interval values.
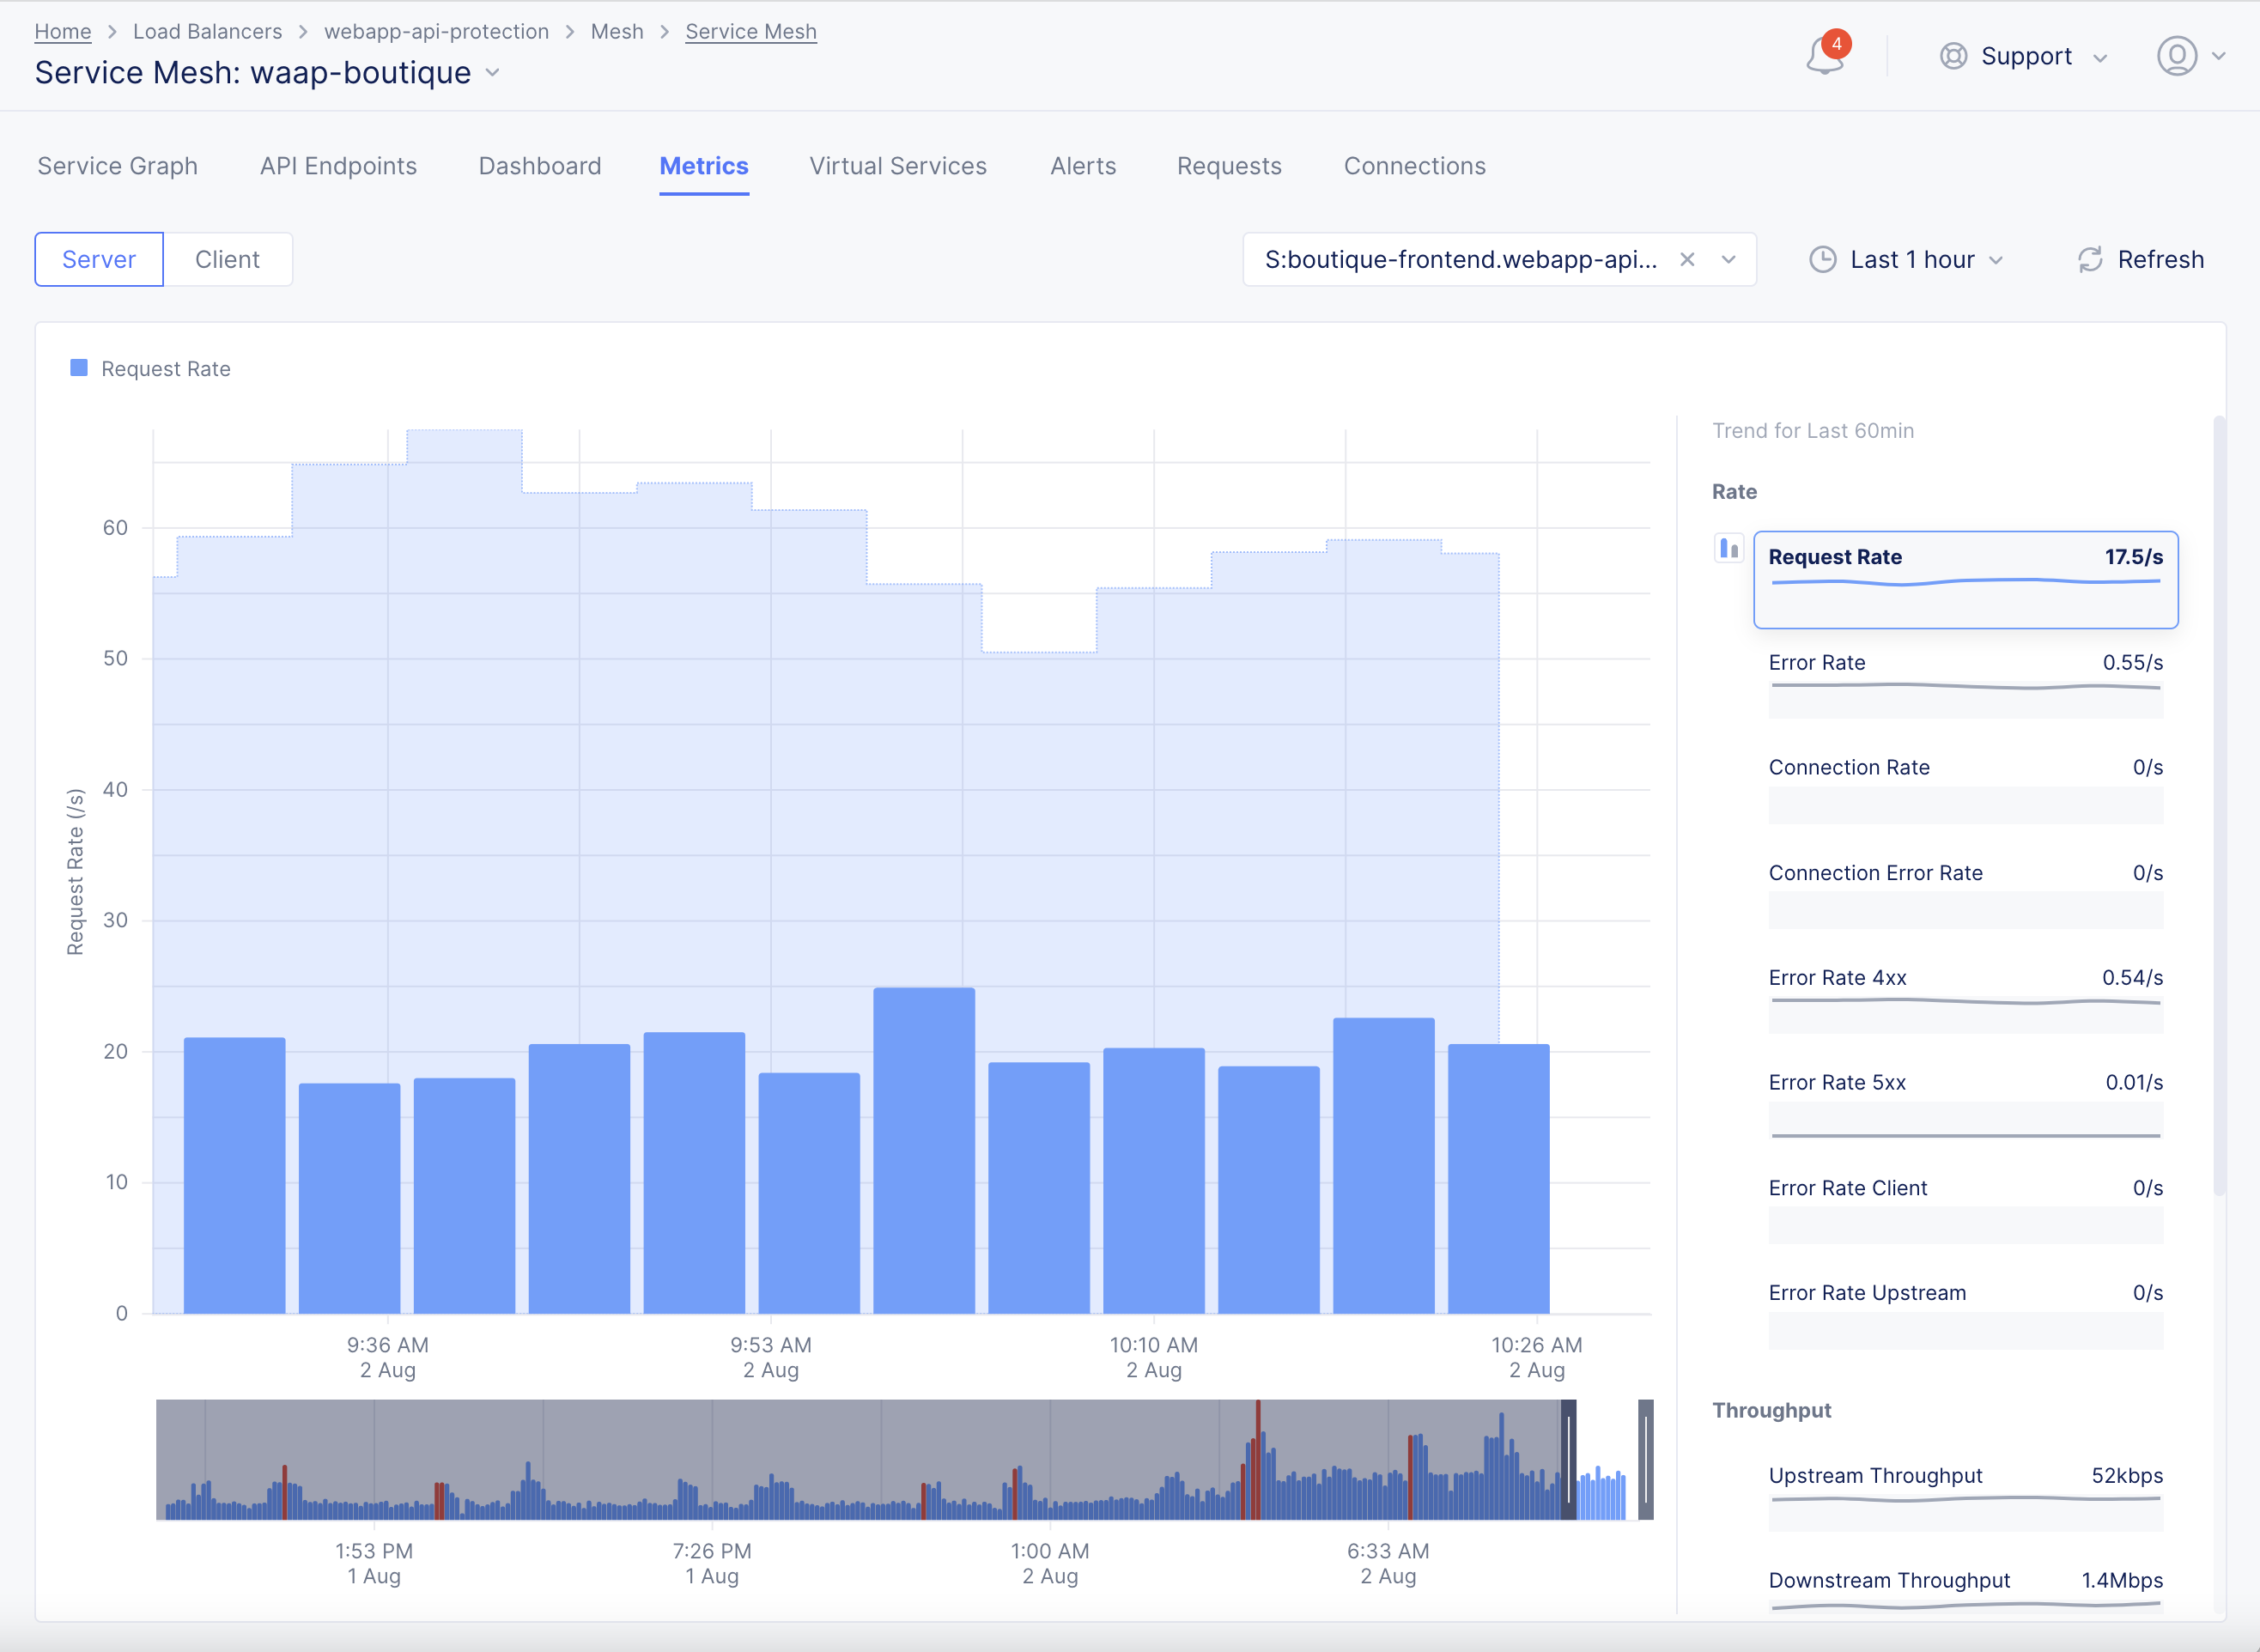
Figure: DDoS Detection Enabled Service Mesh Metrics
Step 3: Load the service mesh alerts view.
The service mesh loads service graph by default. Select Alerts tab to load the alerts view.
Active alerts are displayed by default. Select the All Alerts option to display all alerts for default interval of an hour. You can also change time interval using the Last 1 hour drop down. The value Timeseries-Anomaly for the Group field indicates that the alert is an anomaly. The DDoS alerts are generated for sustained anomalies.
Select > for any alert entry to load details in the JSON format.
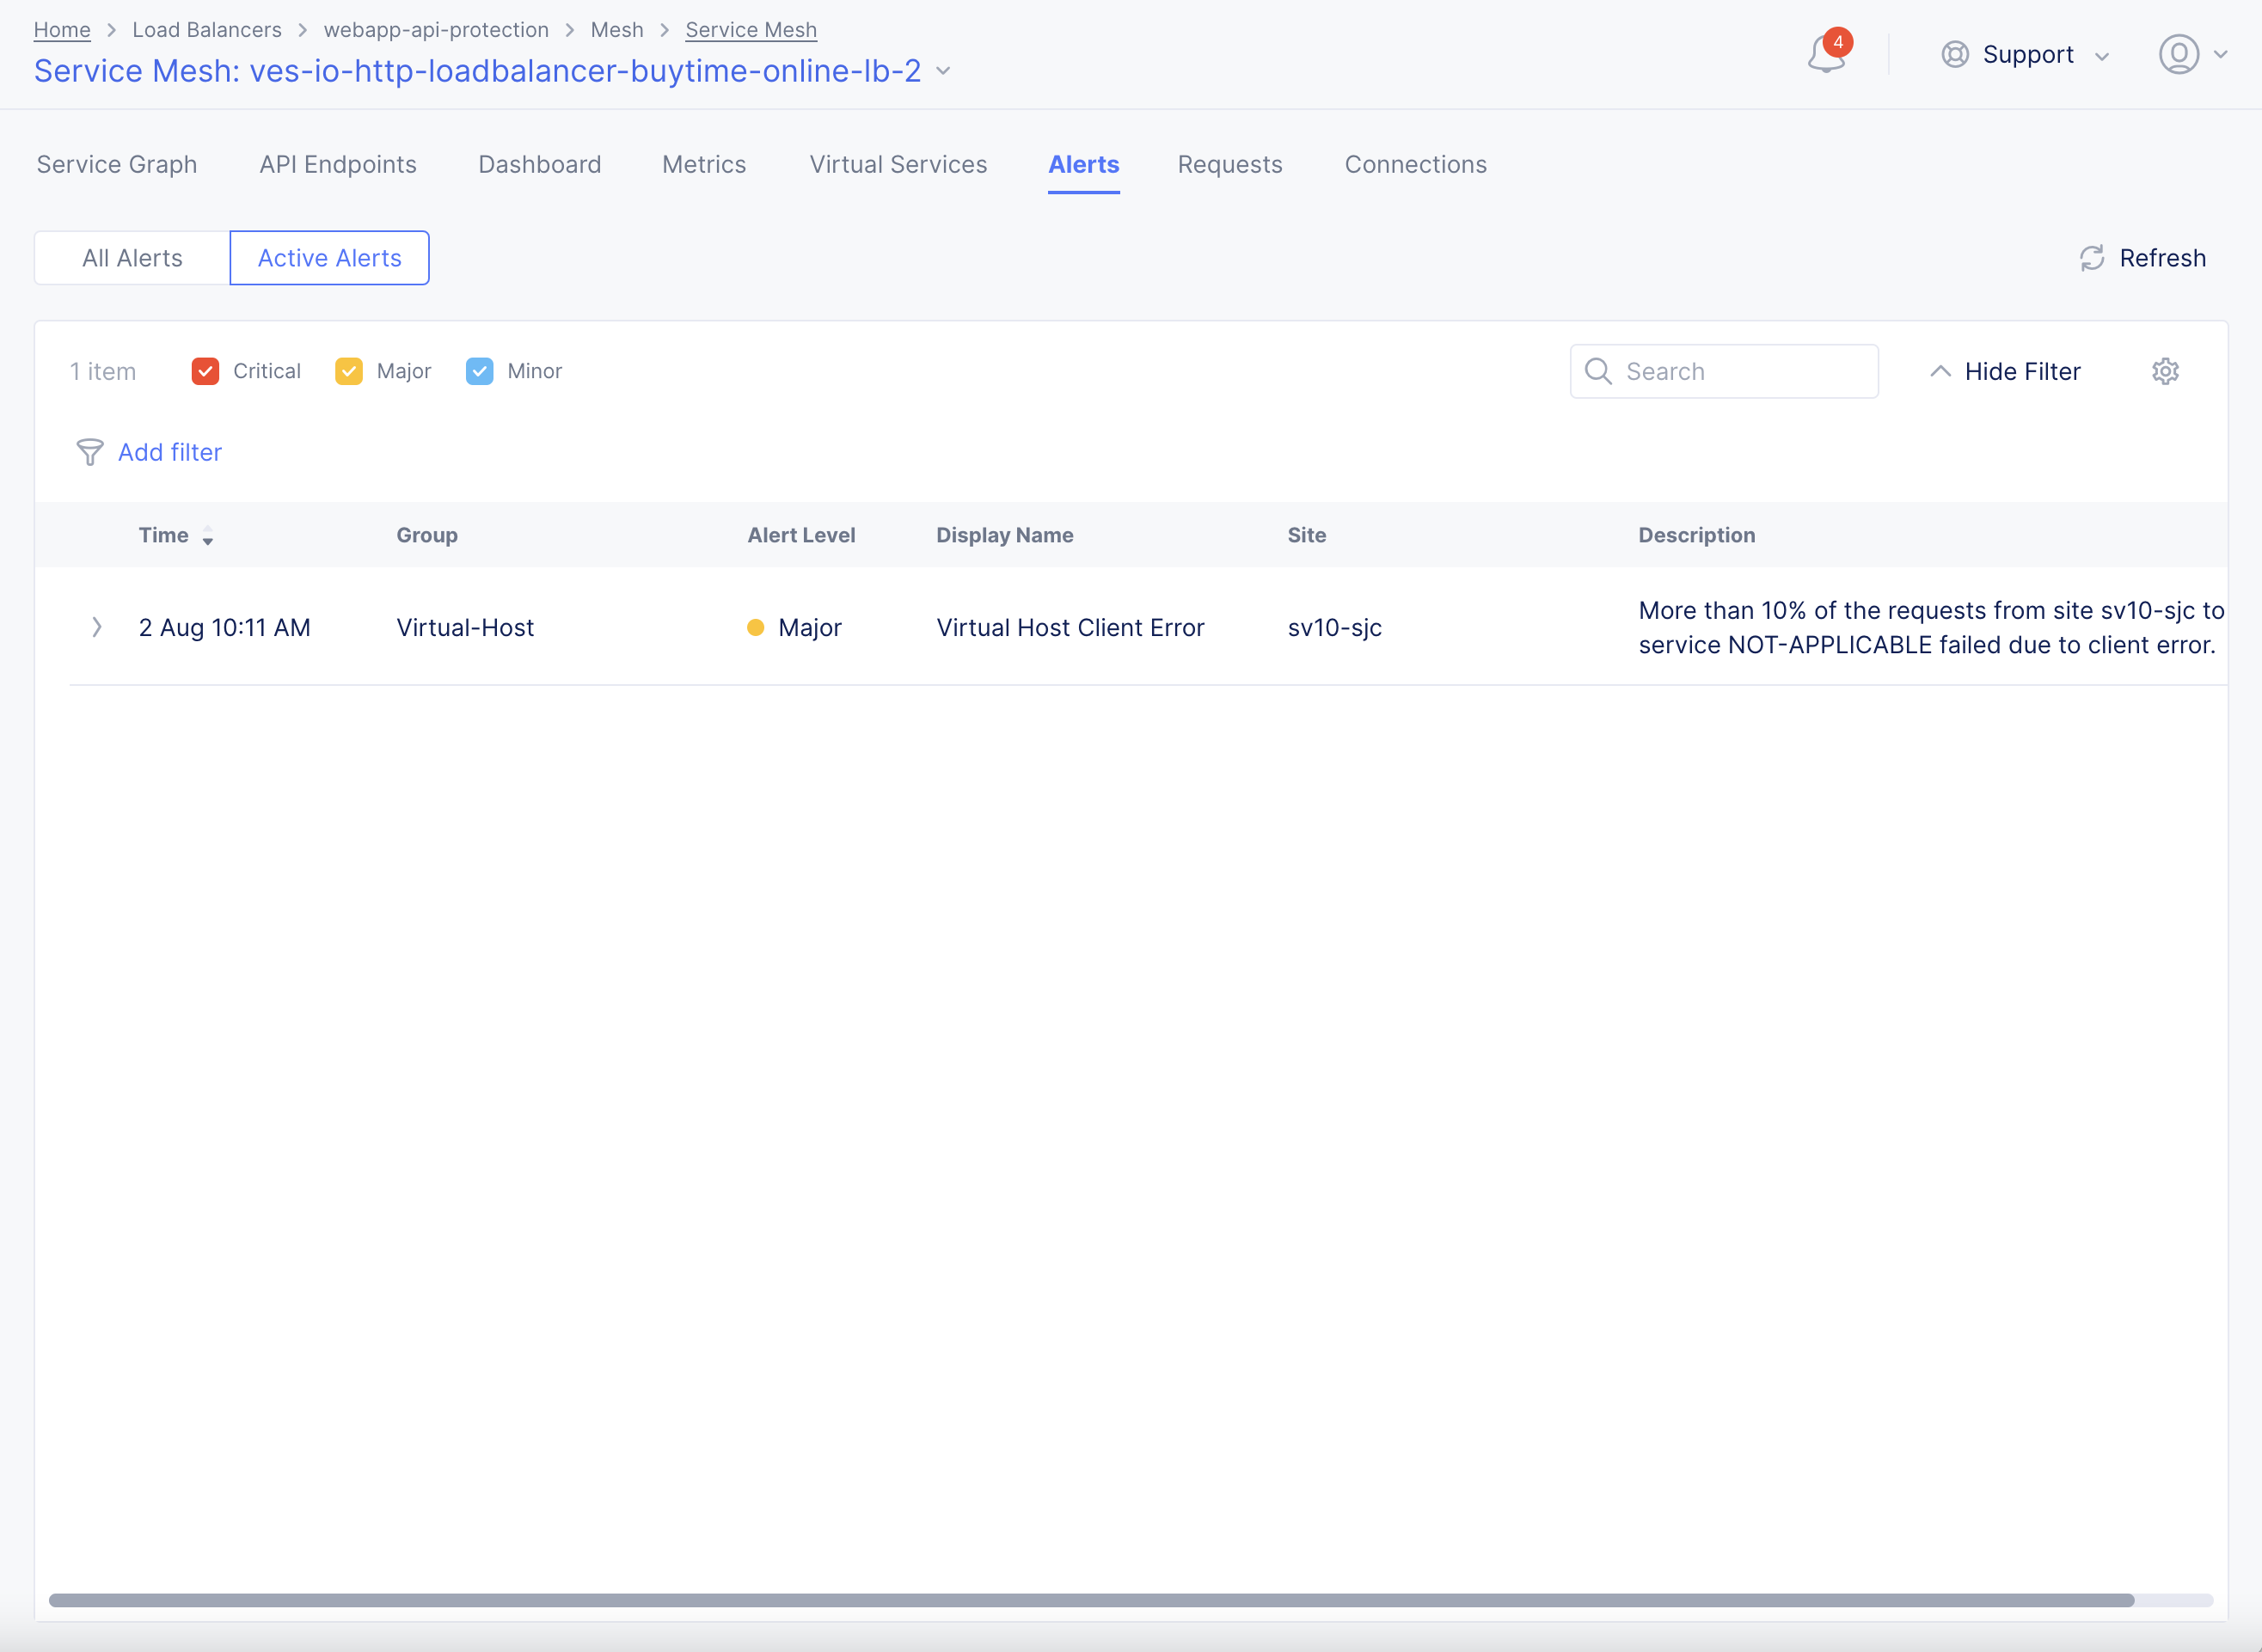
Figure: Service Mesh DDoS Alerts
Note: See DDoS Alerts for information on time-series related alerts.
Step 4: Navigate to the load balancer monitoring.
In the Multi-Cloud App Connect service, select Overview > Performance. Scroll down to the Load Balancers section and select your load balancer from the displayed list to load its performance monitoring view. The load balancer dashboard is loaded by default.
Step 5: Load the load balancer metrics view.
The load balancer dashboard is loaded by default. Select Metrics tab to load the metrics view.
The metrics view presents trend for your load balancer metrics for a default or configured time period.
When the DDoS detection is enabled for metrics, a shadow is shown over the metrics bars. This is called a Confidence interval. The confidence interval indicates that the metric value crossing this interval is treated as an anomaly. Such instances are marked in red color bars. Hover over or click on any bar to display the metric and confidence interval values.
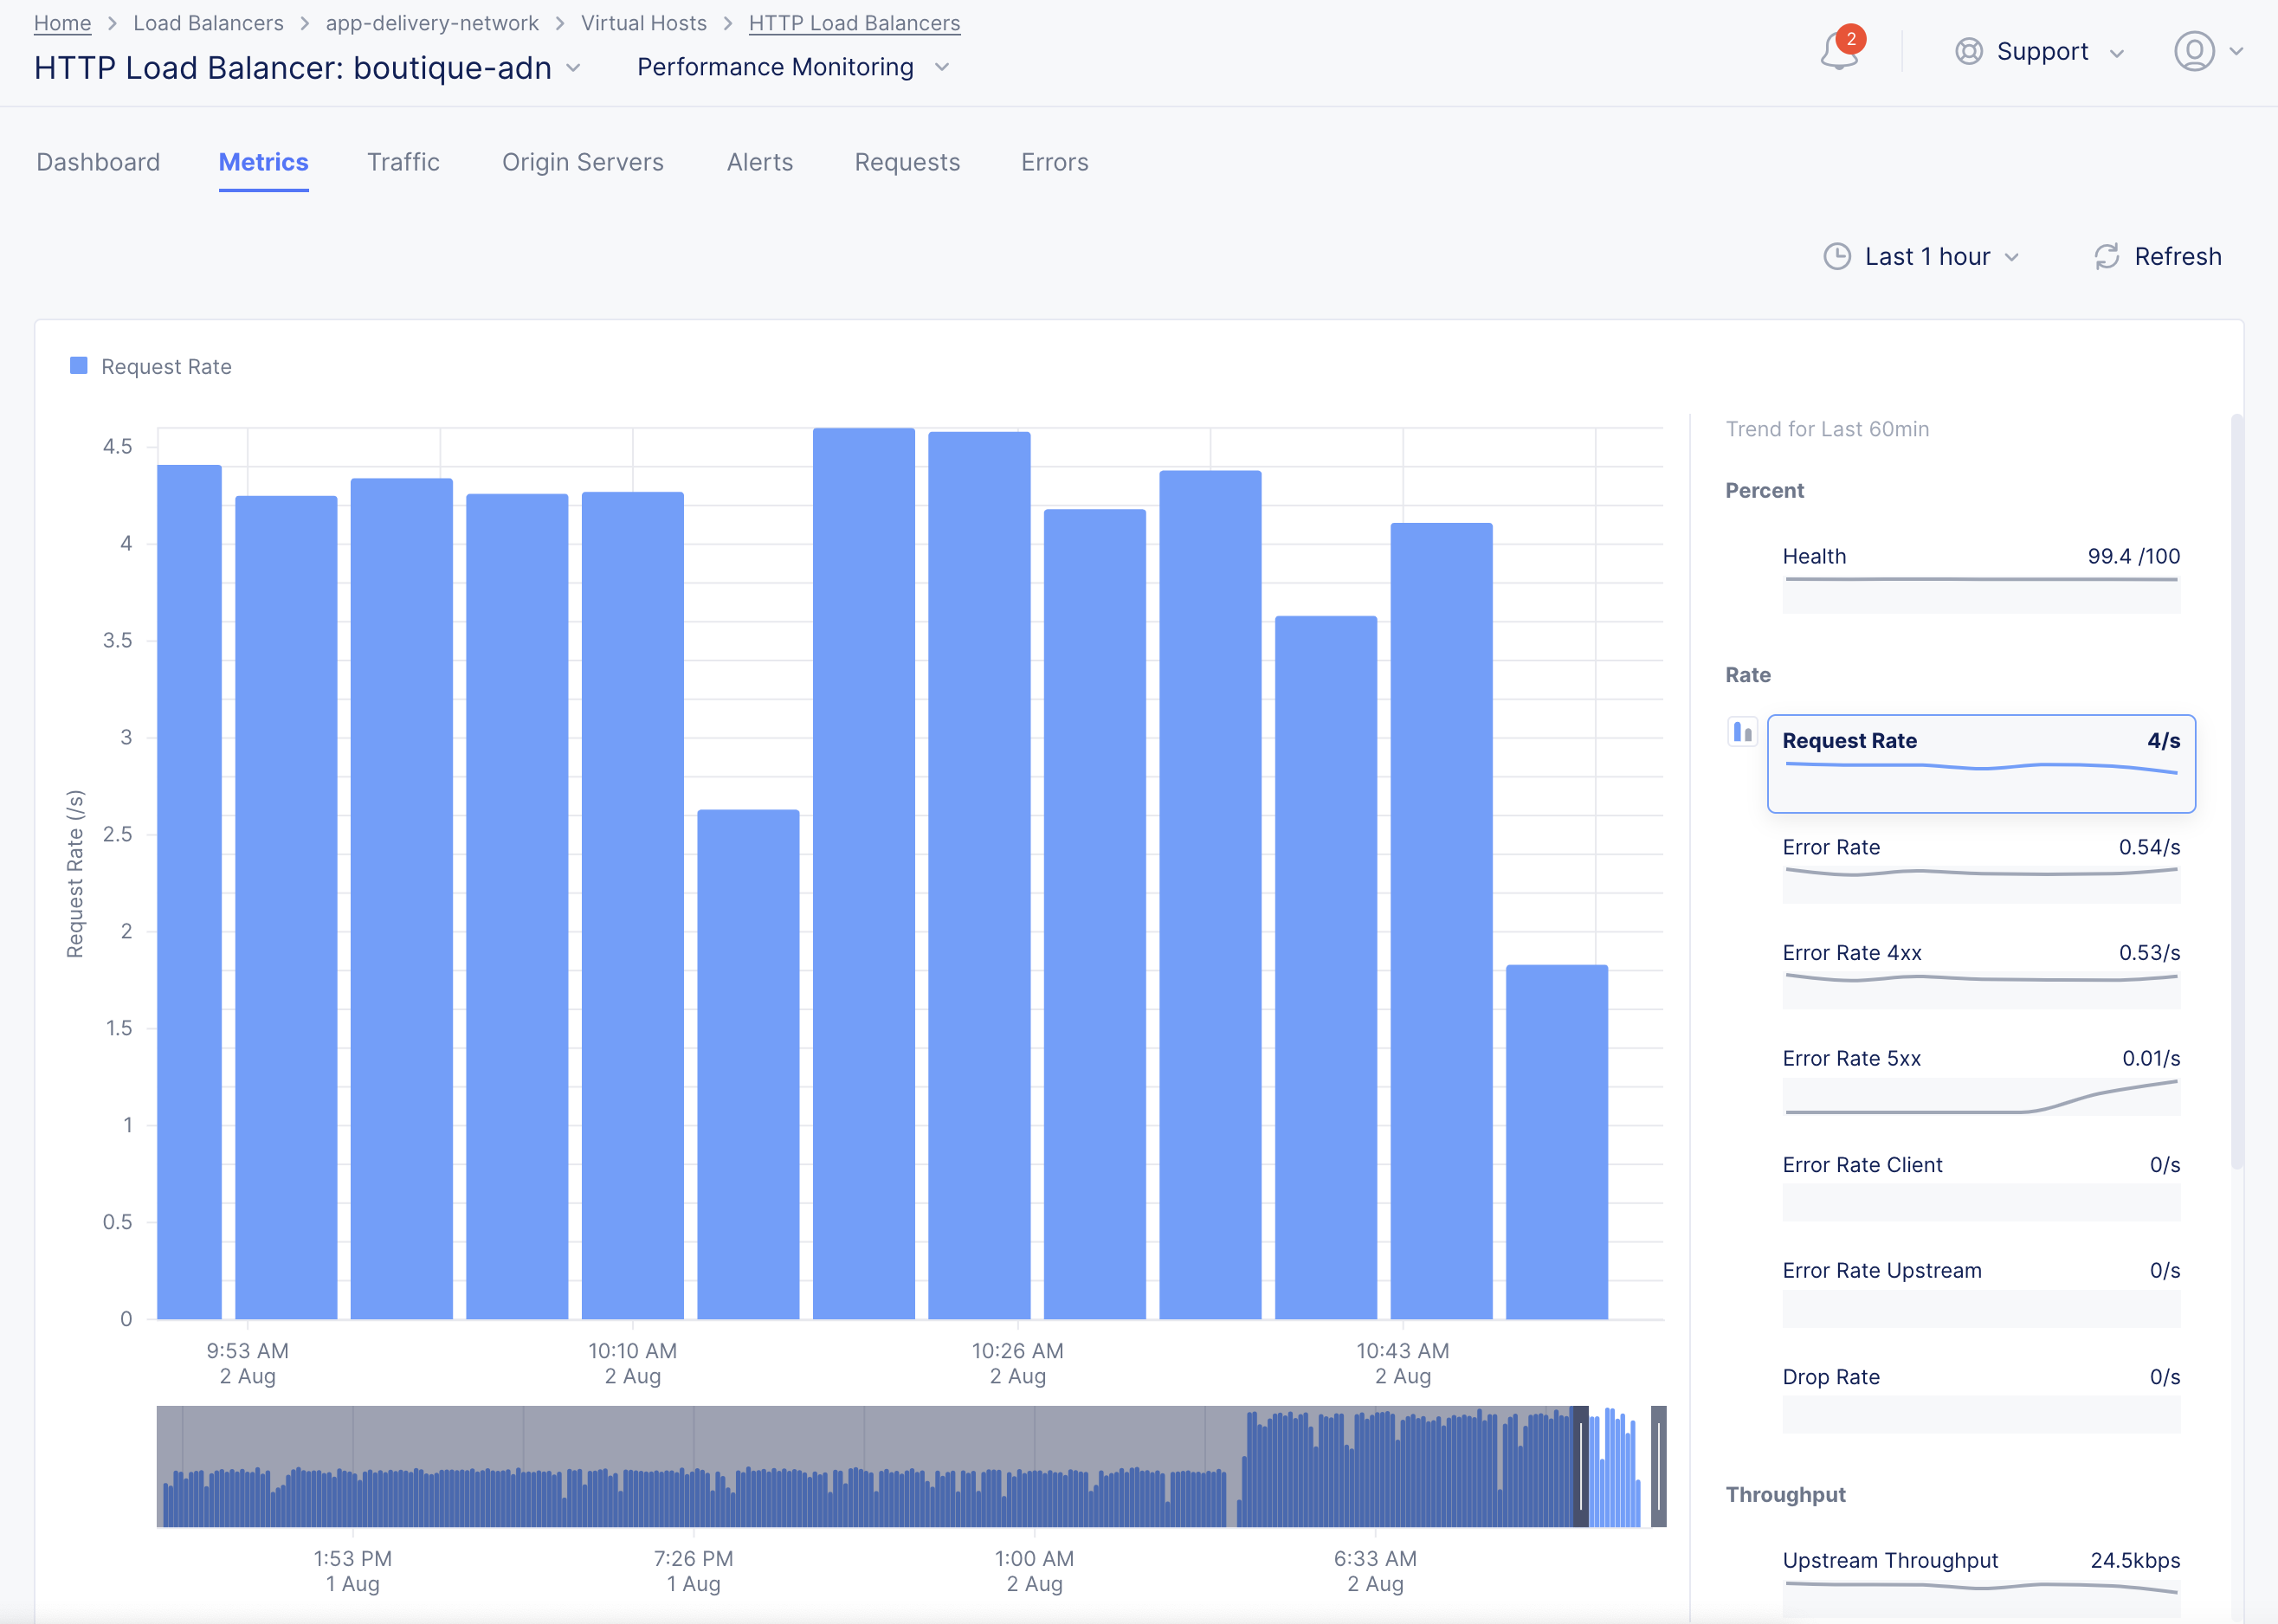
Figure: Load Balancer Metrics with DDoS Detection Enabled
Step 6: Load the load balancer alerts view.
Select Alerts tab to load the alerts view.
Active alerts are displayed by default. Select the All Alerts option to display all alerts for default interval of an hour. You can also change time interval using the Last 1 hour drop down. The value Timeseries-Anomaly for the Group field indicates that the alert is an anomaly. Select > for any alert entry to load details in the JSON format.
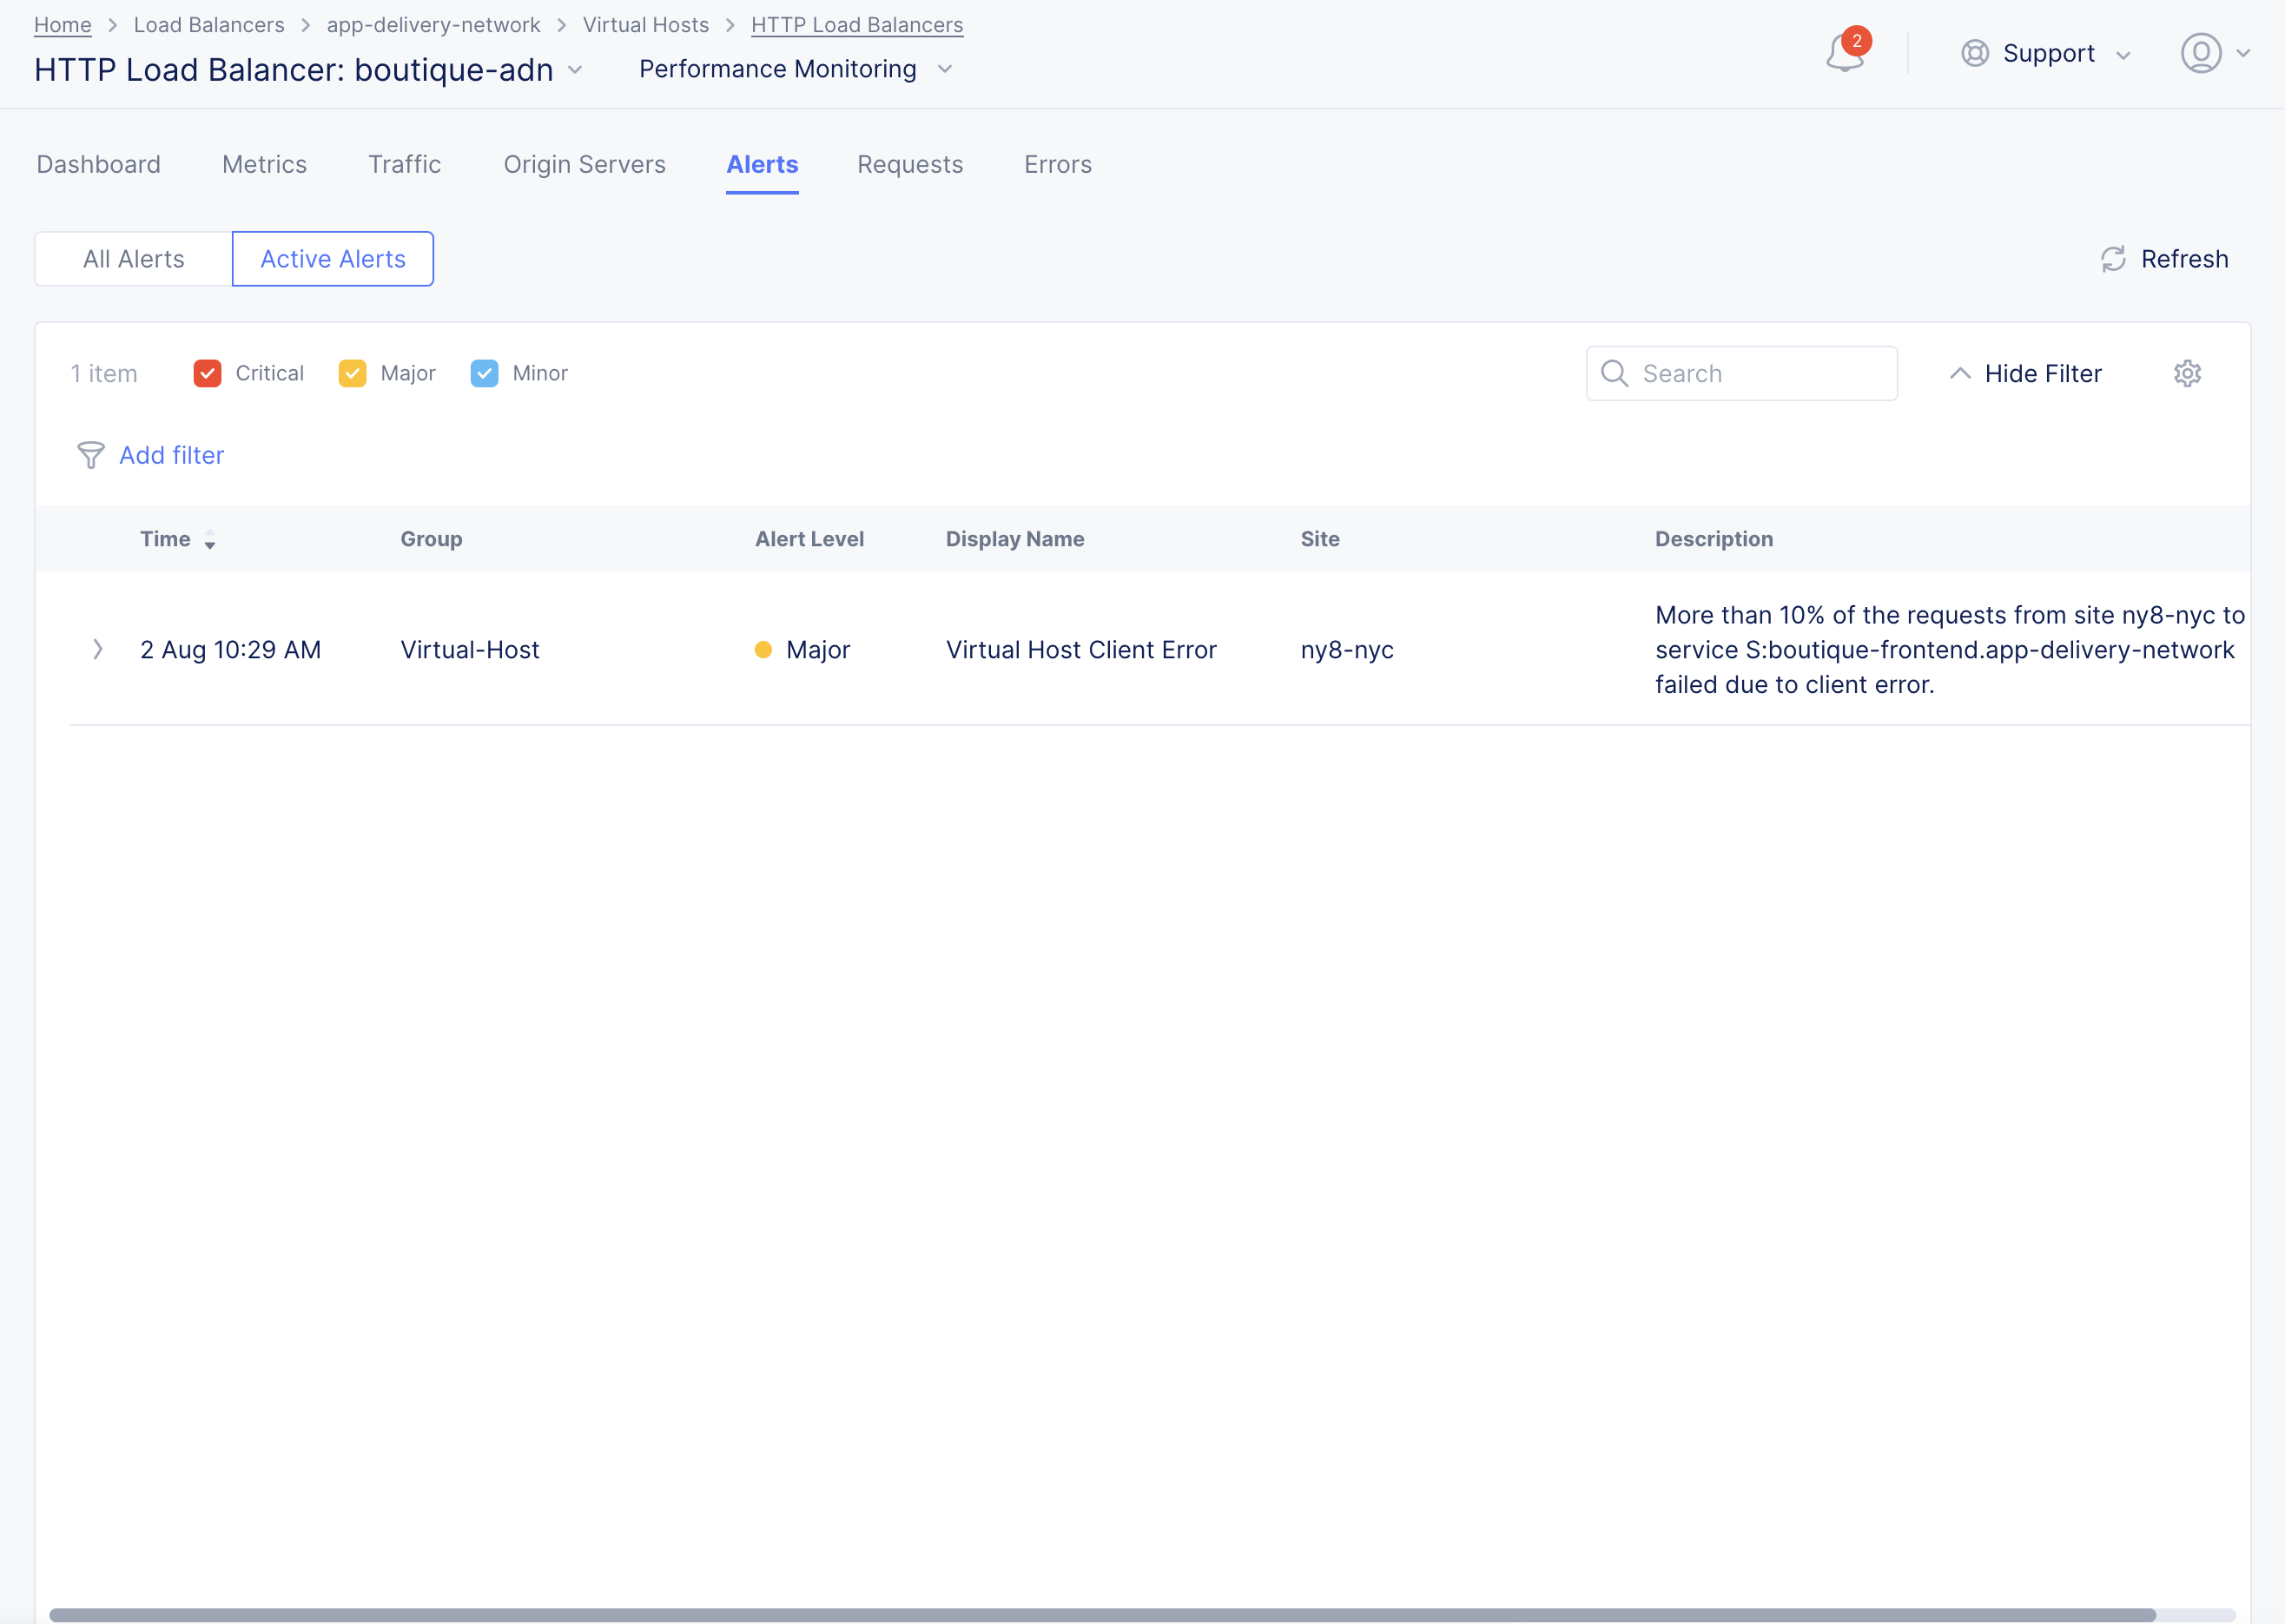
Figure: load balancer DDoS Alerts
Note: See DDoS Alerts for information on time-series related alerts.
Step 7: Tuning L7 DDoS mitigation
L7 DDoS mitigation can be tuned by configuring either a Client-side Challenge or a Service Policy to specify ASNs, source IP addresses or Geolocations, IP Reputation categories, TLS Fingerprints, or other HTTP request criteria which can be allowed. The configured Service Policy is only applied during attack detection and is automatically removed after the attack has ended.
To Configure DoS Protection, follow these steps:
Step 7.1: Configure Mitigation Settings

Figure: Configure Mitigation Settings
-
From the Mitigation Action menu, select an option:
-
Default: This option blocks traffic from suspicious sources. No JavaScript challenge is returned. -
Block: This option blocks traffic from suspicious sources. No JavaScript challenge is returned. -
JavaScript Challenge: This option serves a JavaScript challenge to all traffic from suspicious sources. ClickView Configurationto change the default settings and message for the JavaScript challenge.

Figure: Configure JavaScript Challenge Parameters
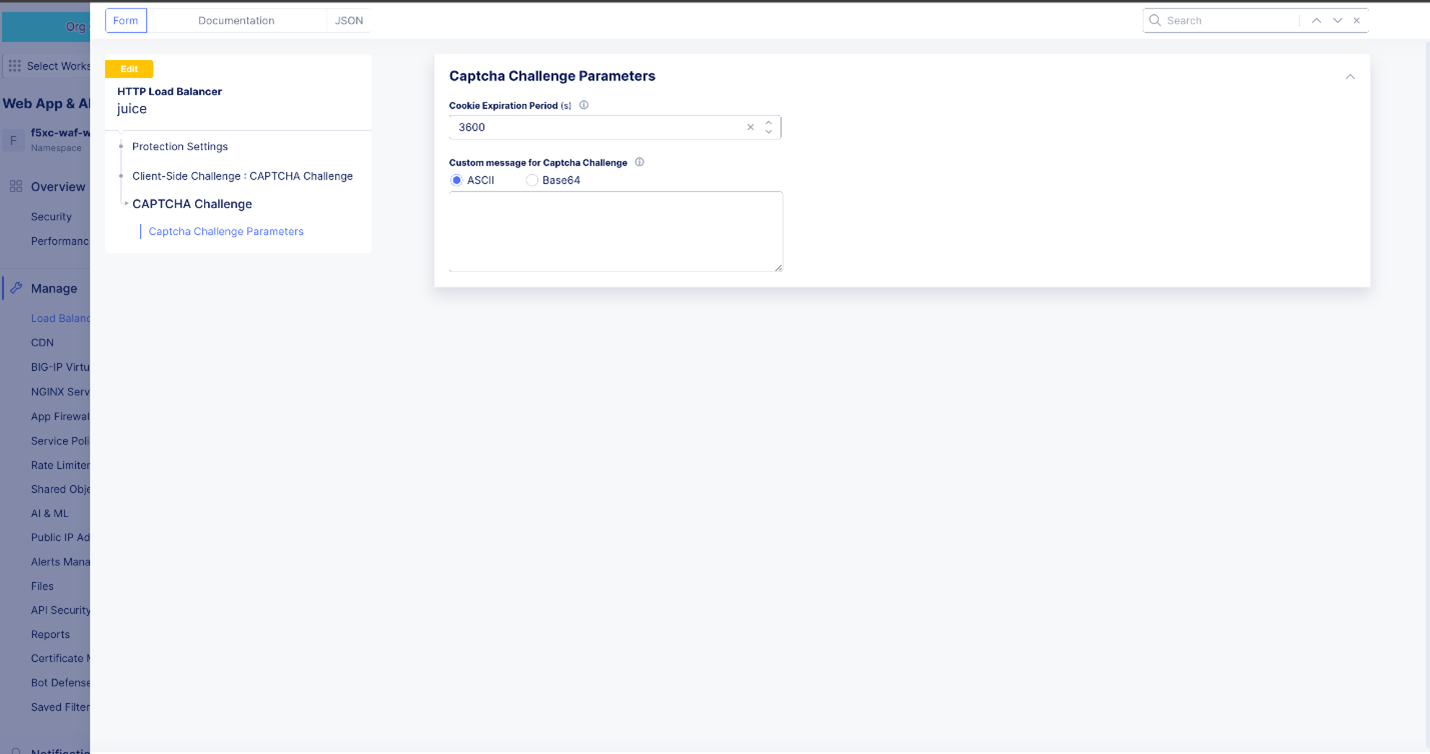
Captcha Challenge: This option serves a Captcha challenge to all traffic from suspicious sources. ClickView Configurationto change the default settings and message for the Captcha challenge.

Figure: Configure Captcha Challenge Parameters
-
-
Configure the Requests Per Second (RPS) threshold for L7 DDoS detection. The default value is 10000. DDoS Mitigation and Protection actions will be applied when the threshold RPS is exceeded, and origin server health degradation is detected.

Figure: Configure RPS Threshold


Step 7.2: Configure Protection Settings

Figure: Configure Mitigation Settings
Follow these steps to apply a client-side challenge for L7 DDos protection:
-
From the Client-side Challenge menu, select an option:
-
Default: This option blocks traffic from suspicious sources. No JavaScript challenge is returned. -
Block: This option blocks traffic from suspicious sources. No JavaScript challenge is returned. -
JavaScript Challenge: This option serves a JavaScript challenge to all traffic from suspicious sources. ClickView Configurationto change the default settings and message for the JavaScript challenge.
Figure: Configure JavaScript Challenge Parameters
Captcha Challenge: This option serves a Captcha challenge to all traffic from suspicious sources. ClickView Configurationto change the default settings and message for the Captcha challenge.

Figure: Configure Captcha Challenge Parameters
-
Follow these steps to apply a Custom Service Policy for automatic L7 DDoS mitigation:
In DoS settings, under the Protection Settings define the Custom Service Policy. Select Custom to define the Custom Service Policy.
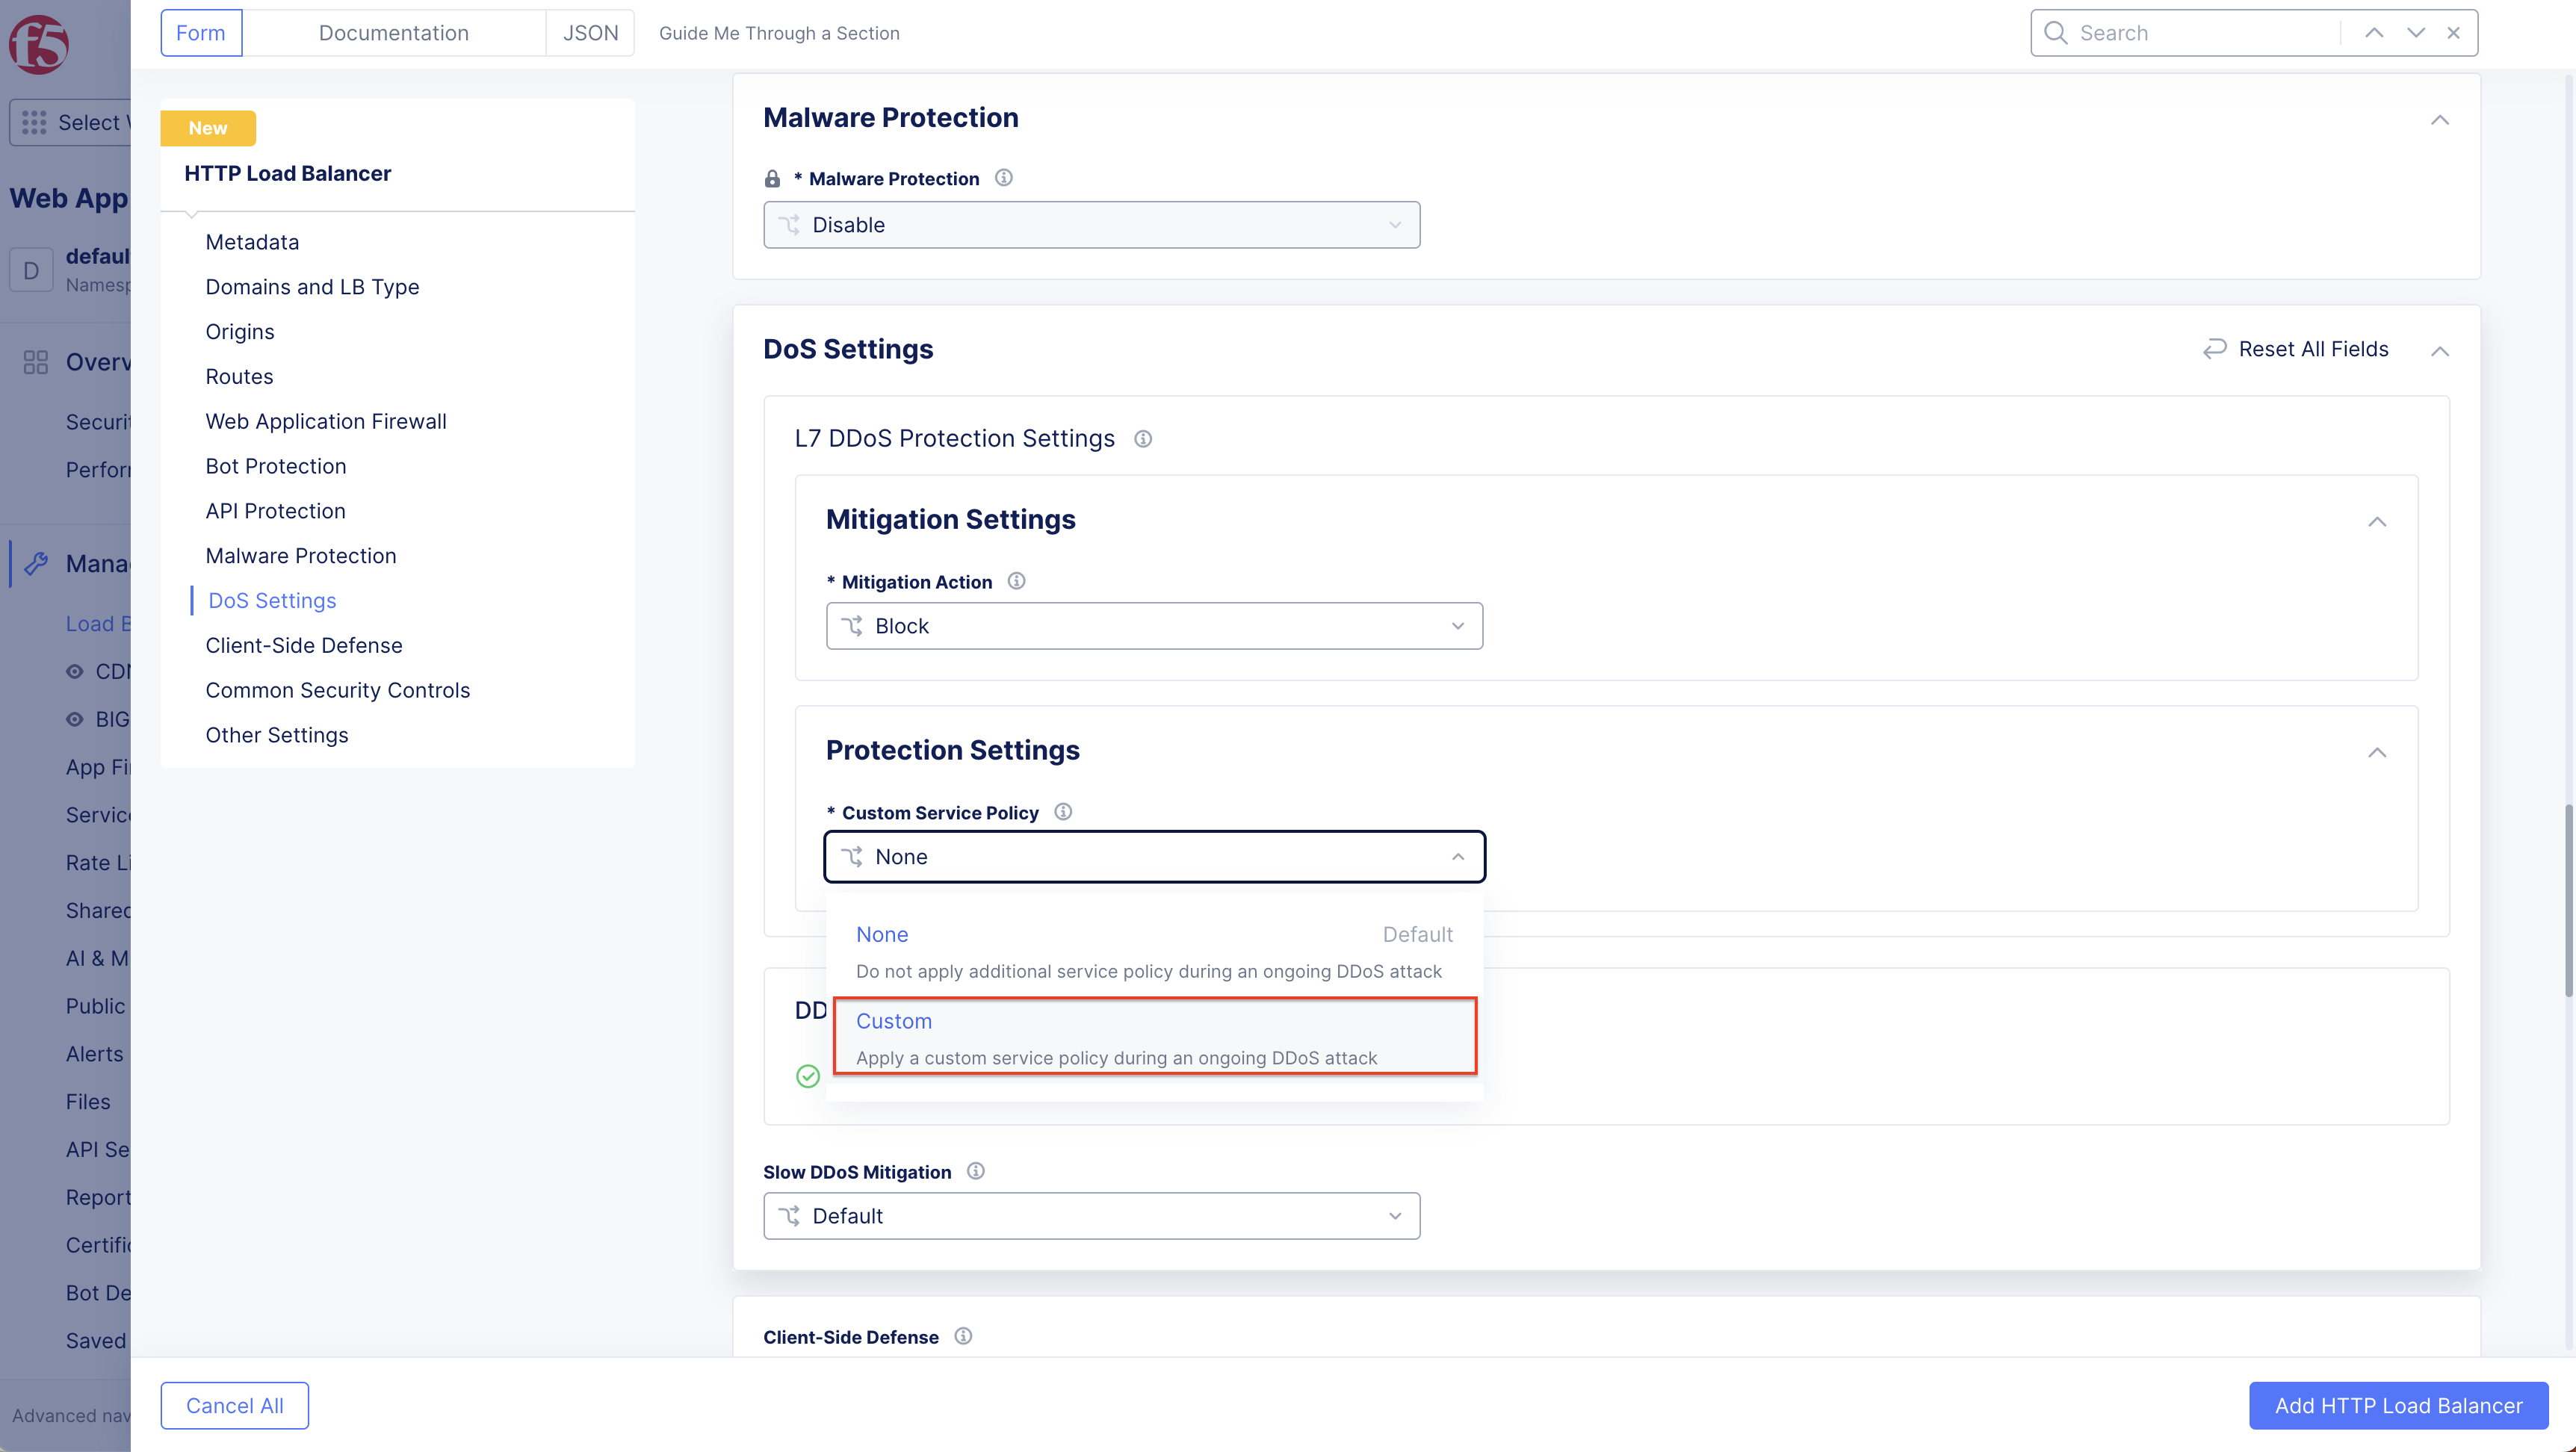
Figure: Select Custom Option
Figure: Select Custom Option
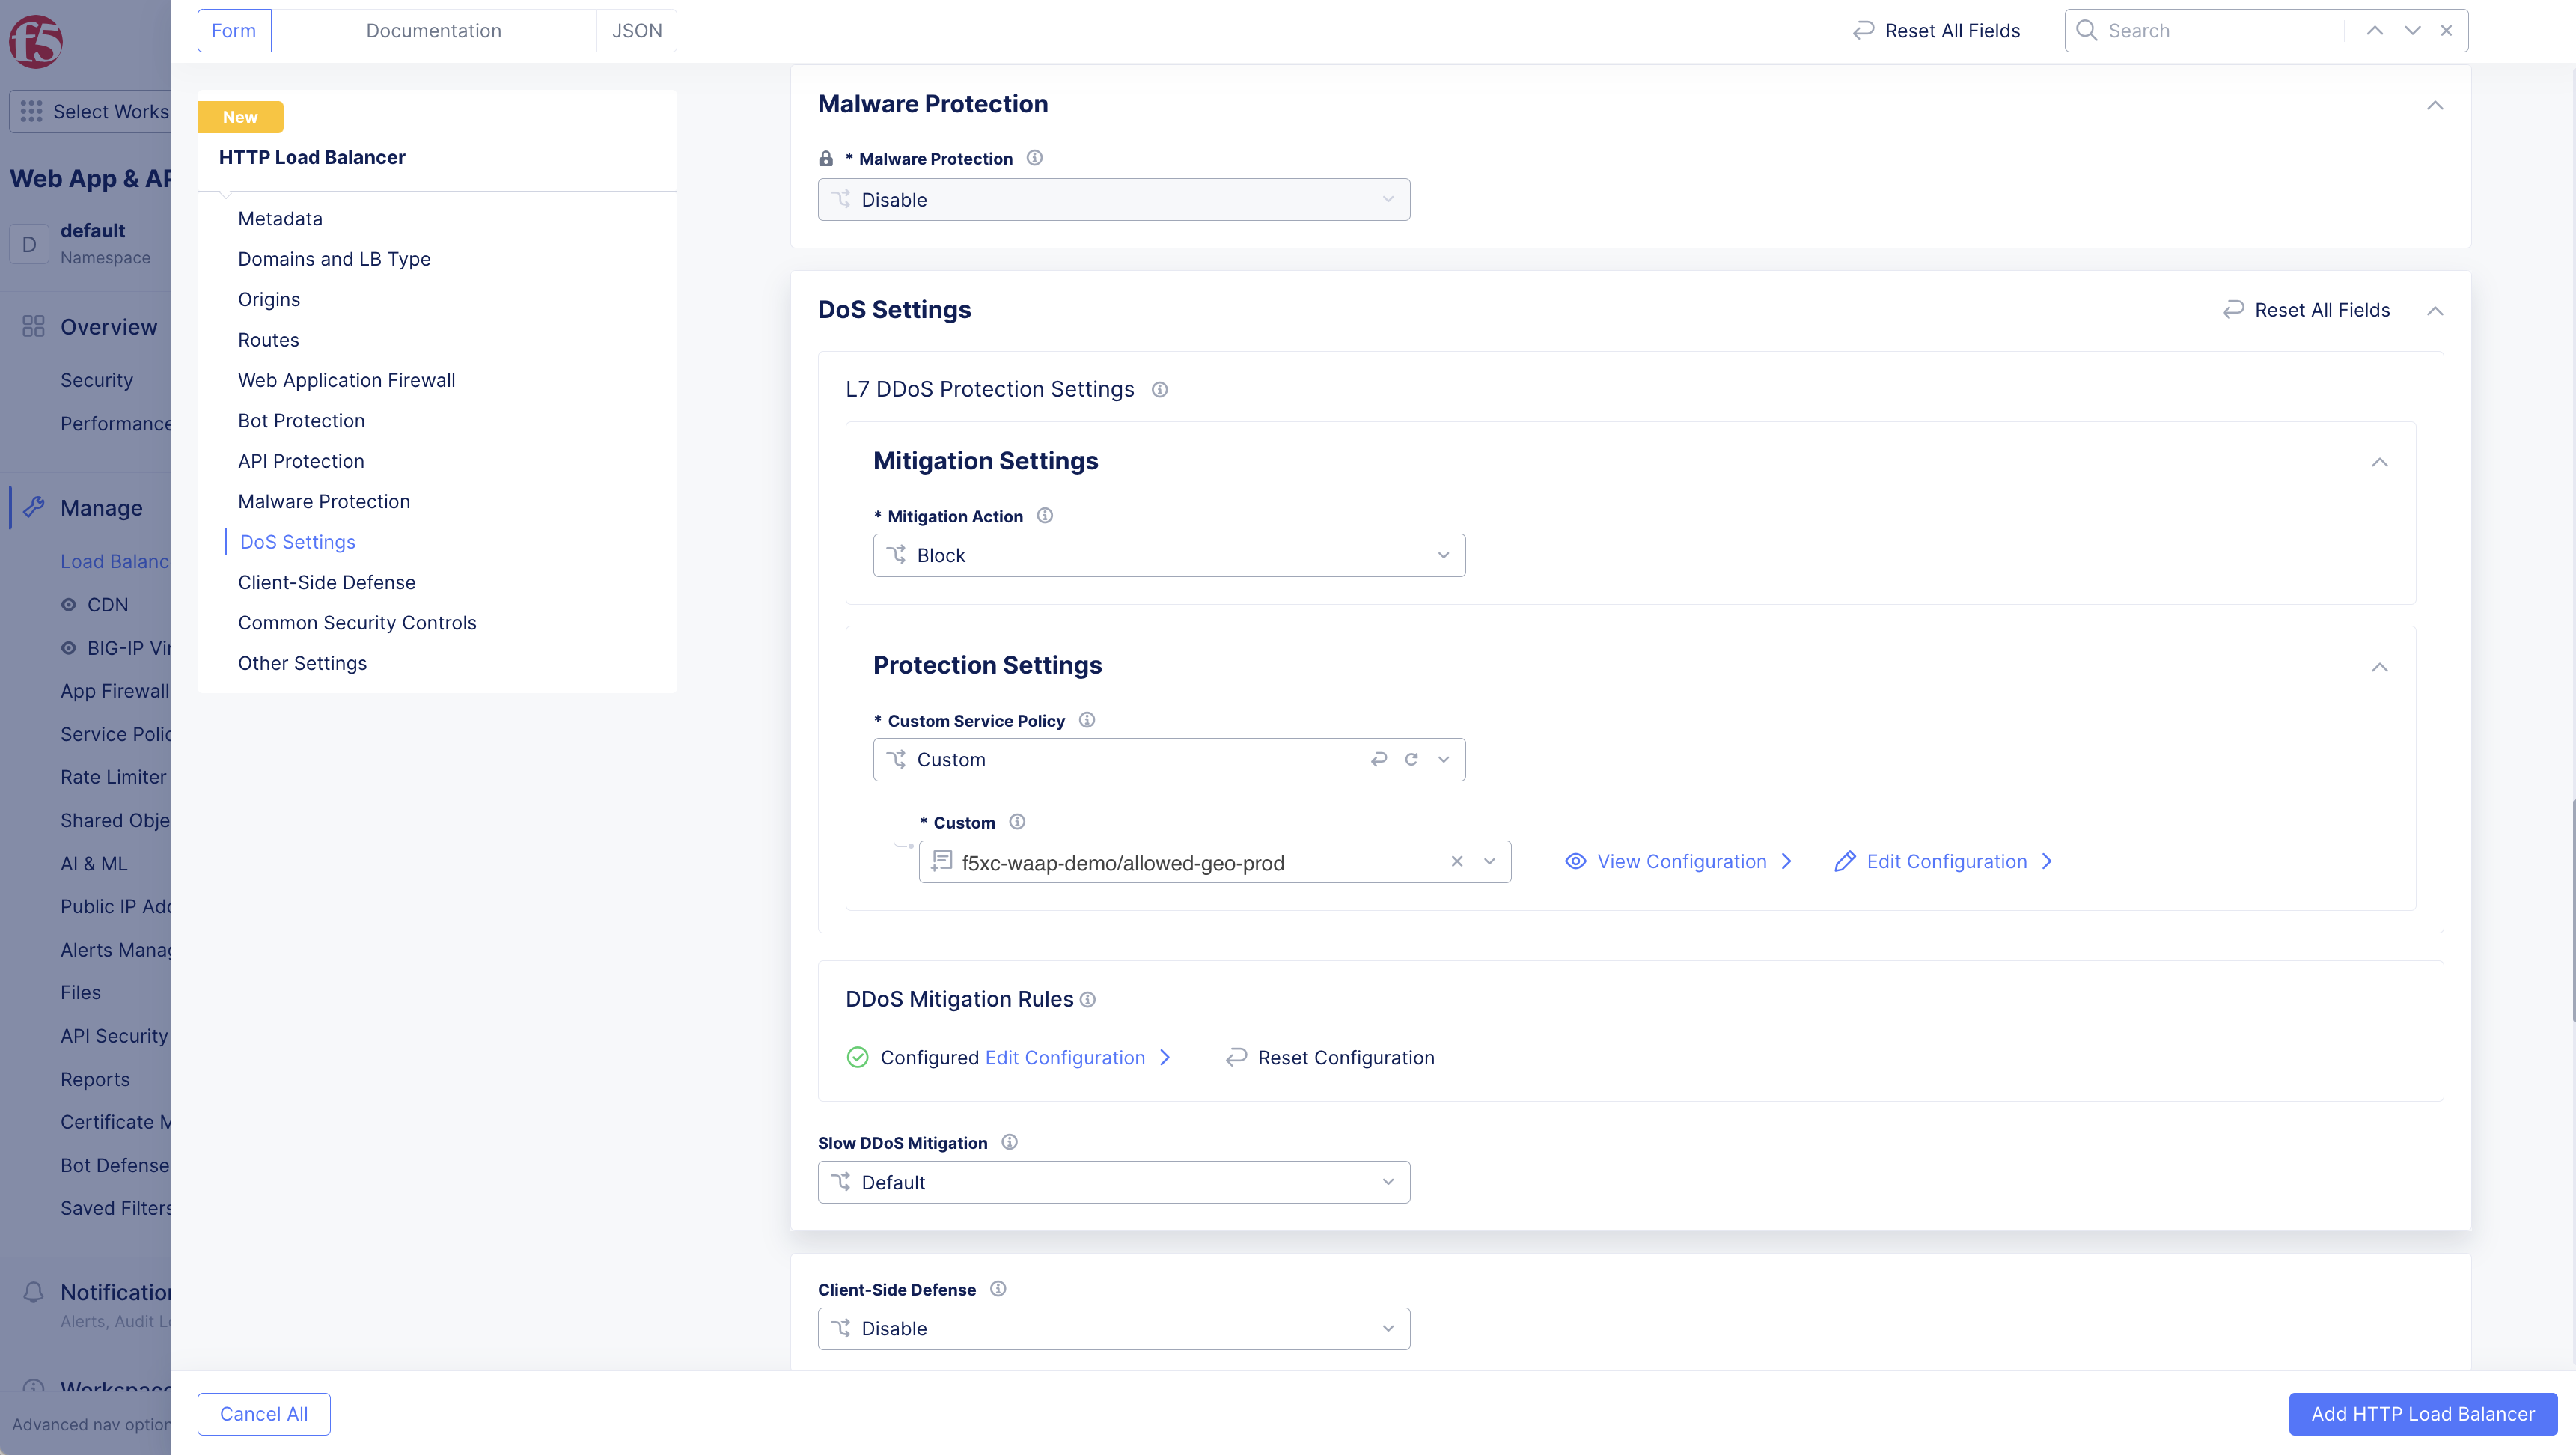
Figure: Define Custom Policy Name
Step 7.3: Configure Mitigation Rules
Under DDoS Mitigation Rules, select Configure to open the rules list page. Use Add Item to add a rule:
-
In the
DDoS Mitigation Rulepage, set a name for the rule. -
Select a choice for the
Mitigation Choicemenu. The mitigation choice can be either a list of IP addresses or combination of ASN, Region, and TLS Fingerprinting. -
Click
Applyto add the rule to the list of rules. -
Click
Applyto add the rules list to the DDoS protection configuration.
Step 7.4: Configure Slow DDos Mitigation
From the Slow DDoS Mitigation menu, select an option:
- For the
Customoption, enterRequest Headers TimeoutandTotal Request Timeoutvalues.
Note: See the
Explore Security Monitoringsection in the Monitor HTTP Load balancer guide to learn more about observing and reacting to an active DDoS attack.