Application Traffic Insight
Objective
This guide provides instructions on how to enable F5 Application Traffic Insight (ATI) and apply it on your applications using F5® Distributed Cloud Console. For more information on ATI, see About Application Traffic Insight.
Using the instructions provided in this guide, you can enable ATI from Distributed Cloud Console, obtain the ATI JavaScript and apply it to your application, and monitor the data collected by ATI using various dashboard views in Distributed Cloud Console.
Prerequisites
-
An F5 Distributed Cloud Account. If you do not have an account, see Getting Started with Console.
-
A valid BIG-IP or NGINX subscription if you are deploying with BIG-IP or NGINX.
Enable ATI
To enable ATI on Distributed Cloud Console, do the following;
Step 1: In the Distributed Cloud Console home page, click Application Traffic Insight.
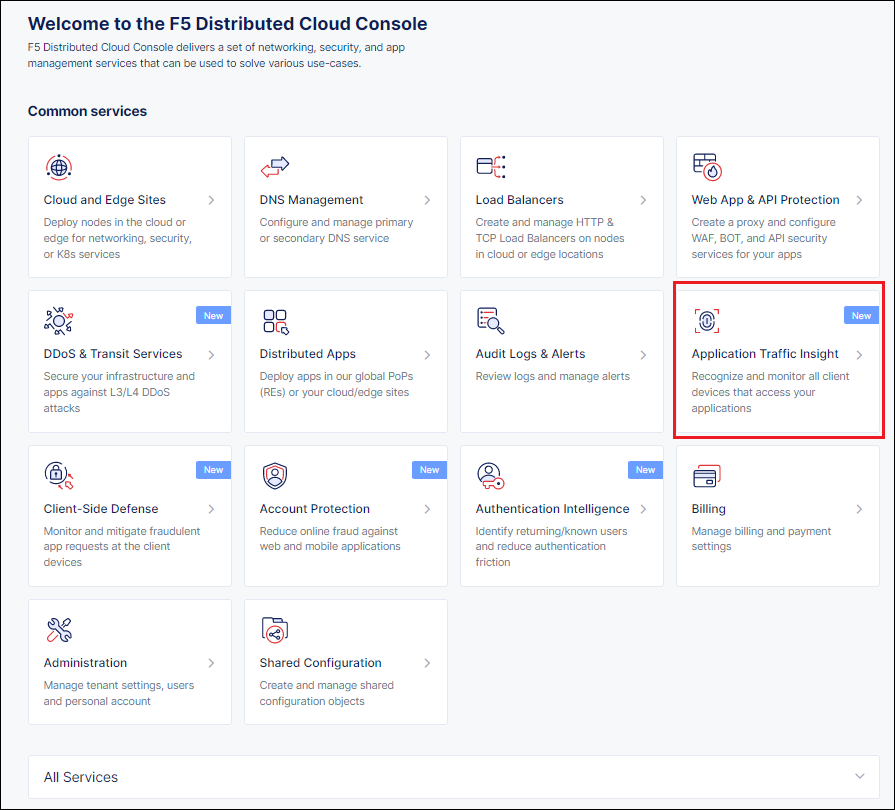
Figure: Navigate to ATI Page
Step 2: In the ATI enablement page that appears, click Enable Application Traffic Insight.
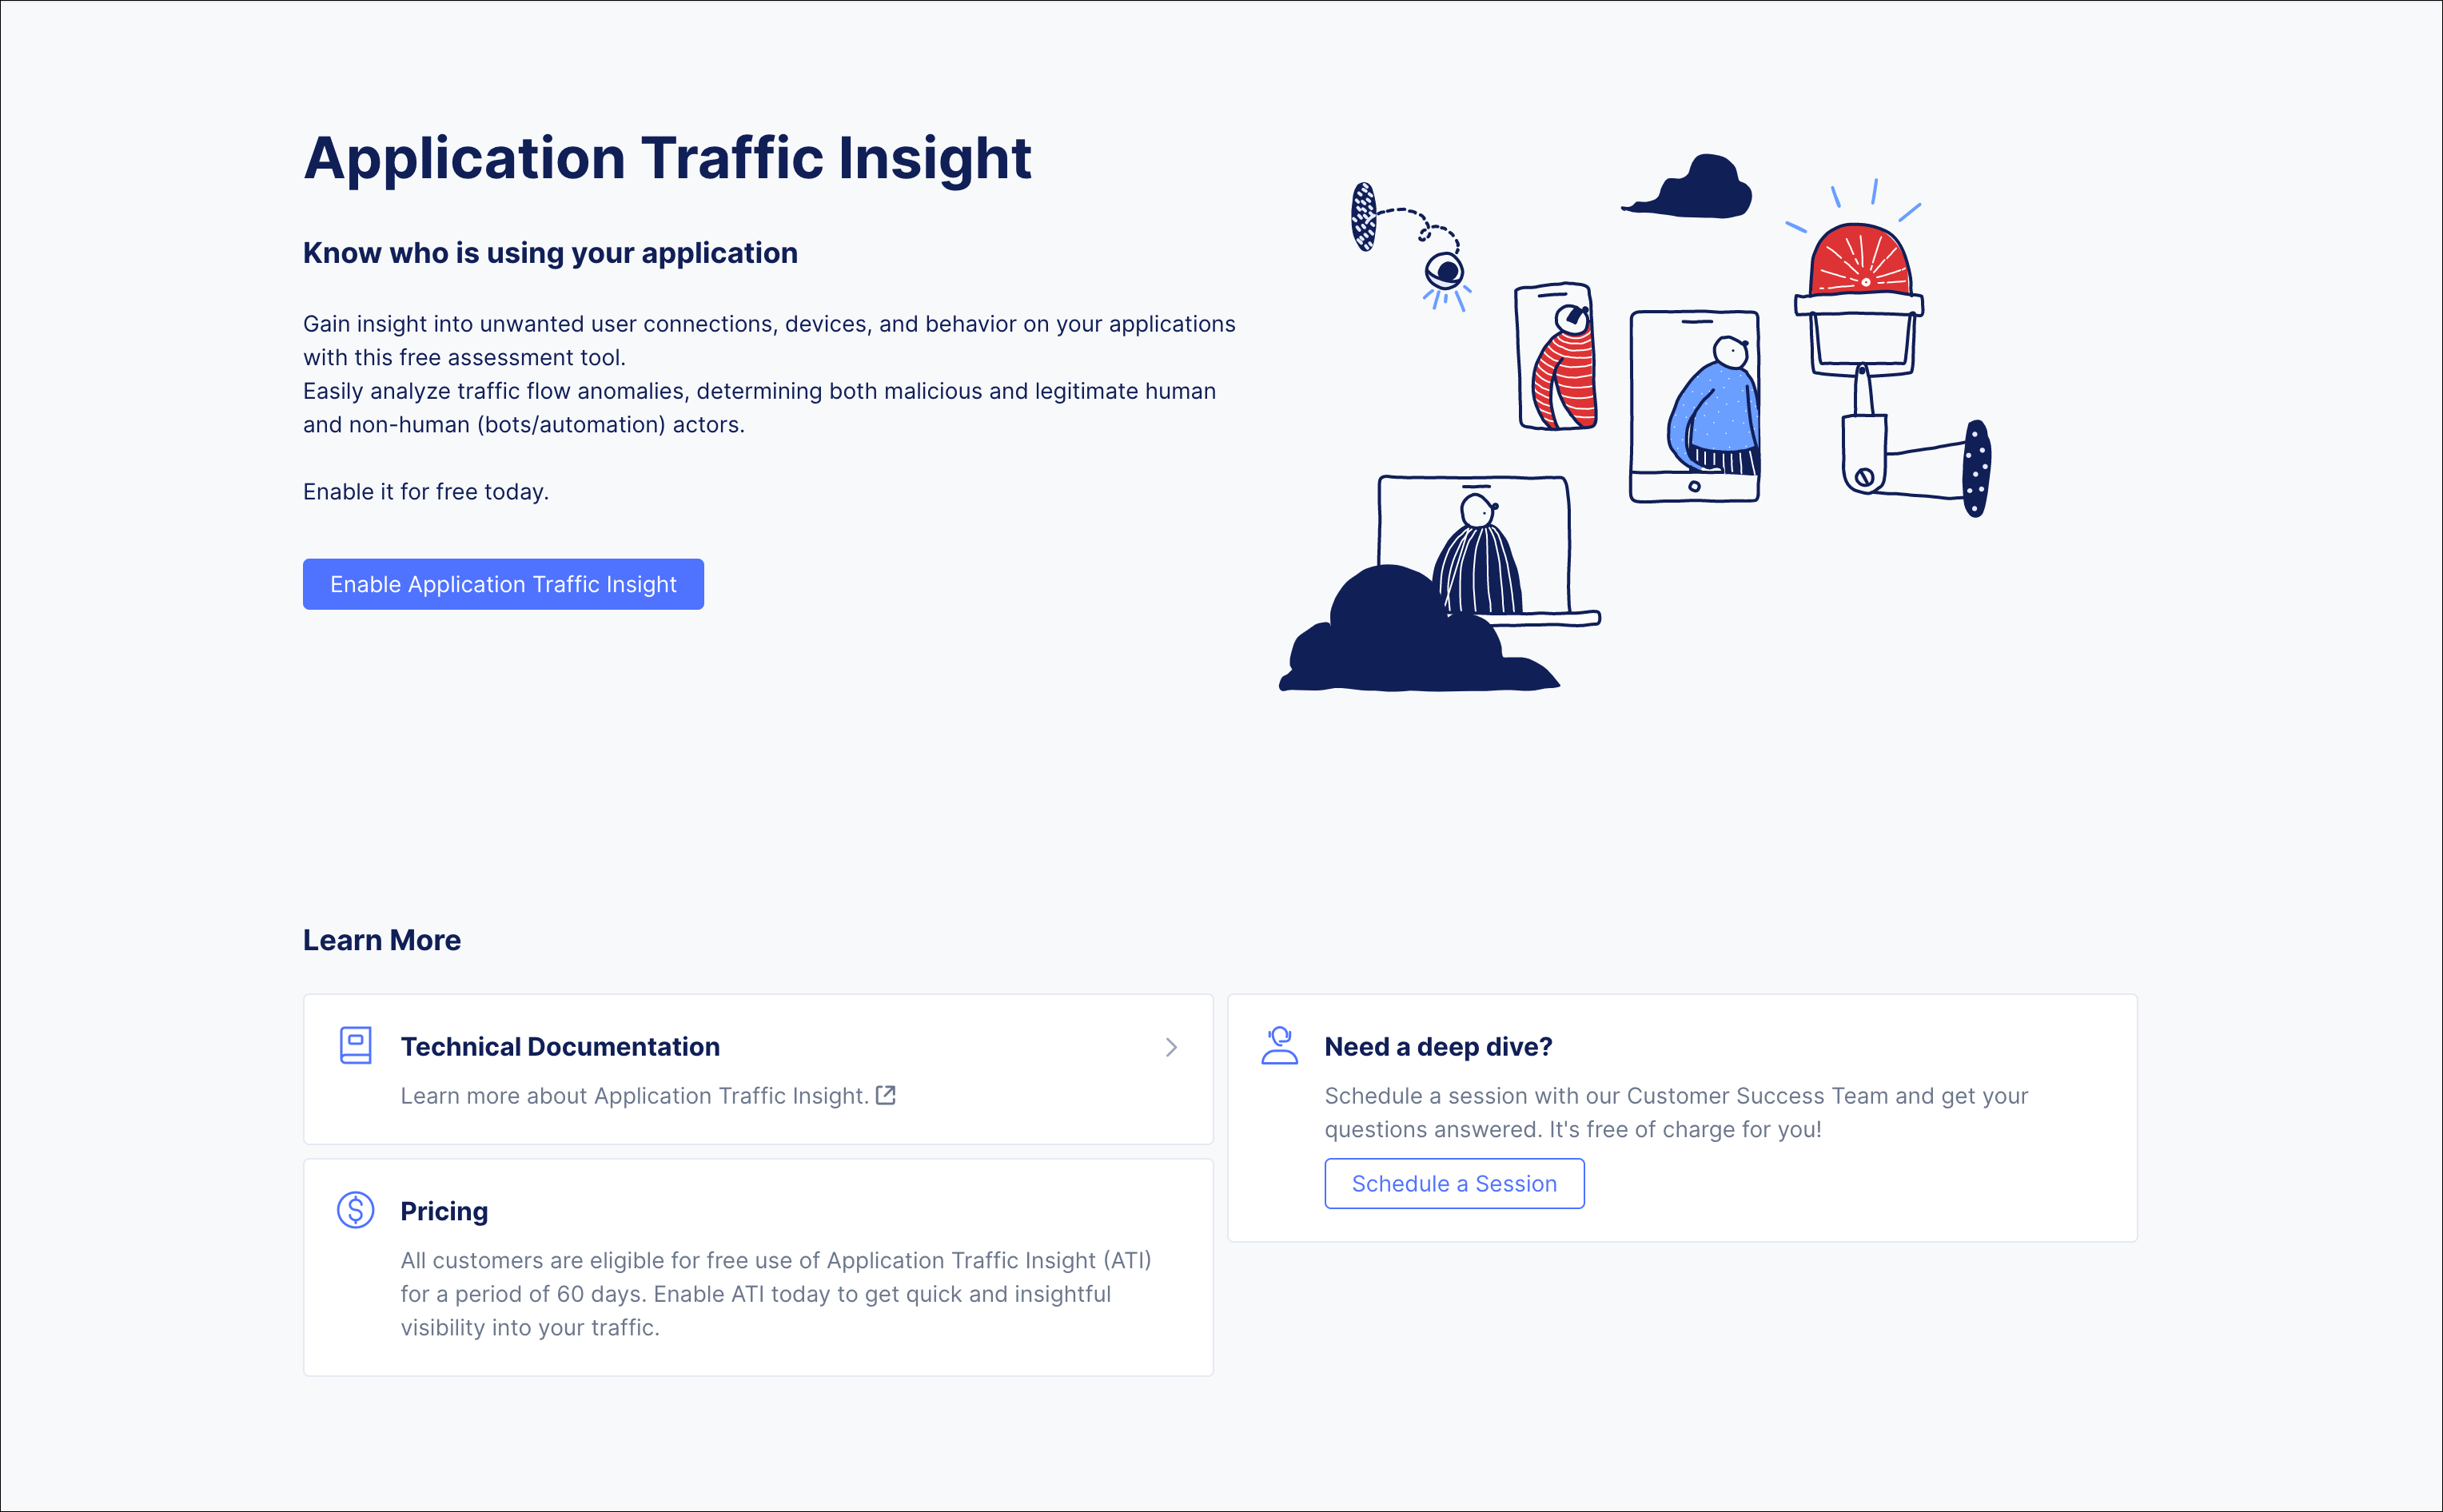
Figure: Enable ATI
Step 3: In the Select Region screen that appears, select the region that best matches your customer-base and click Next.
The region you select here will determine where data is stored and processed. After selecting a region, you cannot later change this setting and it is valid for all applications that you configure on ATI.
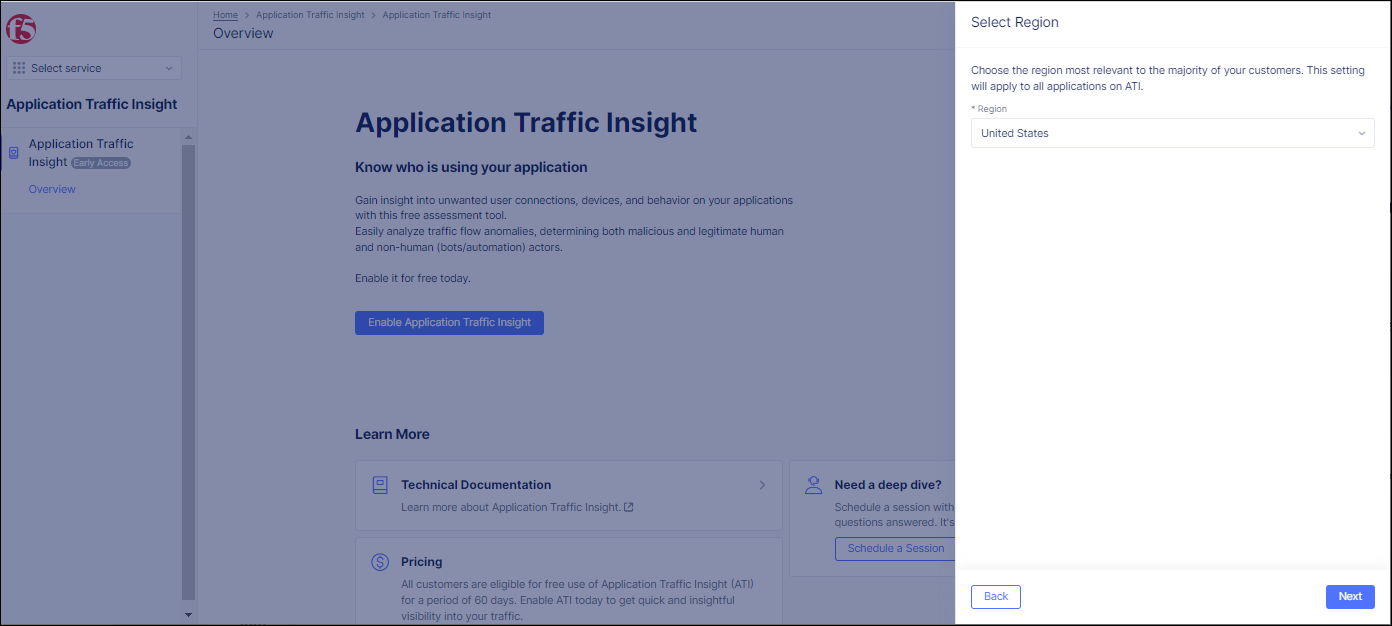
Figure: ATI Enabled
Step 4: If you are ready to deploy ATI on your web application, select a JS injection method and follow the instructions below for deploying ATI on your web application.
Deploy ATI on Your Web Application
ATI is deployed on your web application by injecting the ATI JavaScript (JS) on the web pages of your application, according to one of the following methods:
- Using a JavaScript tag
- Using a BIG-IP iApp
- Using NGINX
Note: F5 recommends deploying ATI on all web pages in your application. If for some reason a customer prefers not to deploy on all web pages, F5 recommends at least deploying on all login pages.
Deploy ATI with a JavaScript Tag
Do the following to deploy ATI with a JavaScript tag:
Step 1: Add an application in Distributed Cloud Console.
- In the navigation menu on the left, go to
Manage->App Configuration.
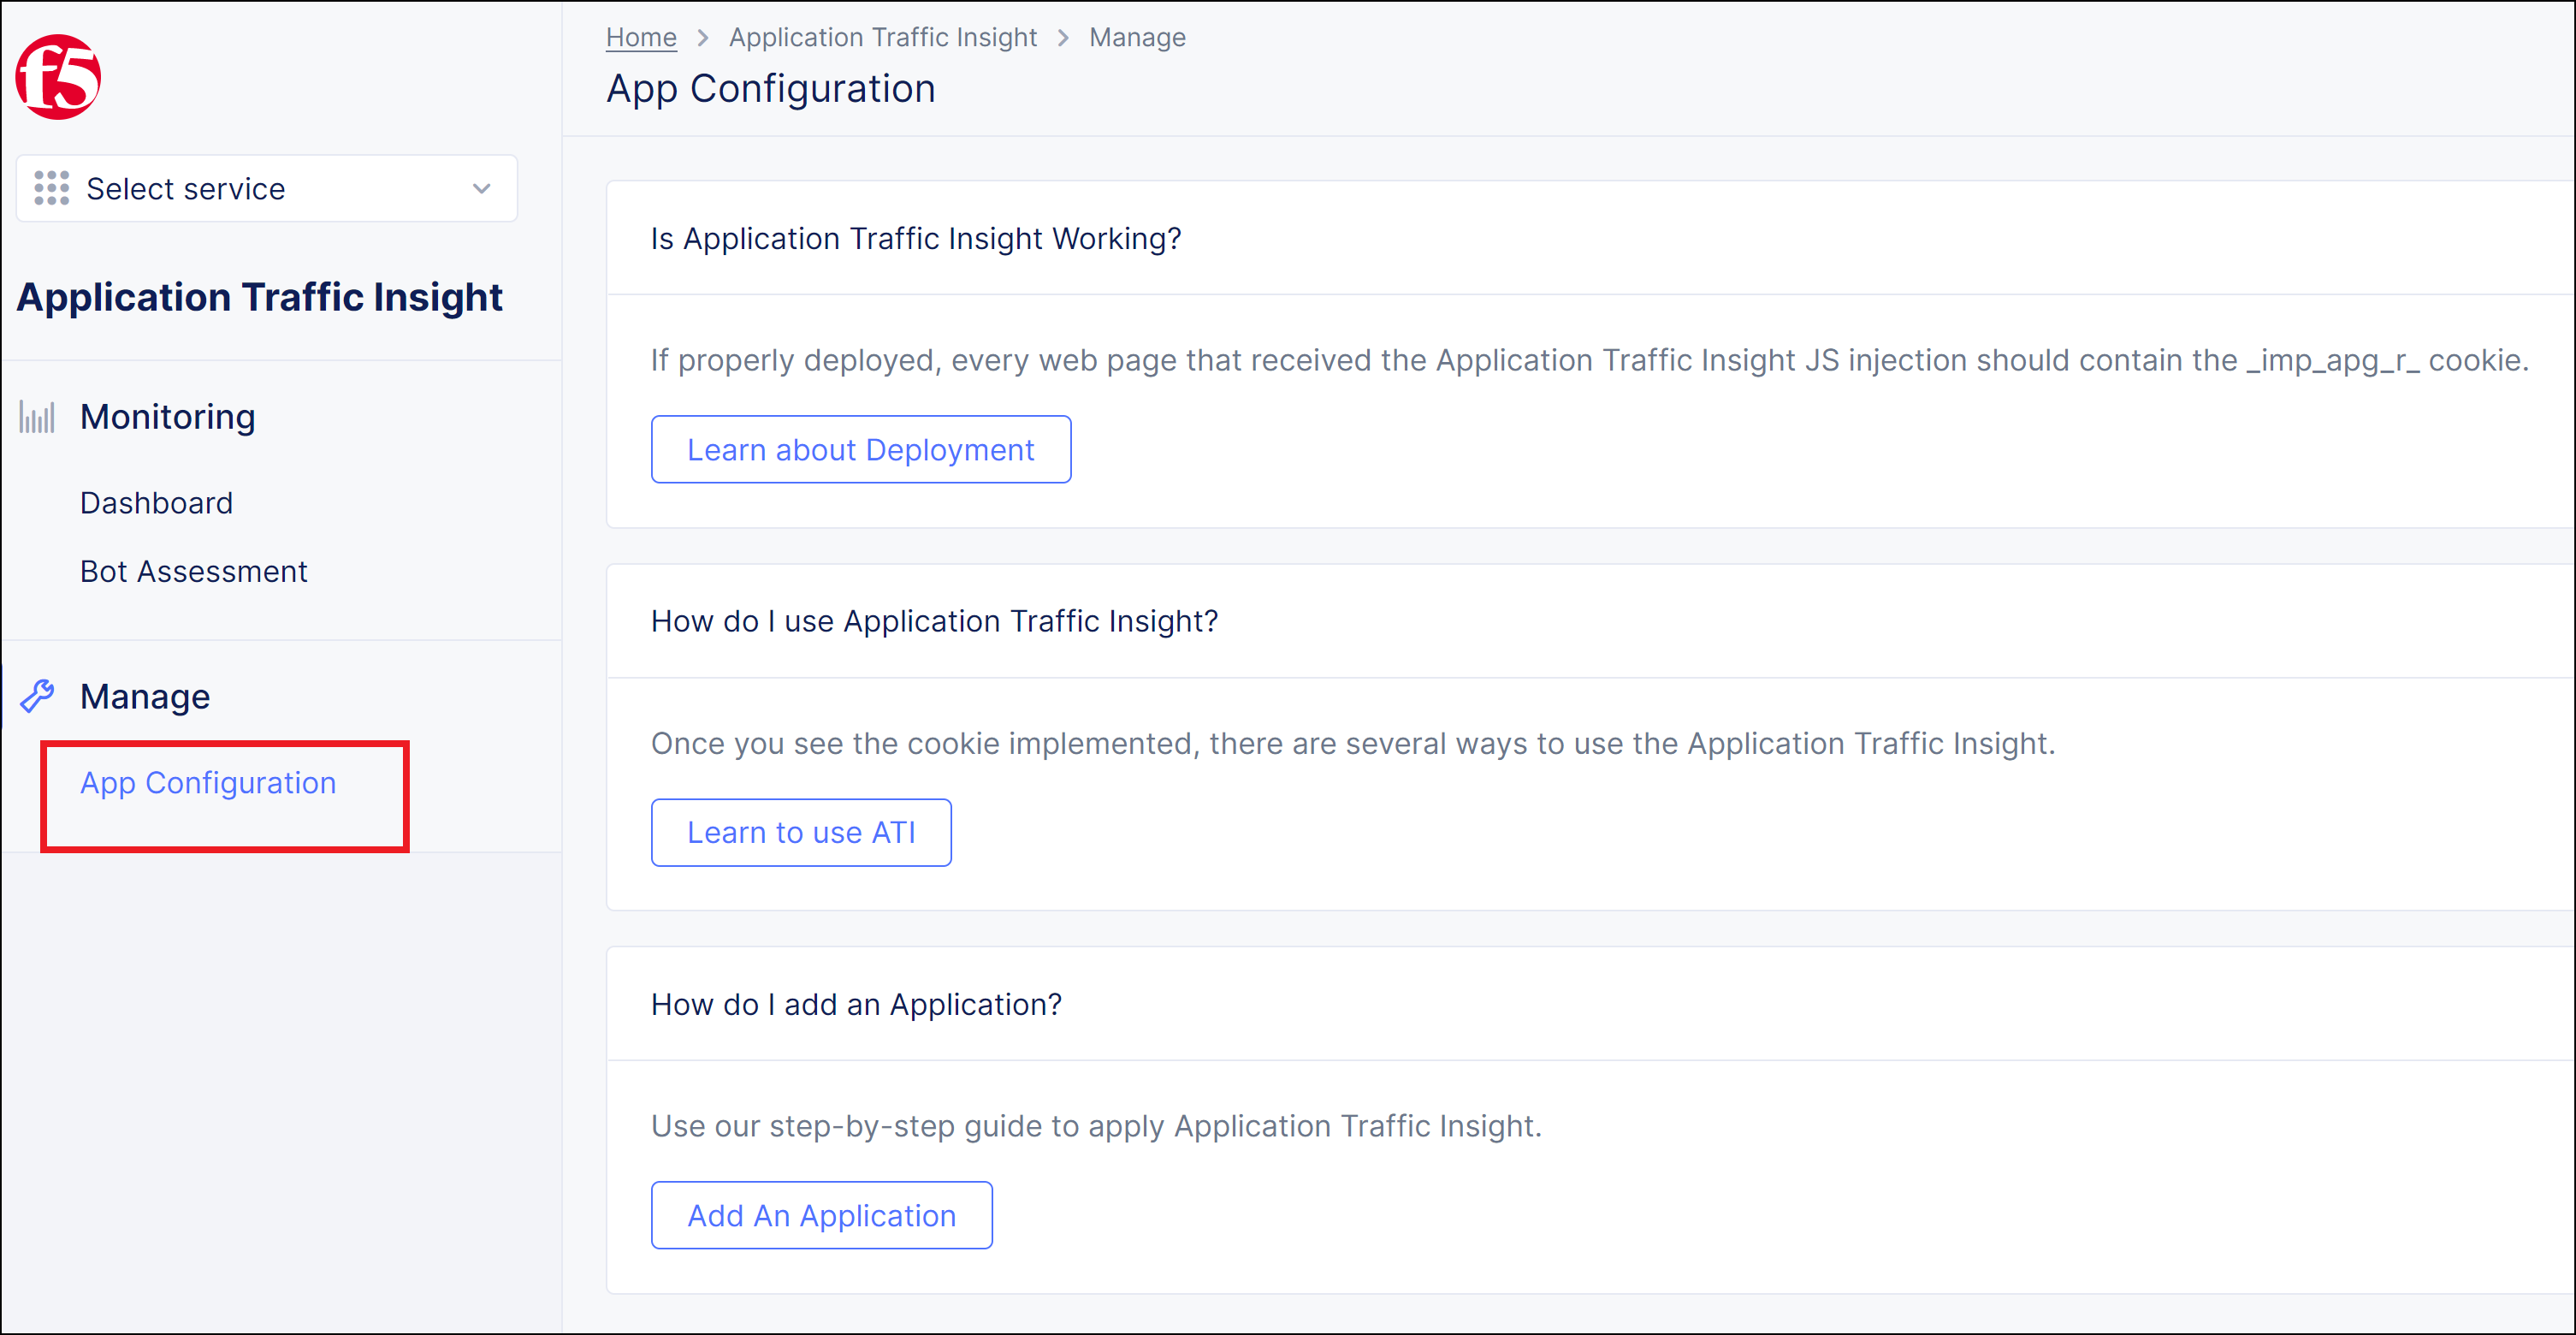
Figure: App Configuration Tab
- Click
Add an Application.
Step 2: Select JS Tag for the ATI deployment method.
- In the
Add Applicationpane, selectJS Tagfor the deployment method.
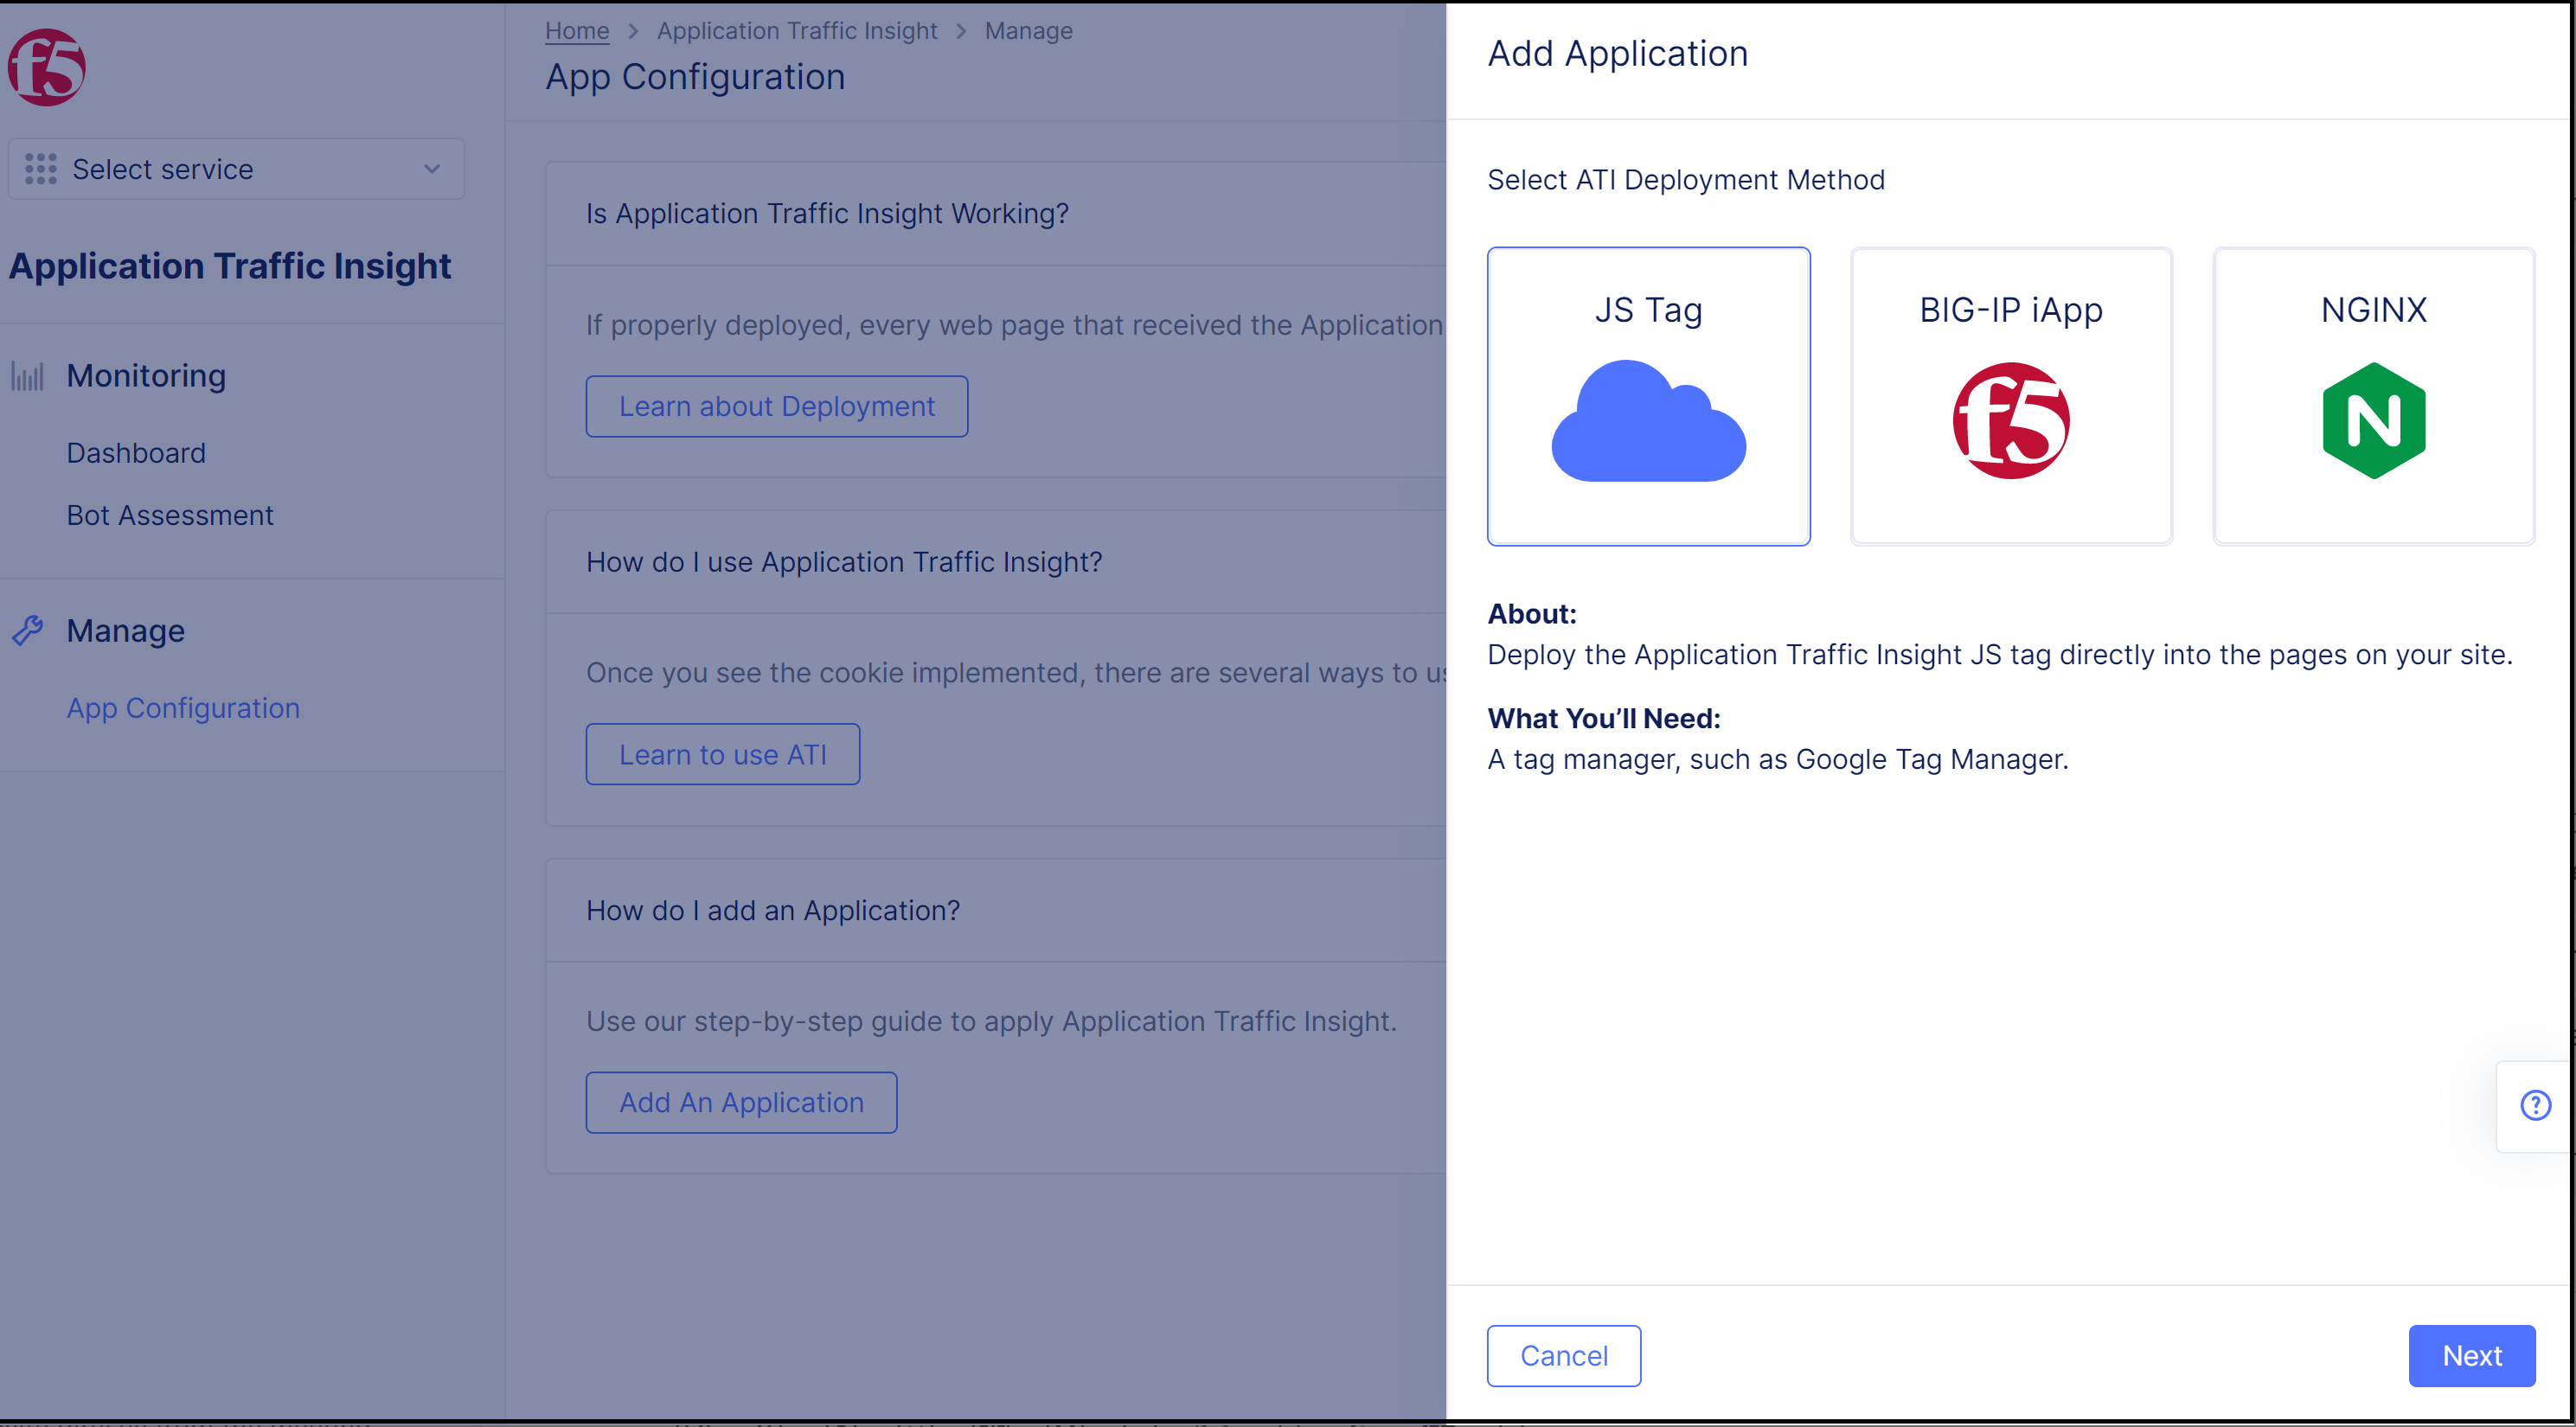
Figure: Select JS Tag for Deployment Method
- Click
Next. Instructions for enabling ATI with the JS tag appear in the pane.
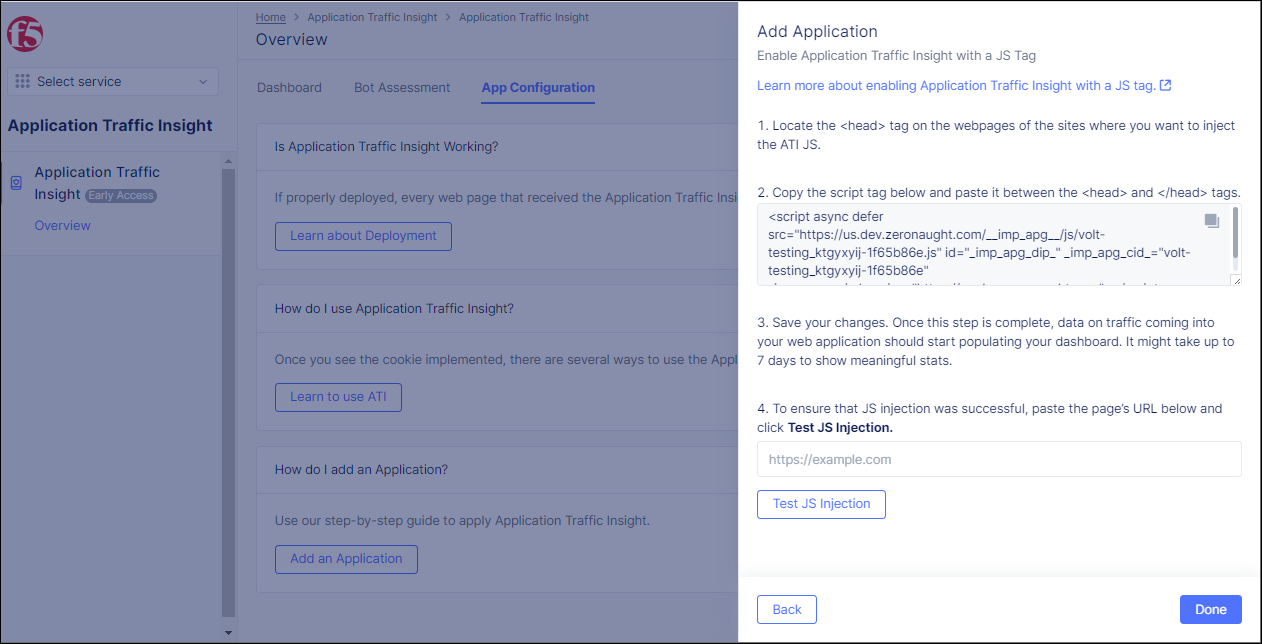
Figure: Java Script Method Instructions
- Follow the instructions for enabling ATI with the JS tag, and click
Donewhen finished.
Deploy ATI with the BIG-IP
Deploy ATI with the BIG-IP by creating a BIG-IP iApp. Follow the steps below:
Step 1: Add an application in Distributed Cloud Console.
- In the navigation menu on the left, go to
Manage->App Configuration.
Figure: App Configuration Tab
- Click
Add an Application.
Step 2: Select BIG-IP iApp for the ATI deployment method.
- In the
Add Applicationpane, selectBIG-IP iAppfor the deployment method.
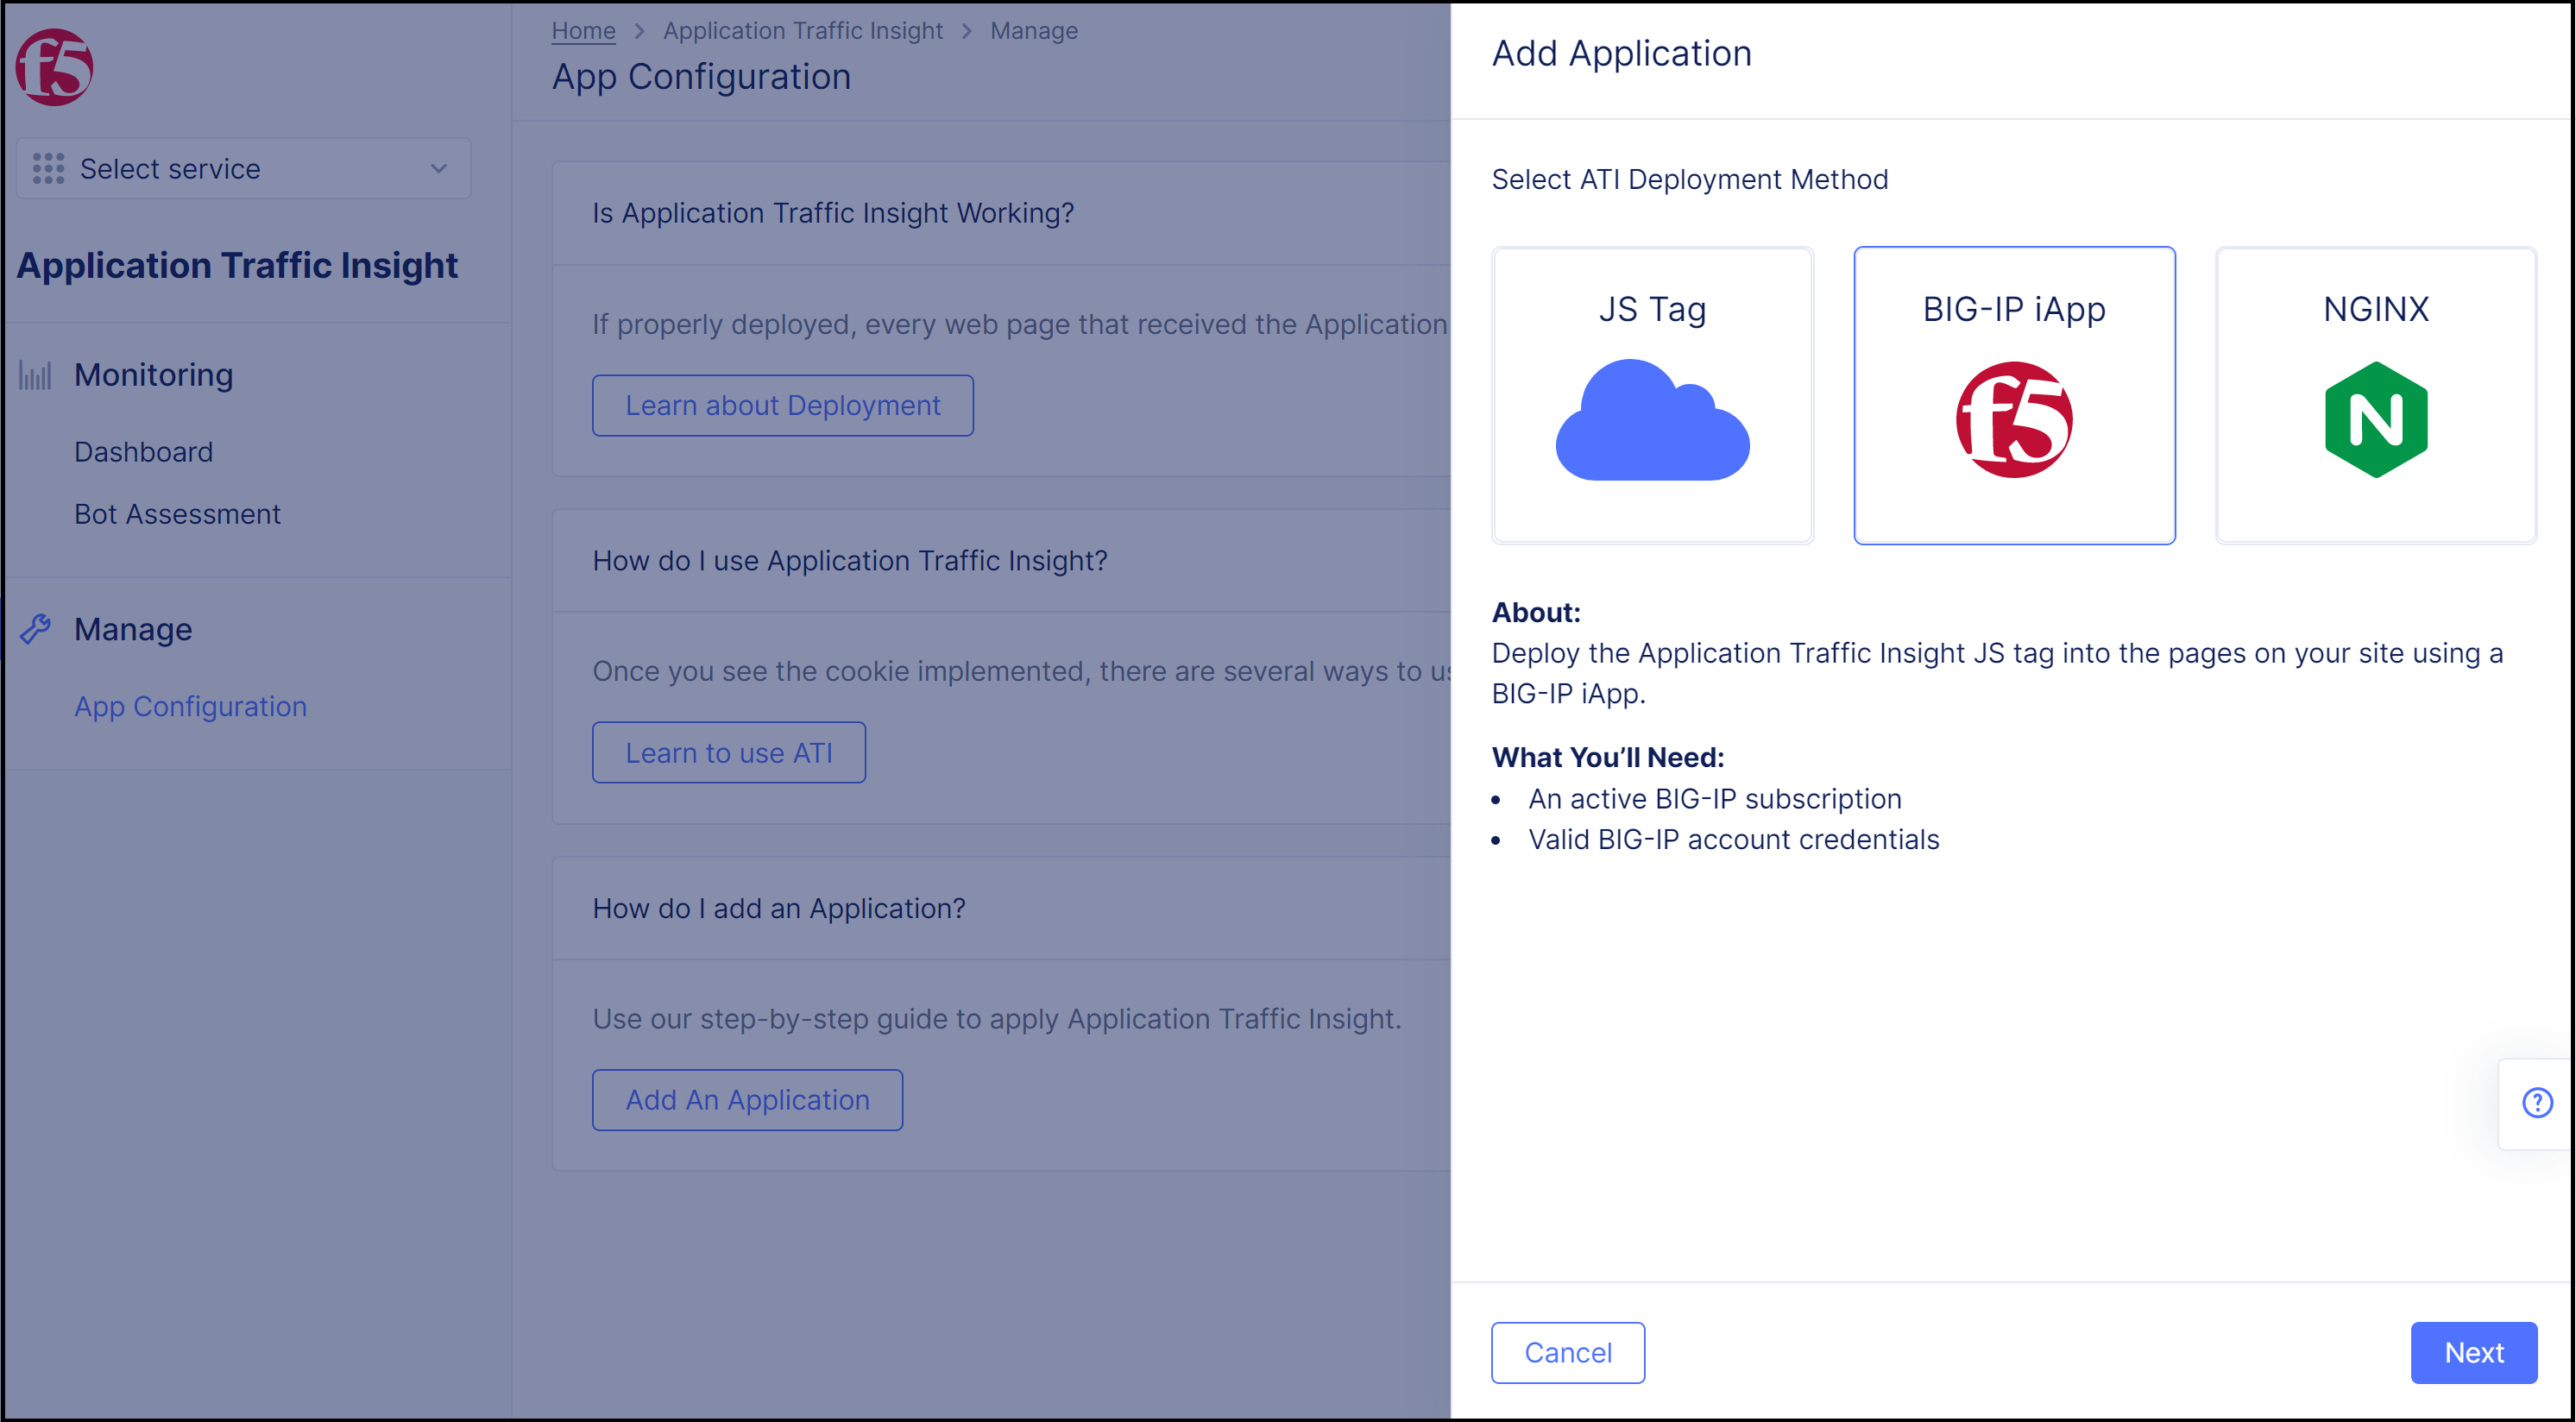
Figure: Select BIG-IP iApp for JS Injection Method
- Click
Next. Instructions for enabling ATI with BIG-IP iApp appear in the pane.
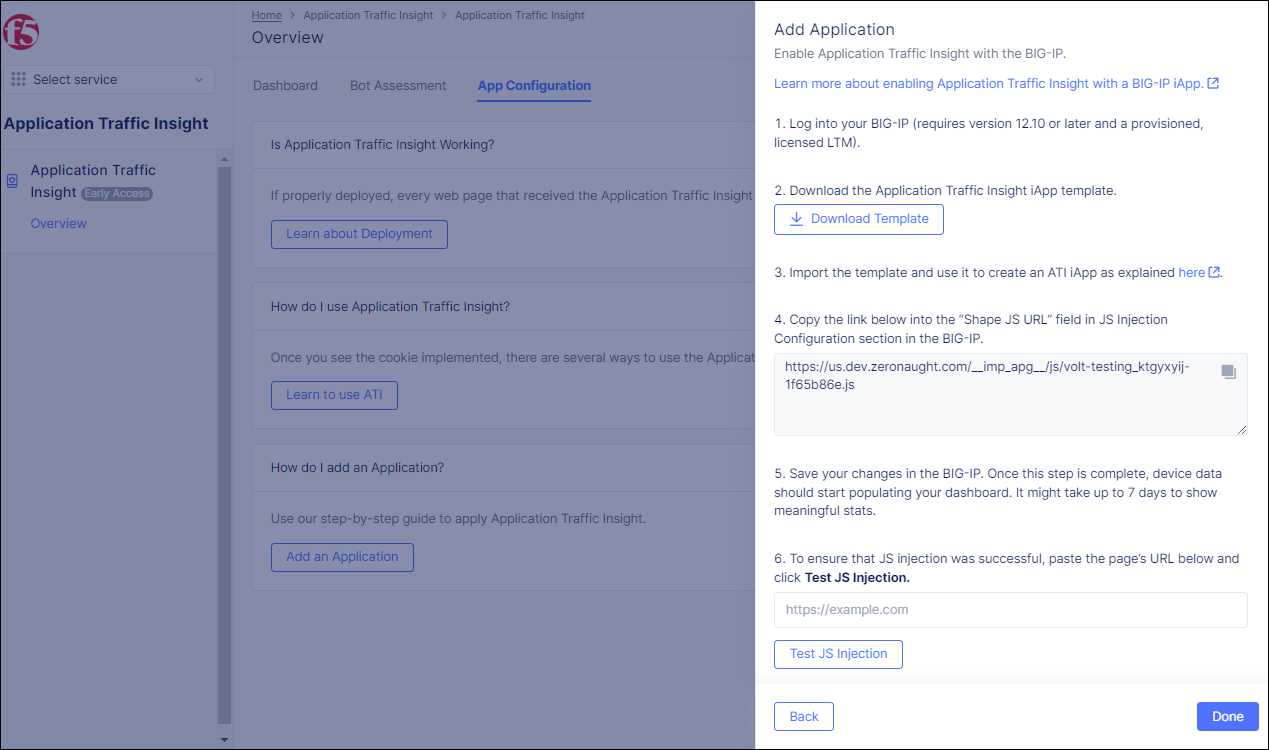
Figure: BIG-IP iApp Method
- Click
Download Templatein Step 2 of the displayed instructions. Download the.zipfile containing the ATI iApp template and extract the contents of the.zipfile.
Step 3: Add the iApp template to the BIG-IP.
- Log into your BIG-IP account.
- In the
Maintab in the BIG-IP, go toiApps>Templates>Templates.
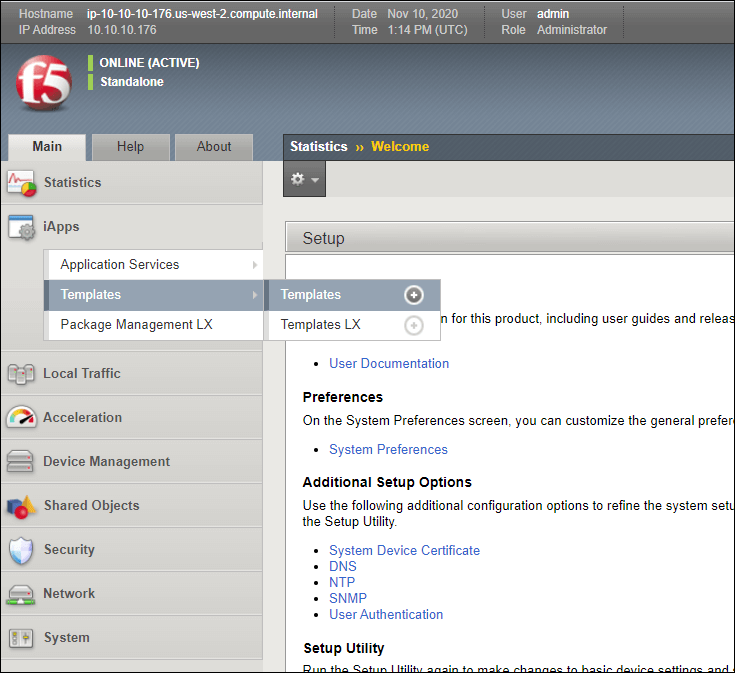
Figure: BIG-IP iApp Templates
- Click
Import. The Template Properties screen appears. - In the
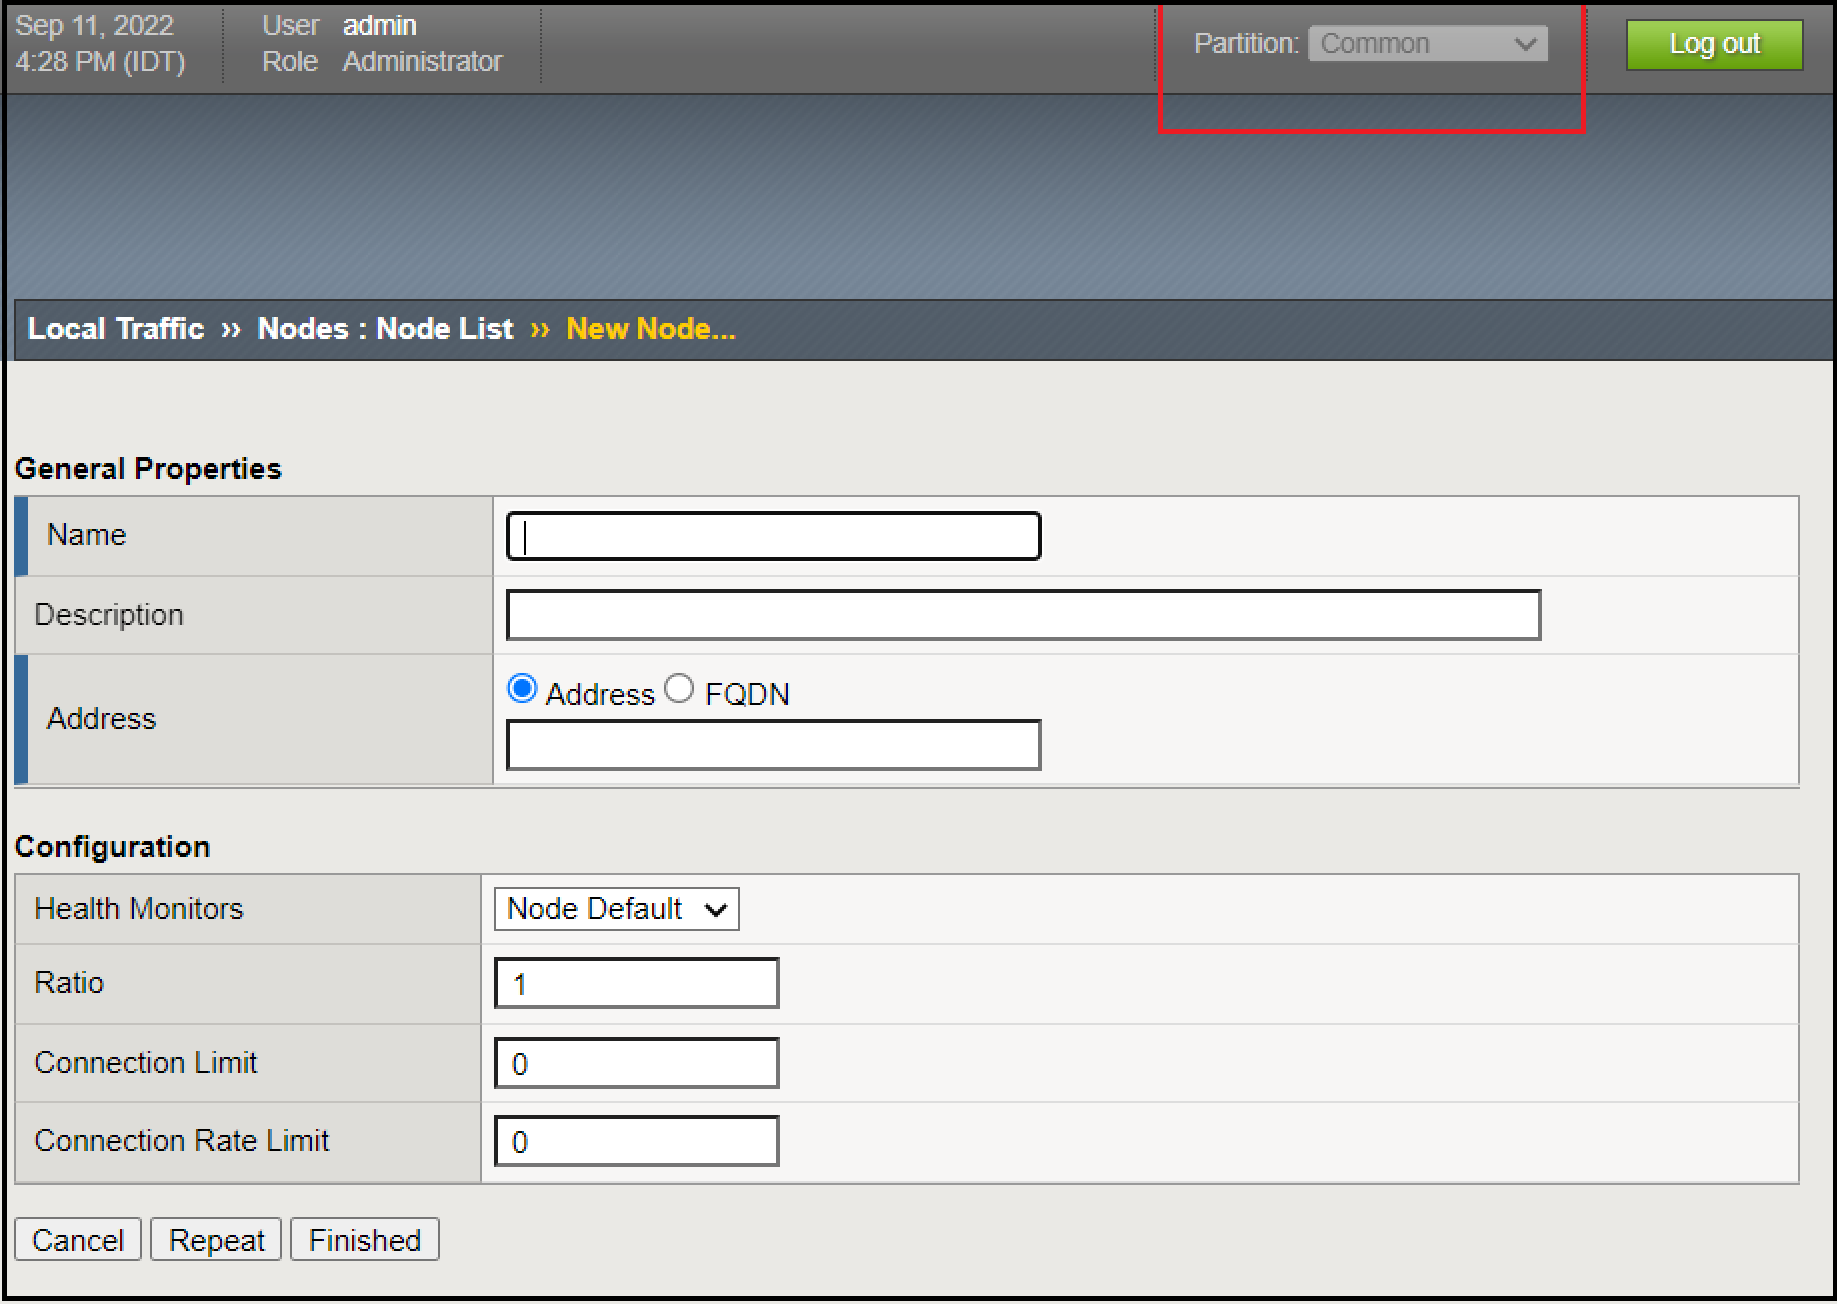
Template Propertiesscreen, clickChoose File, select the ATI iApp template that you downloaded, and then clickUpload. You should now see the template you selected in the Template List. - If you are deploying more than one iApp, you must also perform the following steps to create a FQDN node:
- In the Main tab, go to
Local Traffic>Nodes>Node List. - Click
Create. The New Node Screen appears. - In the upper right of the New Node screen, verify that you are in the Common partition (see in red below).

Figure: New Node Screen
- At Name, enter the host server domain. This domain is taken from the JS URL you receive in the F5 Distributed Cloud Console on port 443. For example, if you received the JS URL
https://us.gimp.zeronaught.com/__imp_apg__/js/volt-volterra_abcdefg-12345678.js, enter the domain us.gimp.zeronaught.com. - At Address, select
FQDNand then enter the same domain that you entered for Name. - In the FQDN section, at Auto Populate, select
Enabled. - Click
Finished.
- In the Main tab, go to
Step 4: Creat the iApp in the BIG-IP.
- In the
Maintab in the BIG-IP, go toiApps>Application Services>Applicationsand clickCreate.
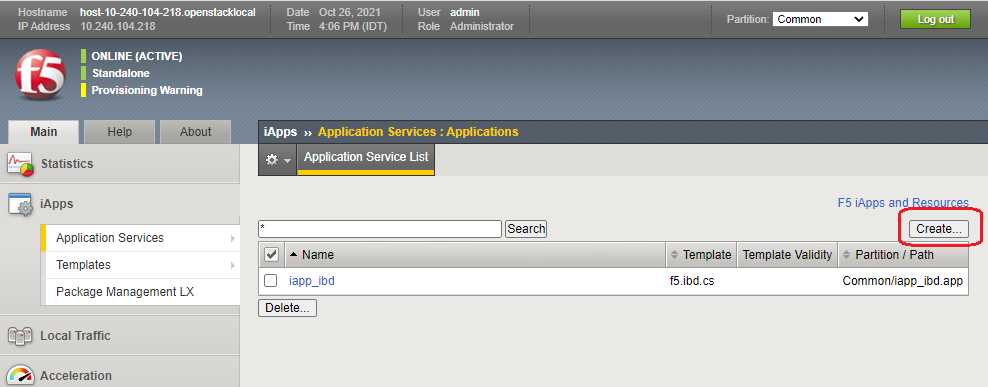
Figure: Create BIG-IP iApp
A new application service screen appears.
- Assign a name to the iApp.
- From the Template list, select the imported ATI iApp template. The ATI iApp template configuration settings appear.
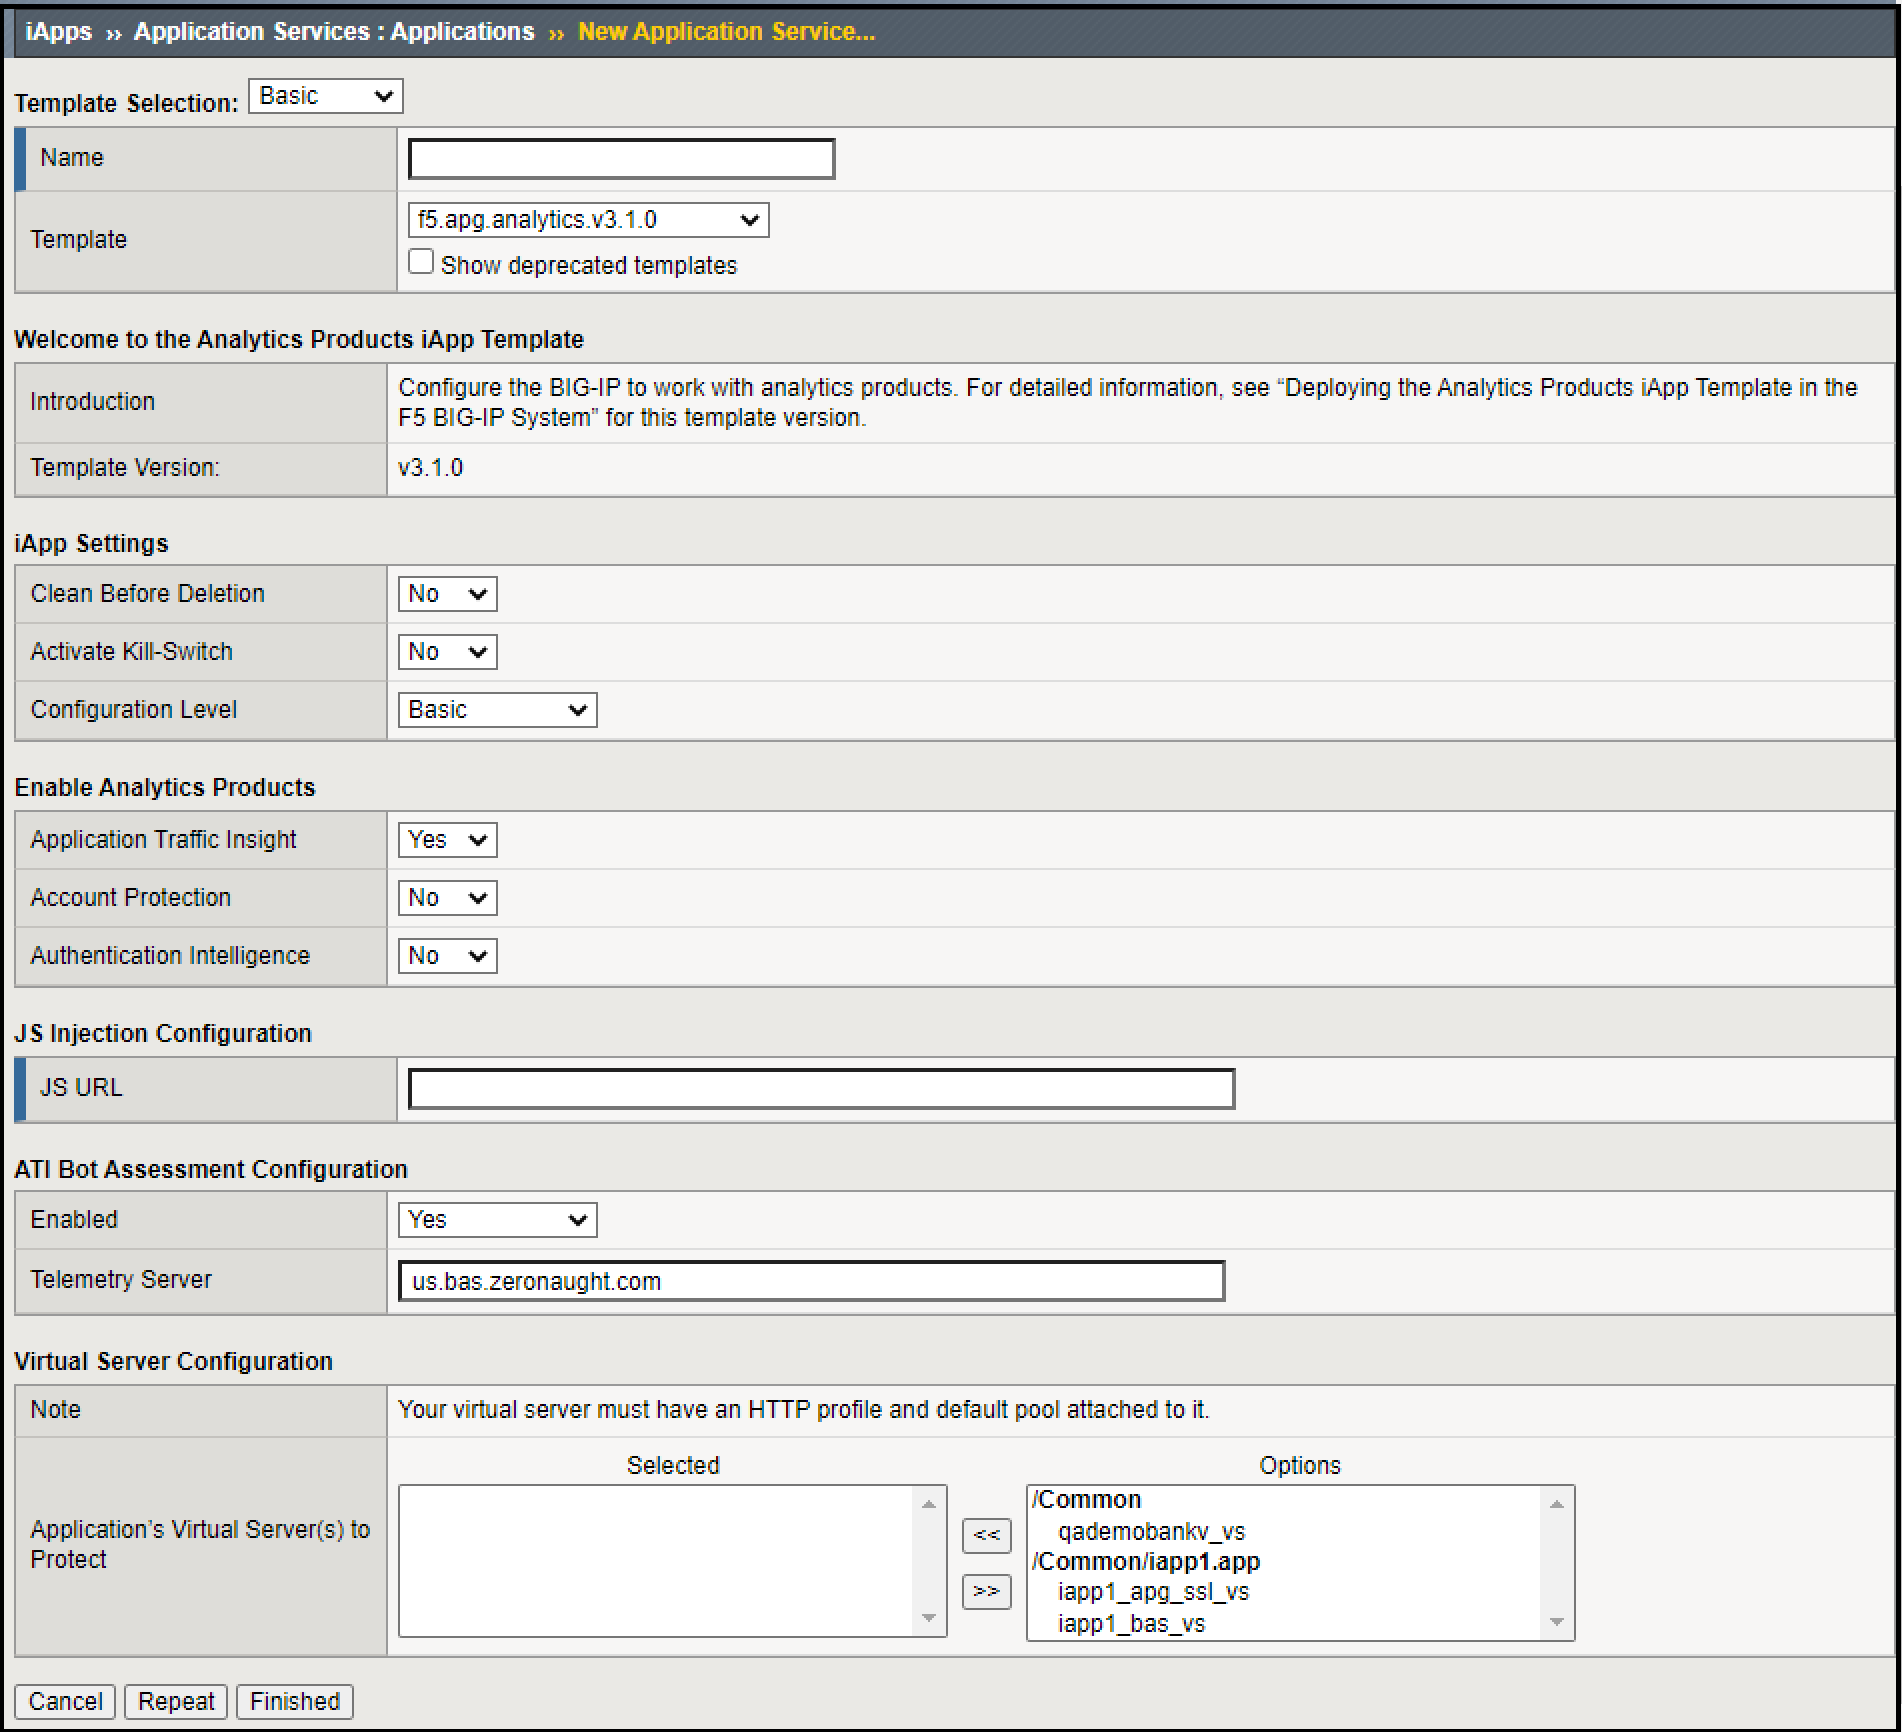
Figure: BIG-IP iApp Configuration
- In Distributed Cloud Console, at step 4 in the instructions, copy the link.
- In the BIG-IP portal, paste the link at
JS URL. - If you do not want the ATI server in the cloud to receive data traffic collected by the BIG-IP, set Enabled=No in the ATI Bot Assessment Configuration section.
Note: When this setting is set to Yes, an iRule collects data traffic detected by the BIG-IP and sends that traffic to the ATI server in the cloud. The ATI server analyzes that traffic to find bots. Some of the bots detected in the BIG-IP traffic cannot be detected by the ATI JS and therefore F5 recommends enabling this setting unless there is a strong customer need to disable it.
- At Application’s Virtual Server(s) to Protect, select your web application’s virtual server(s).
Note: The following apply:
- Selecting at least one virtual server is mandatory. Your iApp will not run if it is not assigned to at least one virtual server.
- The virtual server(s) you select here must have an HTTP profile attached to it. If you select a virtual server that does not have an HTTP profile attached to it, you will not be able to complete iApp configuration.
- Every virtual server you select here must have a default pool attached to it.
- The iApp must be deployed on the same partition as the virtual server(s) you select here.
- Click
Finished.
Step 5: Complete enabling ATI in Distributed Cloud Console.
Go back to Distributed Cloud Console and click Done in the BIG-IP iApp method pane.
For more information on BIG-IP iApp deployment and configuration options, see Deploy Analytic Products iApp Template in BIG-IP, v3.1.1.
Deploy ATI with NGINX
Do the following to deploy ATI with NGINX:
Step 1: Add an application in Distributed Cloud Console.
- In the navigation menu on the left, go to
Manage->App Configuration.
Figure: Select App Configuration
- Click
Add an Application.
Step 2: Select NGINX for the ATI deployment method.
- In the
Add Applicationpane, selectNGINXfor the deployment method.
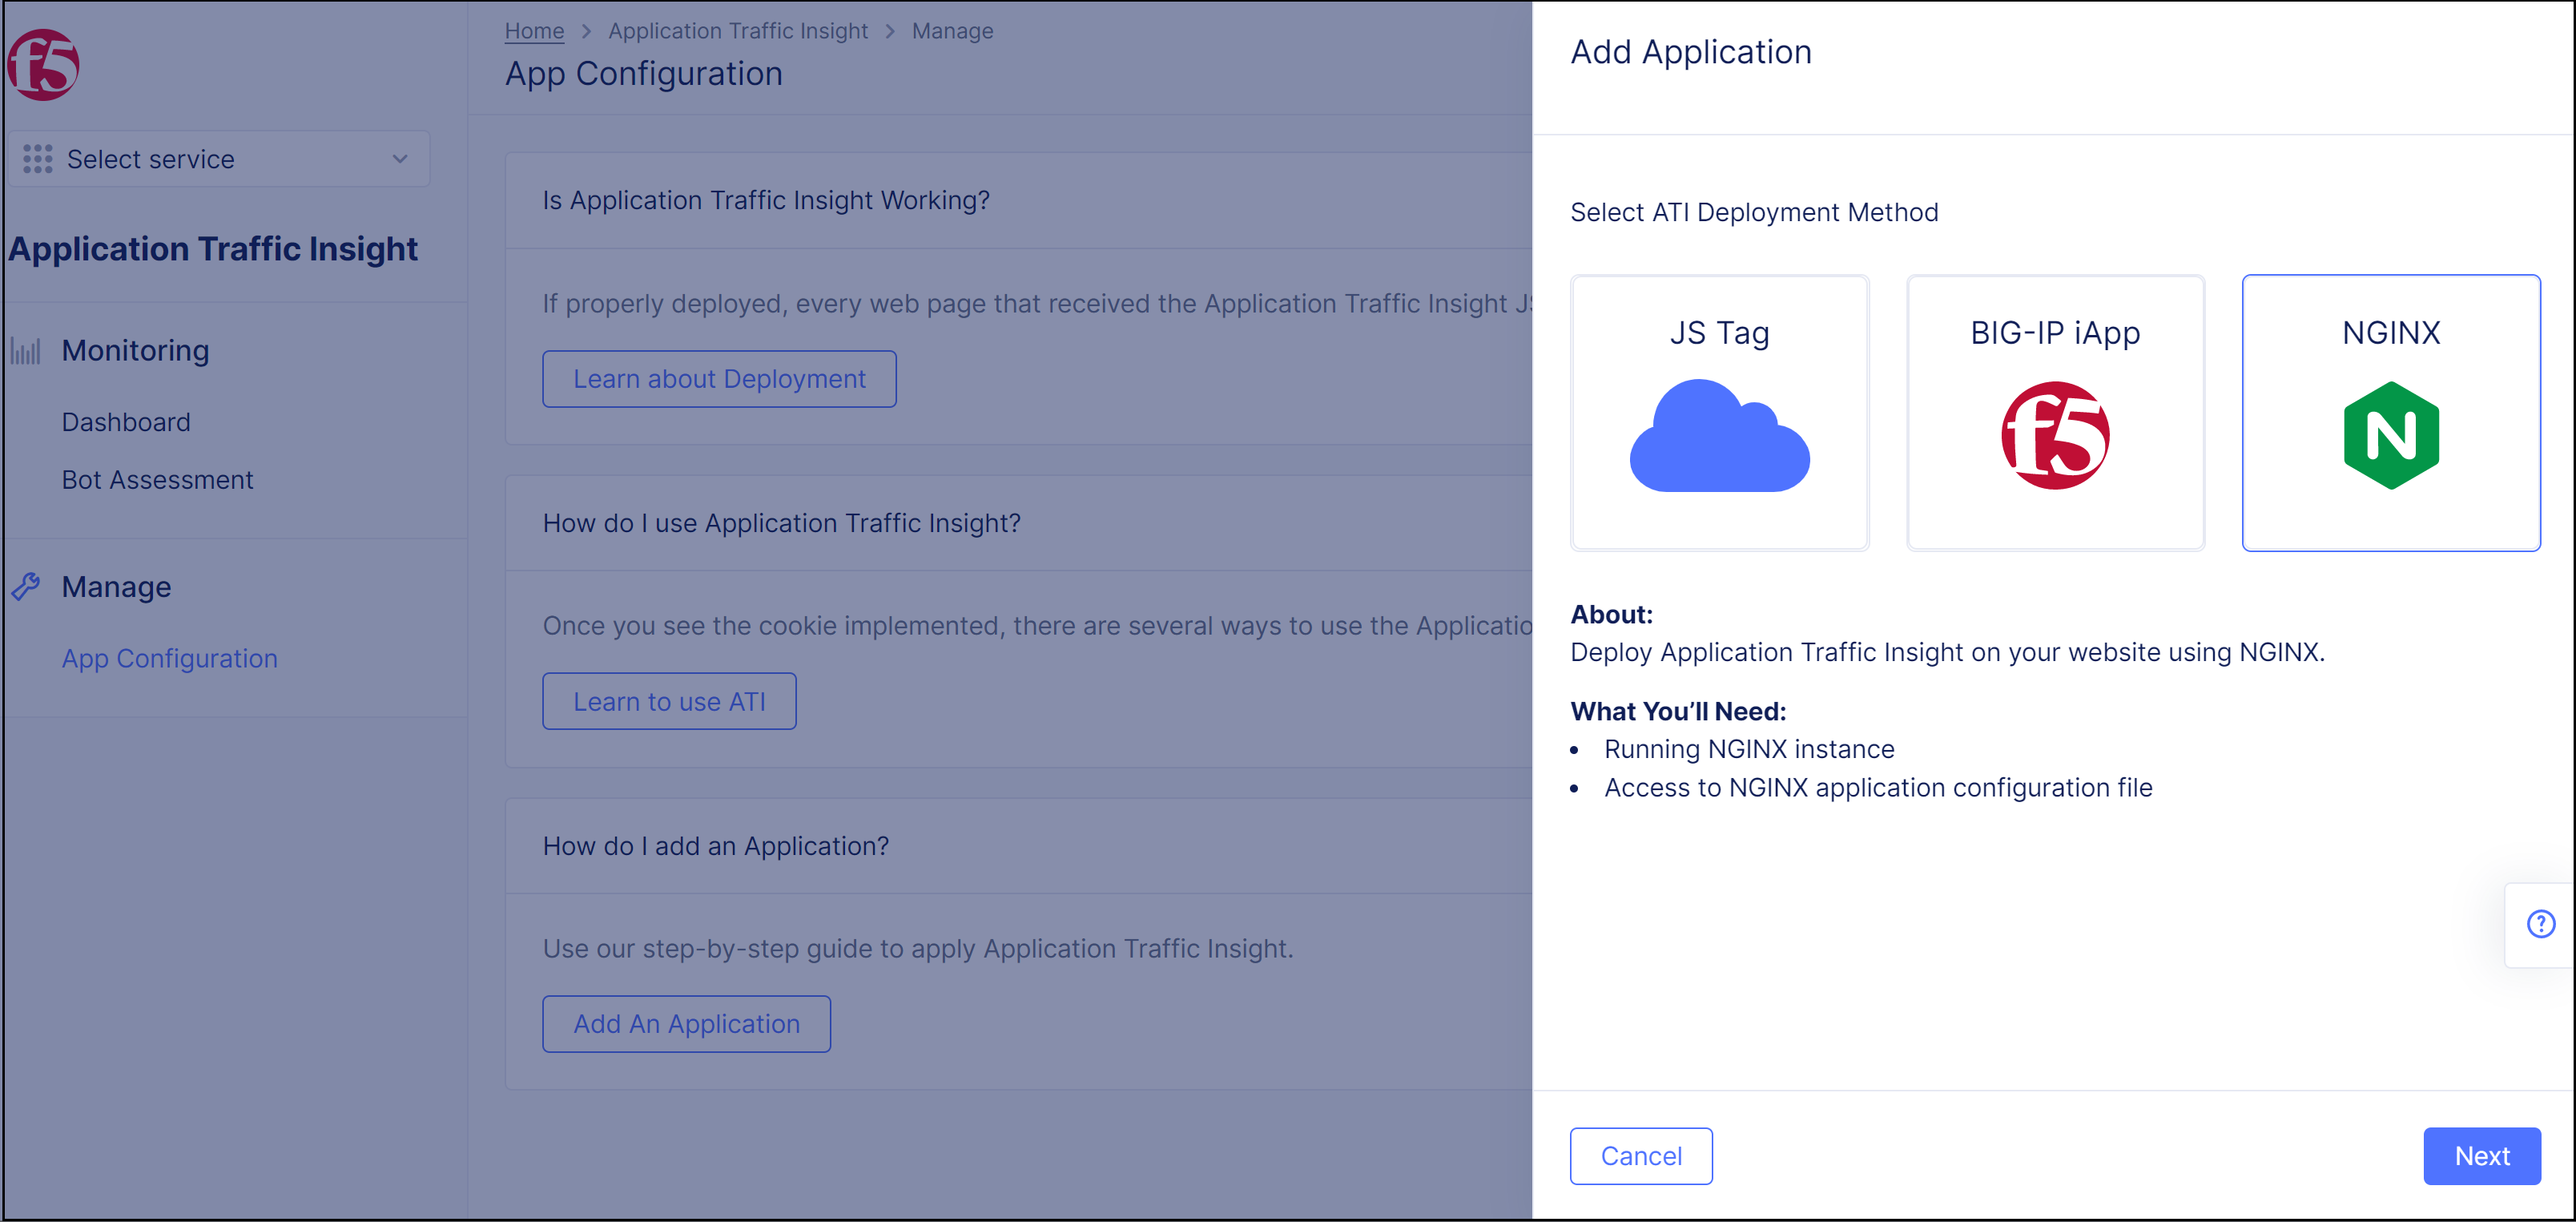
Figure: Select NGINX for ATI Deployment Method
- Click
Next. Instructions for enabling ATI with NGINX appear in the pane.
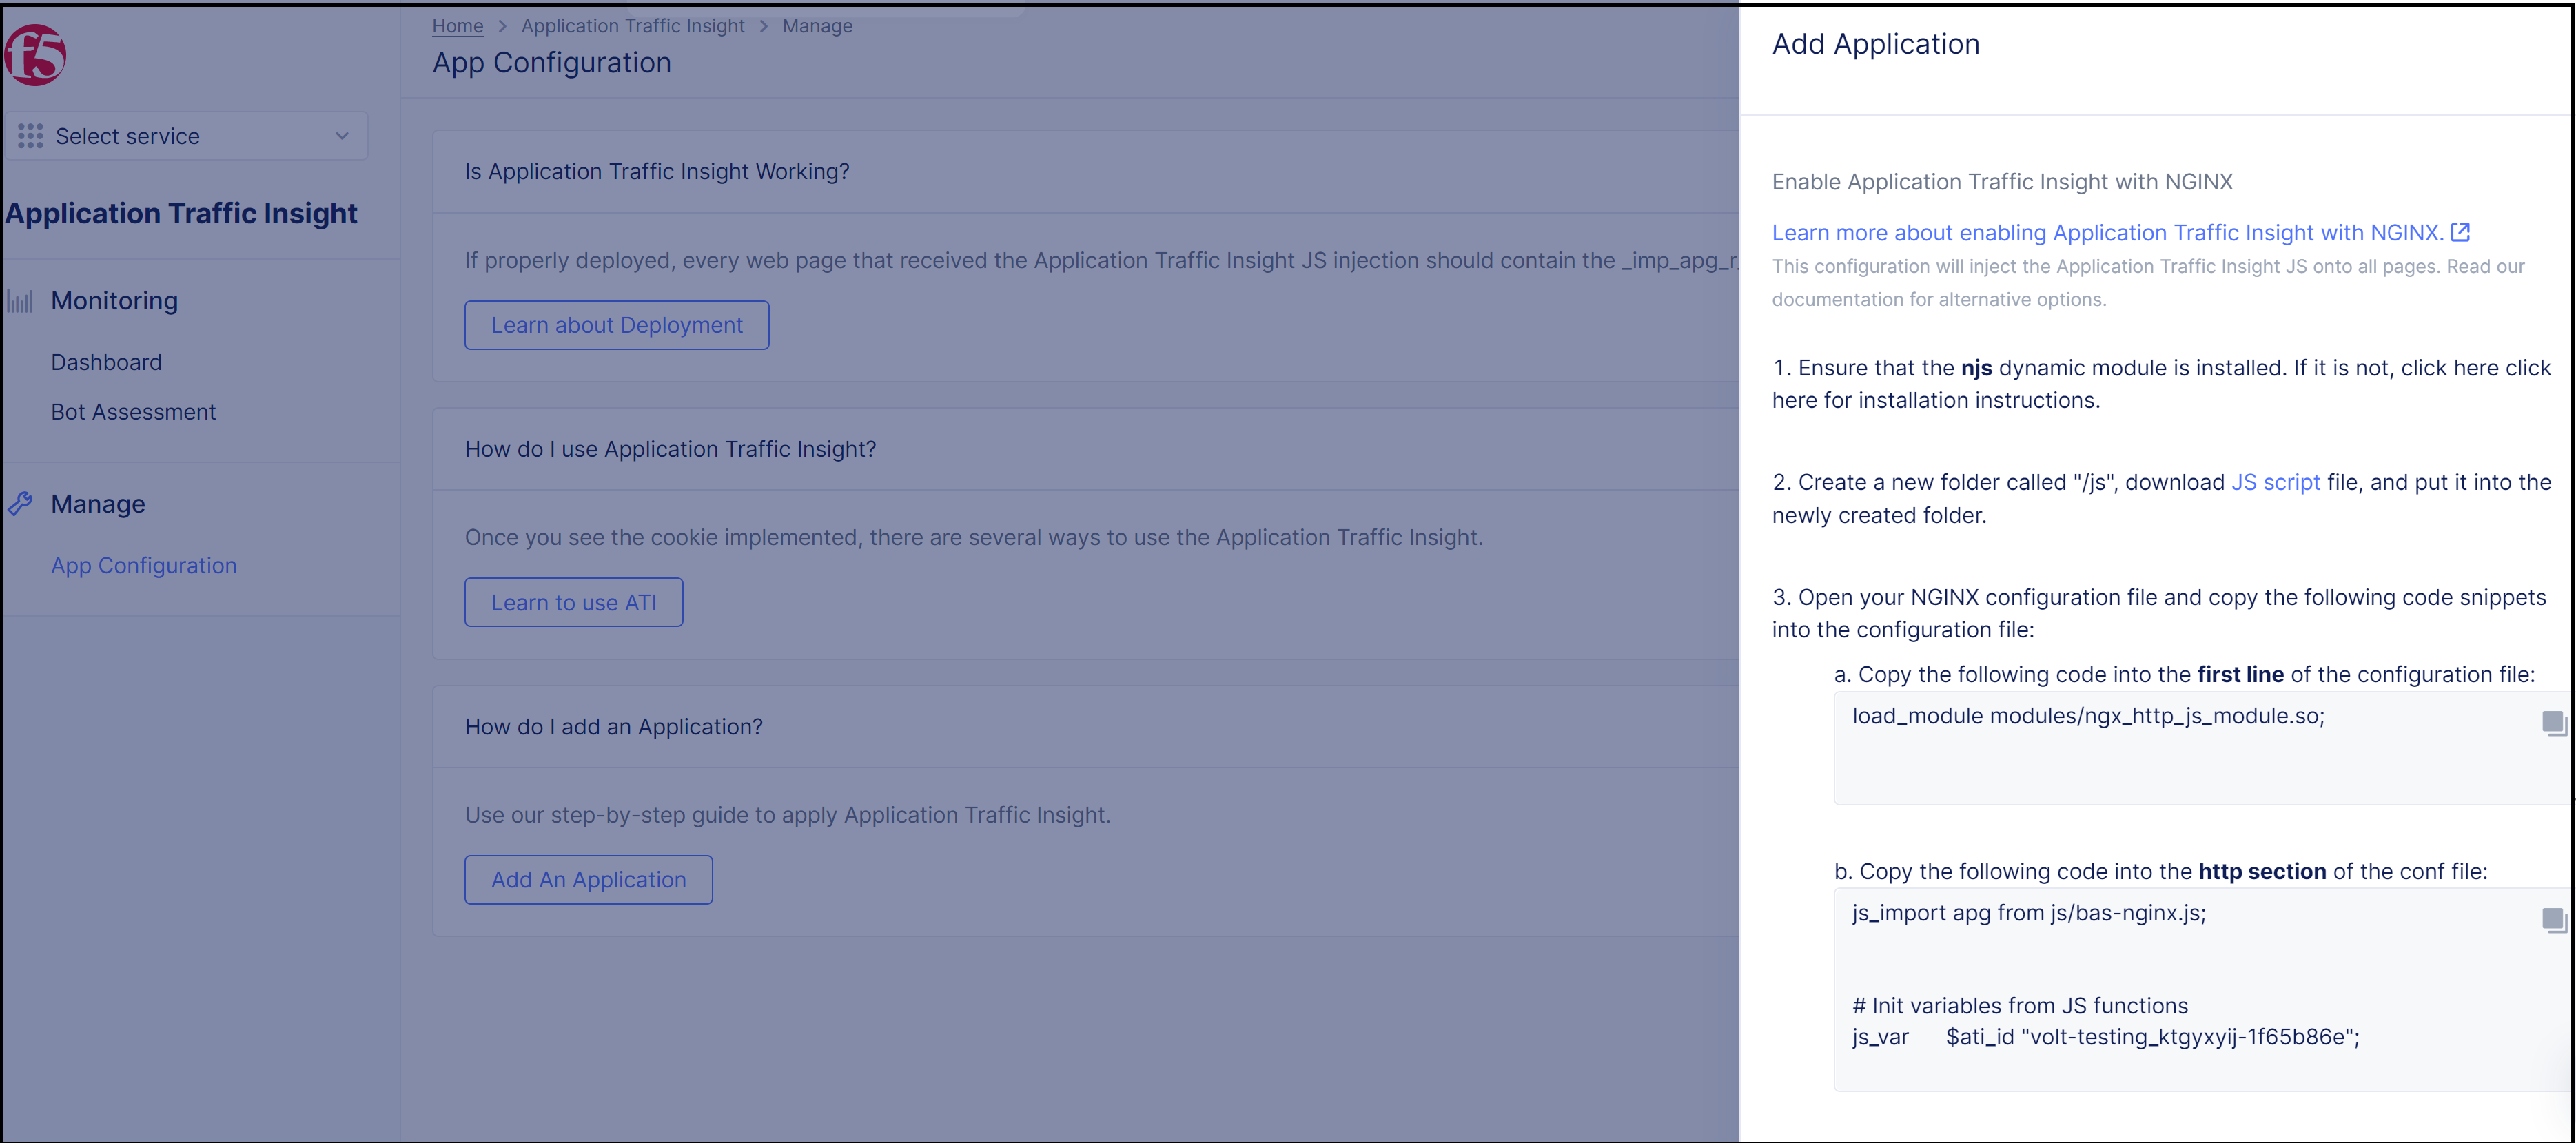
Figure: NGINX Deployment Instructions
Step 3: Deploy the ATI server-side collecting JS for bot detection and assessment.
-
Ensure that the njs dynamic module is installed. If it is not, click here for installation instructions.
-
Download the server-side JS file at step 2 in the NGINX deployment instructions in the Distributed Cloud Console.
-
In the NGINX installation directory, create a new directory called /js and copy the server-side JS to <nginx installation dir>/js/.
-
Open the NGINX configuration file (the default name for this file is nginx.conf).
-
Copy the following line of code to the first line of the configuration file:
load_module modules/ngx_http_js_module.so;- Copy the code block at Step 3b in the instructions in the Distributed Cloud Console to the http section of the configuration file.
For example:
js_import apg from js/bas-ngnix.js;
# Init variables from JS functionsjs_var $ati_id "volt-testing_ktgyxyij-1f65b86e";- Invoke the ati_tel function by adding js_header_filter apg.ati_tel; to your configuration file according to one of the following methods:
To run server-side collecting JS on all endpoints of your application, invoke apg.ati_tel in the server directive.
To run server-side collecting JS in specific web pages only:If the application path is already defined as a location directive, invoke apg.ati_tel in the relevant location.
If the location directive is not defined in your configuration file, use the following code in your server directive:
# run server-side collecting sript for bot assessment for a specific URL patternlocation /<path_pattern> {js_header_filter apg.ati_tel;}Repeat this step for each required path pattern.
For example, for sending telemetry for any url ending with .php suffix, create a location and add the js function call:
# run server-side collecting sript for bot assessment for a specific URL patternlocation ~ \.php$ {js_header_filter apg.ati_tel;}- Copy the code block at Step 3d in the instructions in the Distributed Cloud Console to the server section in the configuration file to create a new location directive for sending required information to ATI.
For example,
location = /ati_tel {proxy_pass https://bas.dev.zeronaught.com;proxy_ssl_server_name on;}- Save the configuration file and reload NGINX.
Step 4: Deploy the ATI client-side collecting JS to monitor data traffic from client browsers.
- Create a location directive for the ATI JS endpoints under your application server directive by copying the lower section of code at Step 3e in the instructions in the XC Console (in red rectangle below) to your configuration file:
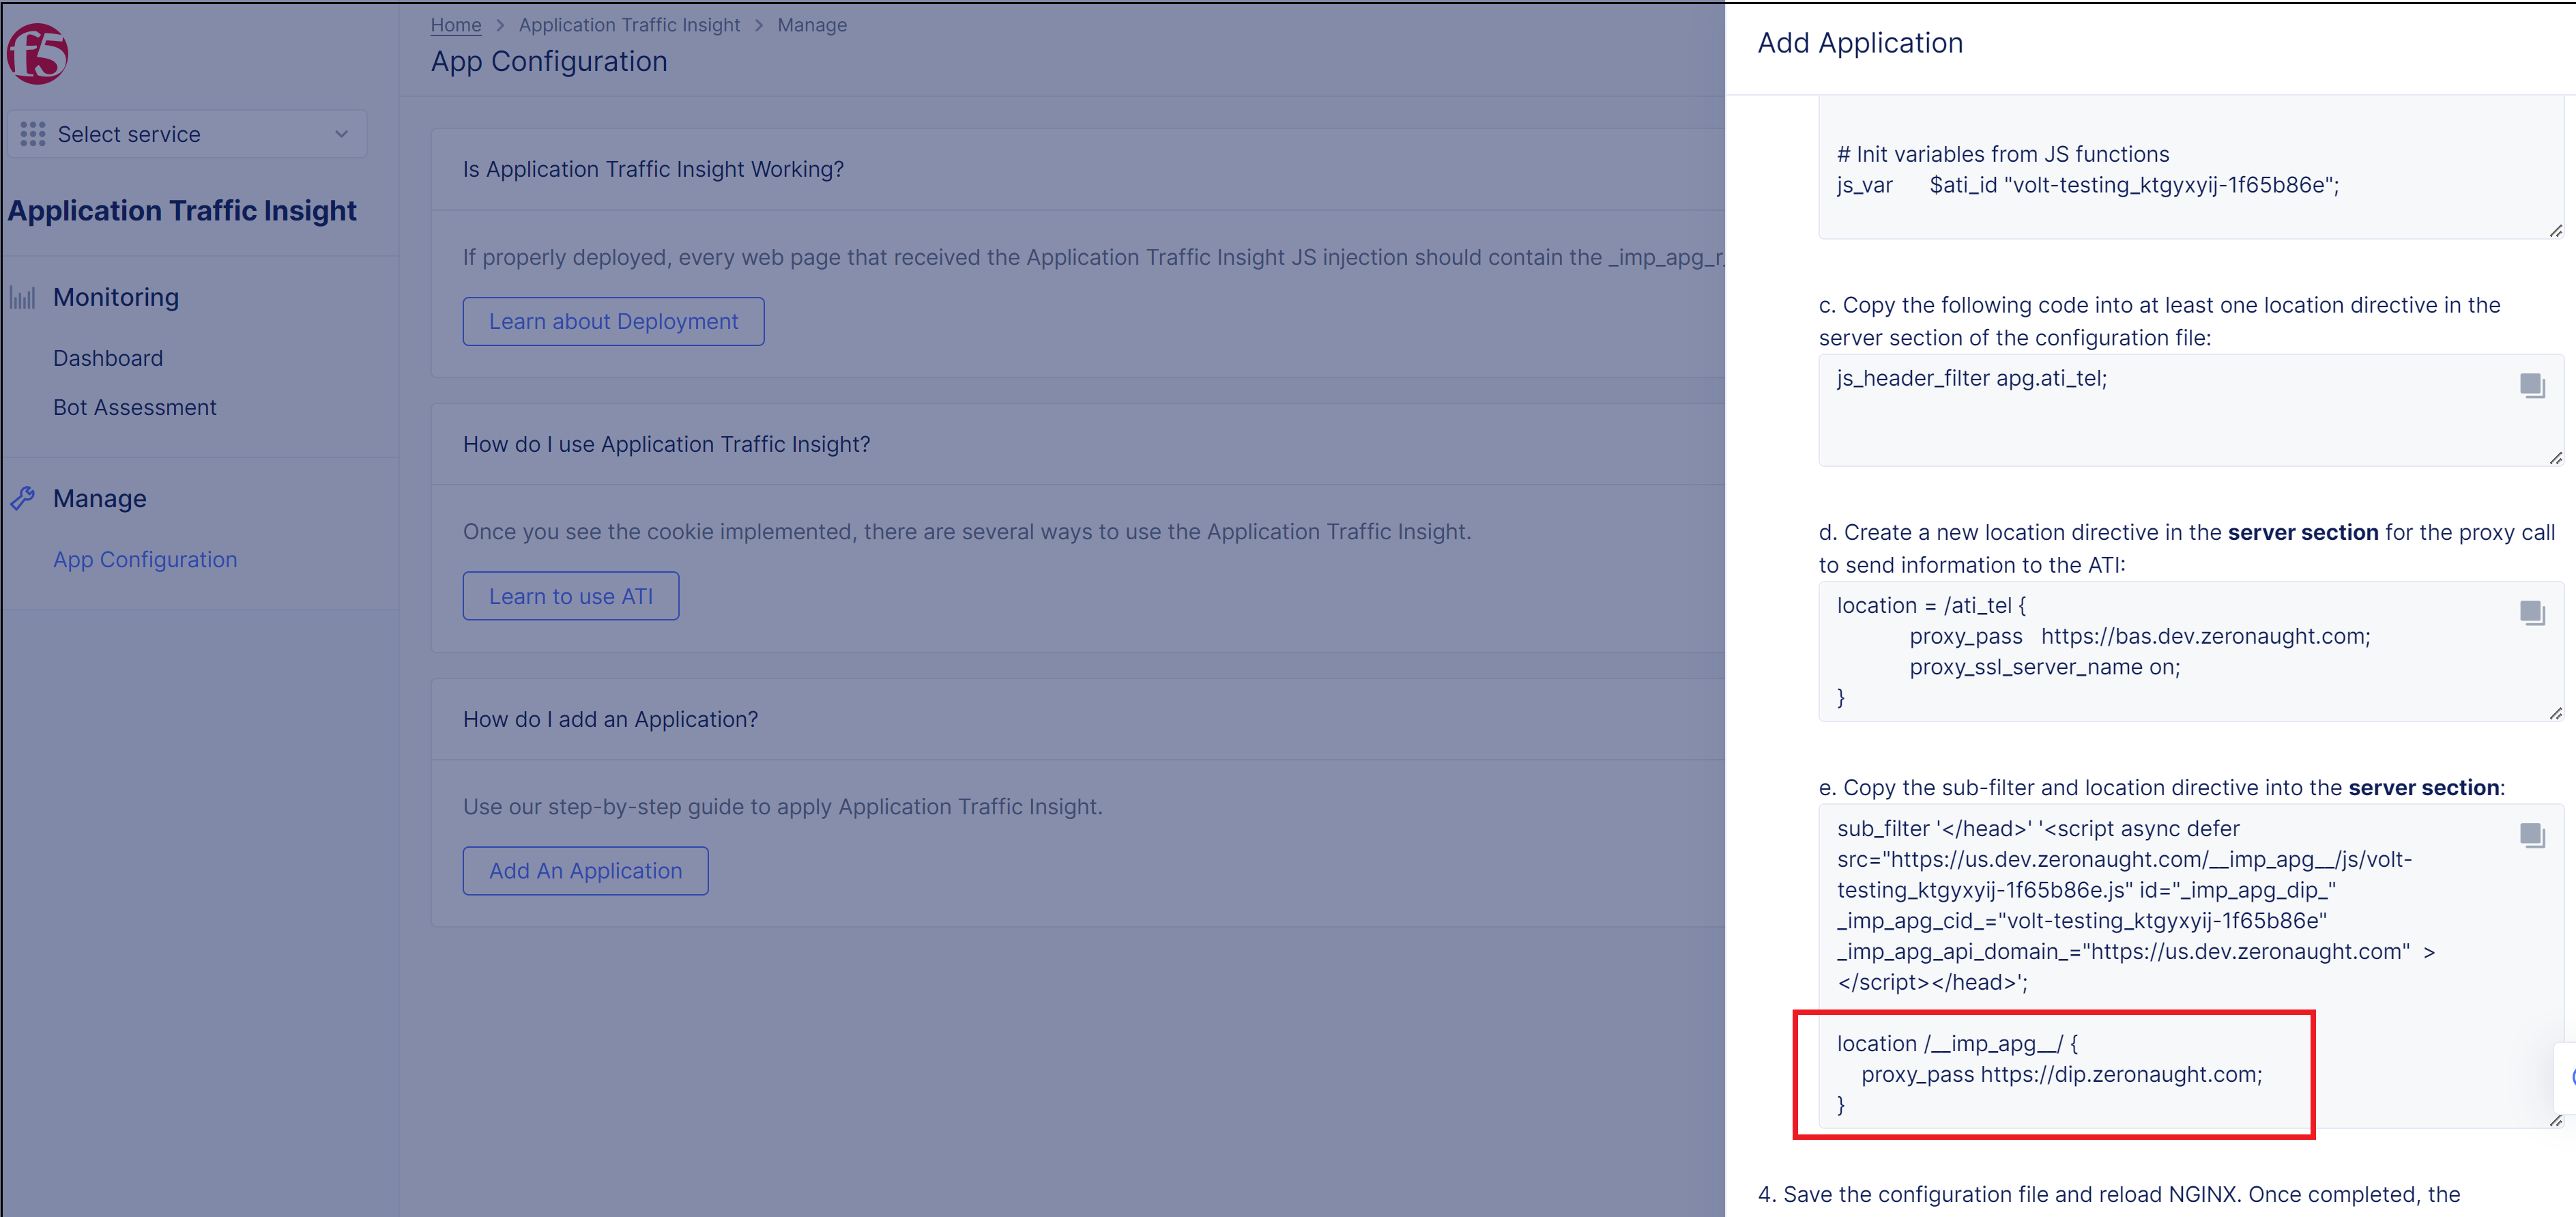
- Copy the script tag in the upper section of code at Step 3e in the instructions in the XC Console (in red rectangle below).
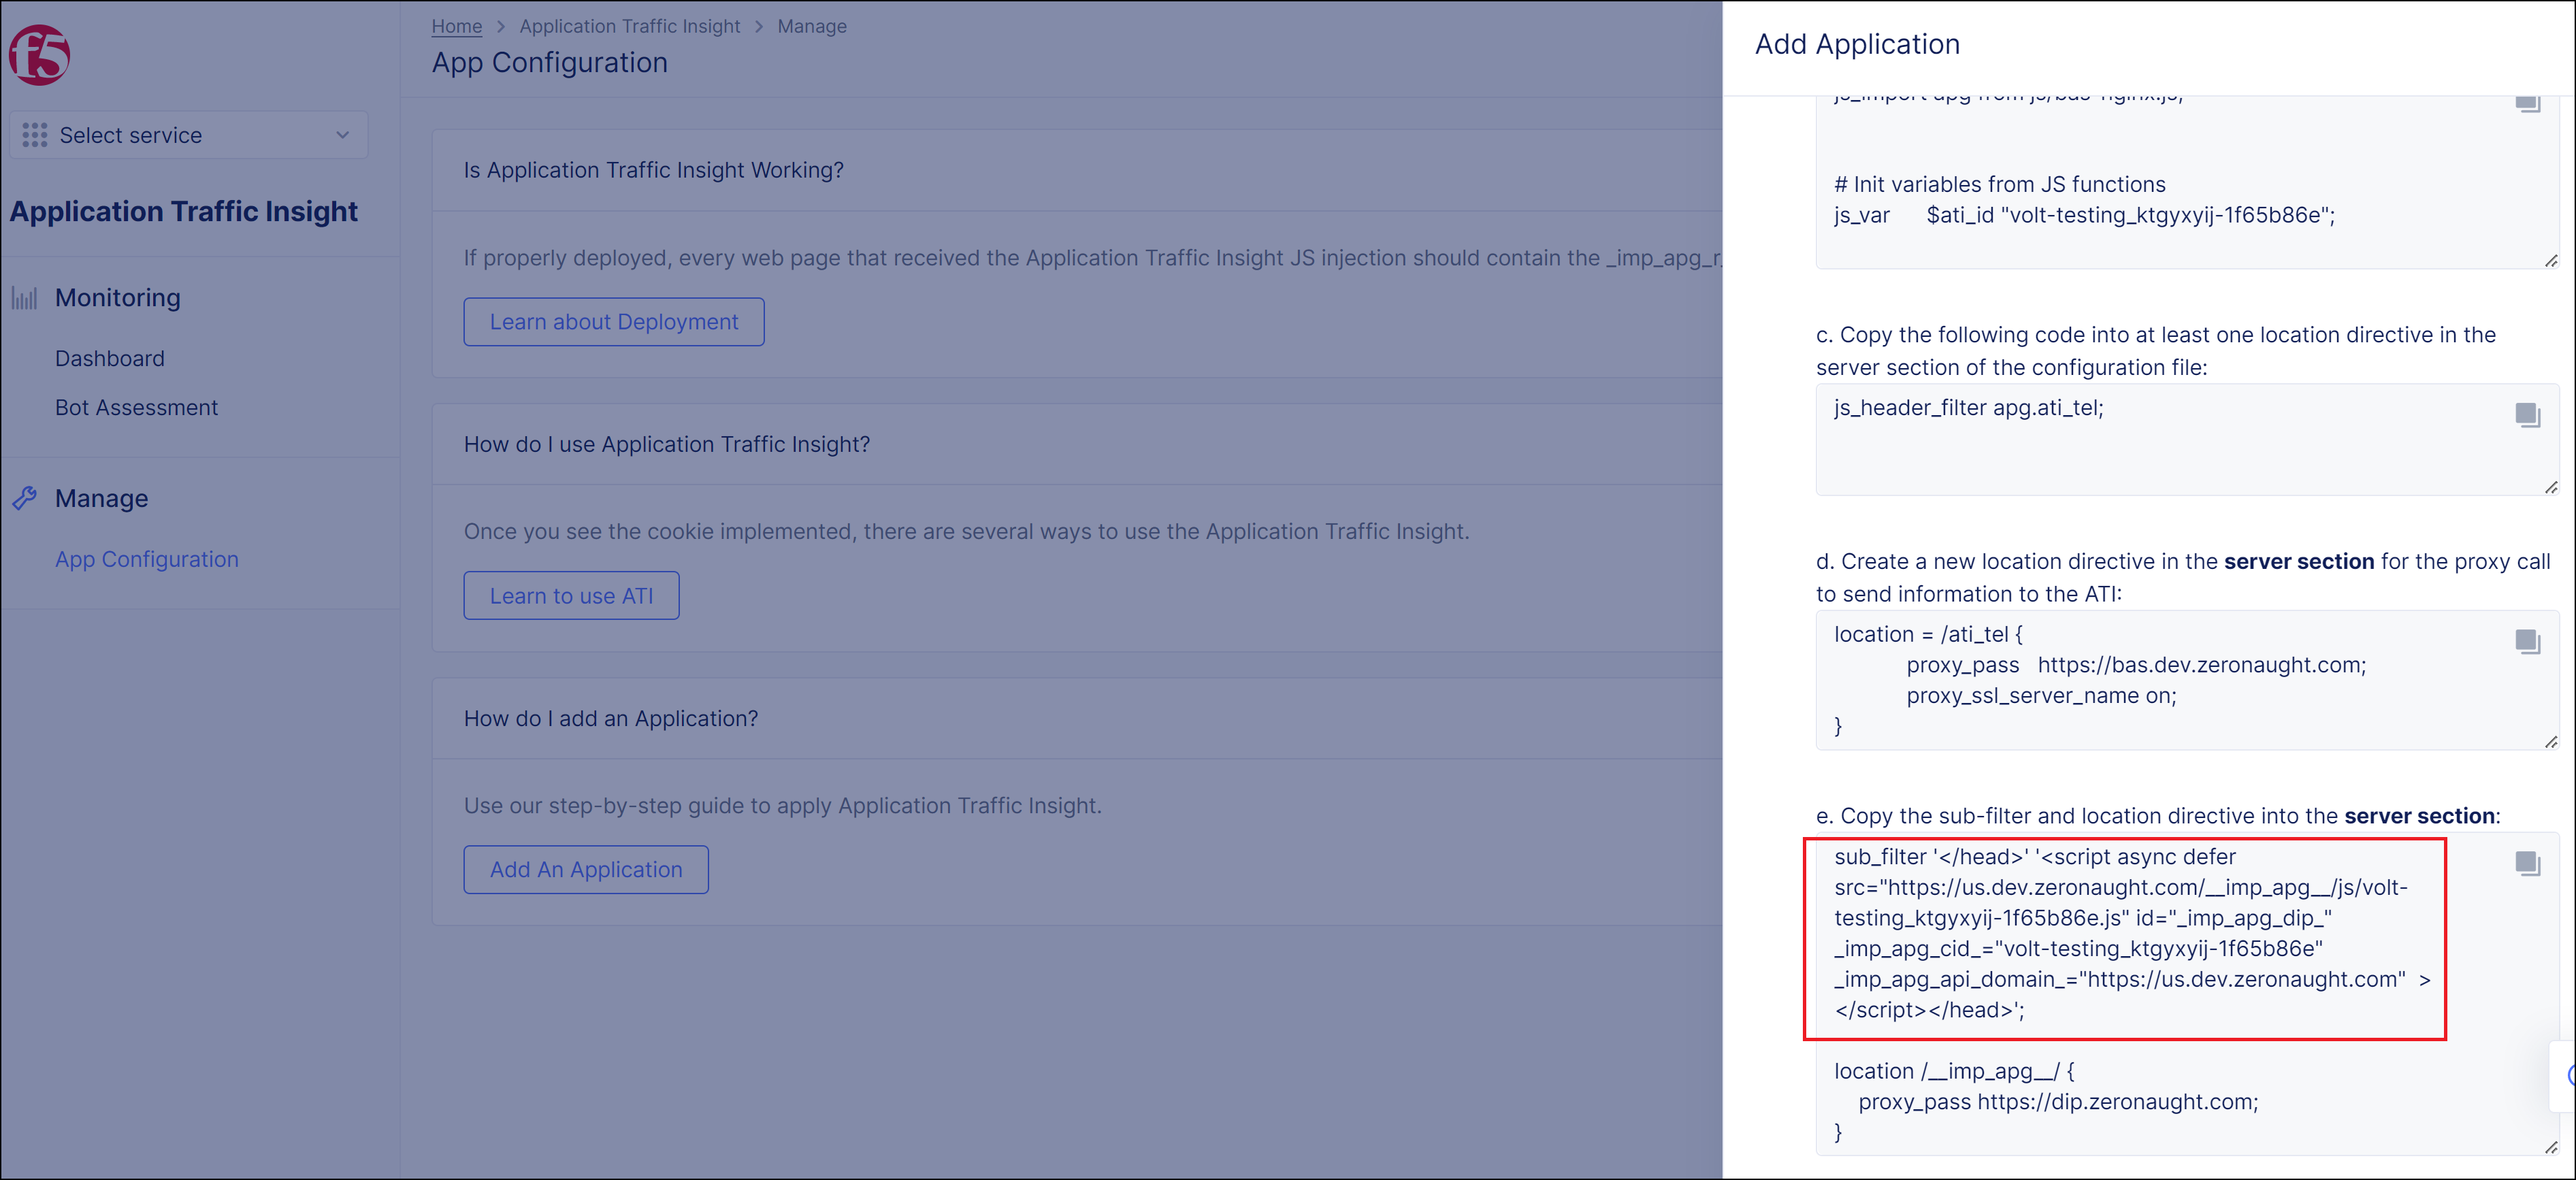
- Inject the script tag into the web pages of your application according to one of the following options:
To inject the ATI JS in all web pages in your application: Put the script tag under your application server directive.
To inject the ATI JS in specific web pages only: If the application path is already defined as a location directive, copy the script tag to the relevant location.
If the location directive is not defined in your configuration file, copy the script tag to your server directive. For example, like this:
# Inject ATI JavaScript to specific pathlocation /<specific_path> {sub_filter '</head>' '<script async defer src=https://us.dev.zeronaught.com/__imp_apg__/js/volt-testing_ktgyxyij-1f65b86e.js id="_imp_apg_dip_" _imp_apg_cid_="volt-testing_ktgyxyij-1f65b86e" _imp_apg_api_domain_=https://us.dev.zeronaught.com ></script></head>';}Repeat this step for each required injection path.
Note: NGINX injects the ATI JS for the HTML MIME type only. If you want to inject the XHTML MIME type, you should use the following command:
`subs_filter_types text/html application/xhtml;`- Save the configuration file and reload NGINX.
Step 5: Complete enabling ATI in Distributed Cloud Console.
Go back to the Distributed Cloud Console and click Done in the NGINX deployment instructions.
Note: The ATI Dashboard in the XC Console should be populated with data about an hour after completing the deployment with NGINX.
Step 6: Test if deployment was successful.
To test if deployment was successful on the NGINX server:
- Enable error logging, as described here: error logging
Note: Ensure that the log level of error messages is set to at least info.
-
Make a request to one of your endpoints.
-
Check the logs under /logs/error.log in NGINX to verify that request information was sent successfully.
To test client-side deployment, see Verify ATI Deployment.
Advanced Configuration Options for the ATI iApp
After you have deployed ATI on your web application using the BIG-IP iApp, you may want to fine tune the iApp configuration to better suit your system needs. These instructions present some advanced configuration options for the ATI iApp template in the BIG-IP.
To configure the ATI iApp template in the BIG-IP:
- In the
Maintab in the BIG-IP, go toiApps>Application Services>Applicationsand select your iApp from the list. - Click the
Reconfiguretab (see below).
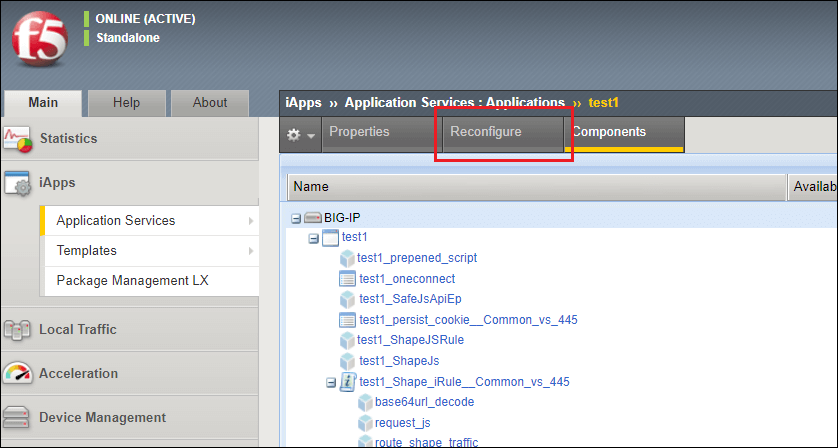
Figure: BIG-IP iApp Reconfigure
The ATI iApp template configuration settings appear.
-
At Configuration Level under iApp Settings, select
Advanced. -
In the JS Injection Configuration section:
-
Location for JS Injection: From the drop-down list, select a location in the HTML code of your webpage for the JS injection.
-
Script Attribute: Choose an attribute that is added at the end of the injected JS, either Async Defer, Async, Sync or Defer. This attribute determines how the JavaScript is loaded and executed.
-
Inject JS in Specific Webpages Only: Select Yes to inject the JS in specific web pages of your web application. Select No to inject the JS in all web pages of your web application.
Note: If a webpage is selected to both receive the JS injection and to be excluded from the JS injection, the exclude will override the include and the webpage will not receive the JS injection.
-
JS Injection Paths: If Inject JS in Specific Webpages Only = Yes, enter here the relative paths of the webpages in your application to receive the JS injections. For example, /Login.php, /Main.php, /Home.htm, /ContactUs.html.
Wildcard path names can be used here. For example, if you enter here *Log*, the path /Login.php will receive the JS injection.
Also, there is no case-sensitivity with the path name you enter. For example, you can enter the path /LOGIN.php or /login.php and if the actual path in your application is /Login.php, /Login.php will receive the JS injection.
-
Exclude JS Injection from Specific Webpages: Select Yes to exclude the JS injection from specific web pages in your web application.
-
JS Excluded Paths: If Exclude JS Injection from Specific Webpages = Yes, enter here the relative paths of the web pages in your application that the JS injections should be excluded from. For example: /Products.php, /Home.htm, /ContactUs.html, /Orders.php.
Wildcard path names can be used here. For example, if you enter here *Log*, the path /Login.php will receive the JS injection.
Also, there is no case-sensitivity with the path name you enter. For example, you can enter the path /LOGIN.php or /login.php and if the actual path in your application is /Login.php, /Login.php will receive the JS injection.
-
-
In the ATI Bot Assessment Configuration section, if Bot Assessment Configuration is enabled you can modify the following settings:
-
Telemetry Server: Do not change the default server address unless instructed to do so by F5 Customer Support.
-
Port: If you have not used any previous version of the Analytics Products iApp template on your system, do not change the default port number unless instructed to do so by F5 Customer Support.
Note: Analytics Products iApp template 3.1.0 and later versions work according to the HTTP protocol. If you used a template version prior to 3.1.0 that worked according to the TCP protocol and want to continue using the TCP protocol, enter here the number 8085.
- Encrypting Virtual Server: This is the address of the internal virtual server used for encrypting the Bot Assessment data. If the default address is in use somewhere else, enter a new address that is not in use.
-
-
In the Pool Configuration section:
- Cookie Persistence for the Service Pool: Select Enable if, after initial load balancing, you want HTTP requests of the same session always sent to the same pool member in the Service Pool. Select Disable if you want the BIG-IP to perform standard load balancing.
- Domain: If you entered a relative path in JS URL, enter a domain to receive HTTP requests or use the default value. If you used a full path, the domain of the full path is automatically used.
- Add HTTP Health Check: Choose whether to perform the HTTP Health Check on the entire pool. The HTTP Health Check is performed in intervals of 5 seconds. If you activate the health check, the following related settings are displayed:
- Liveness Path: The path to the site where the health check will be performed on the entire pool.
- Port: The port on which the health check is performed.
- Response Code: Enter the code that will indicate a successful health check result in the response from the site that was checked.
-
In the Advanced Features section:
-
Add Connecting IP to Headers: Select Yes to add the connecting IP to the XFF header and to add an Analytic Header that includes the connecting IP.
Note: If an HTTP profile attached to one of the web application’s virtual servers has an XFF header added to it and this setting is set to Yes, requests will show duplicate client IPs in the XFF headers. To avoid this situation, either remove the XFF header from the HTTP profile or set this setting to No.
-
Choose a Parent Server-Side SSL Profile for the Service Pool: Select an SSL profile (or use the default) that will be attached to a new virtual server for routing traffic to the Service pool.
Note: Selecting an SSL profile here is mandatory, and only one SSL profile can be selected.
-
Encrypting Virtual Server IP: A default IP is assigned. If you have a virtual server already configured to this IP, assign a different IP here.
-
Use SNI: Select Yes to use Server Name Indication (SNI) for pool members.
-
Enable Debug: Select Yes to enable debug logs.
-
-
Click
Finished.
For more information on BIG-IP iApp deployment and configuration options, see Deploy Analytic Products iApp Template in BIG-IP, v3.1.1.
Verify ATI Deployment
After onboarding your application with ATI, it is a good idea to test that the deployment was successful. To determine whether the deployment was successful, you need to check for two things on the web pages of your application:
- Is the ATI JS called from the web page?
- Does the web page contain the
_imp_apg_rcookie?
If the answer to both questions above is yes, then deployment was successful.
Follow these steps to check that deployment was successful:
- For every web page that received the ATI JS injection, open the page in a web browser.
Note: If you used a tag management system to inject the ATI JS on your web pages, skip the next step and proceed to the final step.
- Check that the page source contains the ATI JS.
Note: For web pages in your application that do not require a user login to access them, there is an alternative way to check if the web page contains the ATI JS during the deployment procedure. Paste the web page URL and click
Test JS Injectionin the Distributed Cloud Console application method pane.
- Check that the page contains the
_imp_apg_rcookie.
View Data in the ATI Dashboard
The ATI Dashboard presents different views into the data collected by ATI. Data is presented through various graphical widgets. These widgets provide you with information about devices are interacting with your applications and show potential indications of suspicious activity.
Time-Period for Data Display
Choose a time-period for displaying data: Last 24 hours, Last 7 days, or Last 30 days.
Unique Devices over Time
This widget displays the number of unique devices that accessed your applications during the selected time-period. This information is useful since an unexpected large number of unique devices accessing your applications in a short period of time can be an indication of malicious activity.
New vs. Returning Devices over Time
This widget displays the number of new devices (first-time accessing your applications) versus the number of returning devices (devices that have accessed your applications at least once in the past) for the selected time-period. This information is useful since an unexpected large number of new devices accessing your applications in a short period of time can be an indication of malicious activity.
Devices by Country
This widget displays the number of devices per country that accessed your applications during the selected time-period. To view the number of devices for a given country, hover over a country with the mouse and the number is displayed.
Devices per Device Age
This widget displays the number of devices according to the device age for all the devices that accessed your applications during the selected time-period. The age of a device is determined by the amount of time that has passed since the device was first identified.
The red, dashed, vertical line indicates the average age of all devices that accessed your applications during the selected time-period.
Devices per Session Length
This widget displays the number of devices according to the session length of the device for all the devices that accessed your applications during the selected time-period. Session length is determined according to how long a device was connected to your application. This information is useful since a large number of devices with a short or long session length can be an indication of malicious activity.
The red, dashed, vertical line indicates the average session length of all devices that accessed your applications during the selected time-period.
ASNs per Device
This widget displays the number of devices with a certain number of Autonomous System Numbers (ASNs) for all the devices that accessed your applications during the selected time-period. This information is useful since a large number of ASNs for a device can be an indication of malicious activity.
User Agents per Device
This widget displays the number of devices with a certain number of User Agents for all the devices that accessed your applications during the selected time-period. This information is useful since a large number of User Agents for a device can be an indication of malicious activity.
View Bot Assessment Data
Your Bot Traffic
The donut chart on the left shows the percentage of human traffic and bot traffic detected on your web application. The donut chart on the right show the percentage of human traffic and bot traffic detected on the web applications of F5 customers using F5 anti-bot solutions.
Suspected Bot Transactions
This widget show the number of suspected bot transactions on your web application during the time period you selected.
Top Suspected Bot Traffic by ASN
This widget shows the top five ASNs (including country of origin and the number of bot requests) that are suspected of sending bots to your web application.
Top URLs Accessed by Suspected Bots
This widget shows the top five URLs in your web application that have been accessed by suspected bots.