View Data Intelligence Executive Summary
The Data Intelligence Executive Summary, which is available with Data Intelligence Premium (Anomaly Detection), is a business intelligence tool that provides critical insights into your data, such as abnormal user behaviors and potential fraudulent events.
To view the Data Intelligence Executive Summary, from the Data Intelligence navigation panel, select Overview > Monitor.
To change parameters, such as the anomaly score threshold percentile, time range, and the flows that are included in the Executive Summary data, choose Select Data to display the Filter Parameters panel.
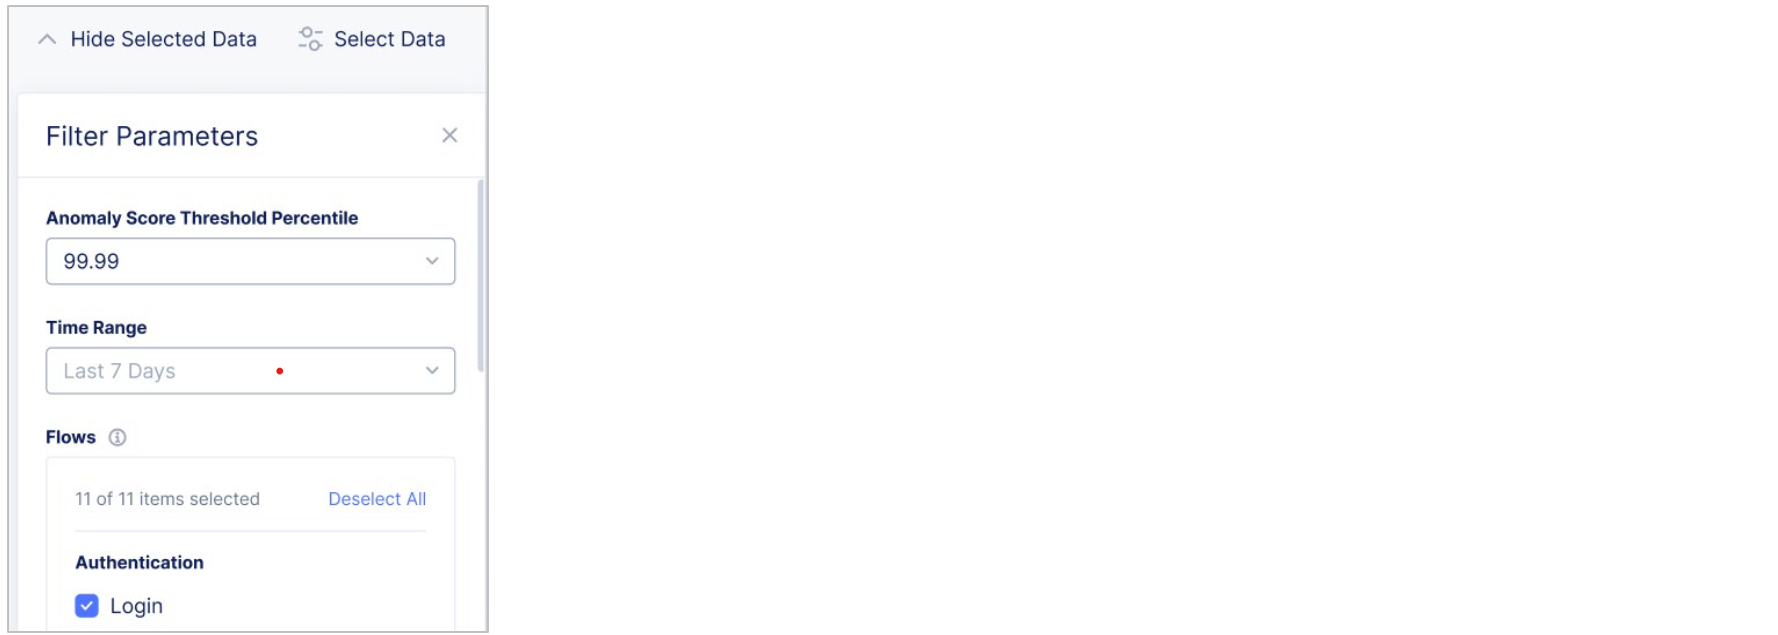
Figure: Filter Parameters
The Data Intelligence Executive Summary includes the following information.
-
Anomaly Score Threshold: A configurable threshold to distinguish between anomalous and typical traffic. For example, 99.9 percentile means the selected threshold would flag approximately 0.1% of total traffic as anomalous. The percentile is calculated over a 30-day period.
Raise the threshold to flag only the most suspicious transactions and to reduce false positives. Lower the threshold to include a larger, more diverse group of suspicious transactions to capture more nuanced fraudulent activity.
Use the Filter Parameters panel to update the Anomaly Score Threshold Percentile.
-
Score Range: The anomaly score range that corresponds to the selected threshold, based on the overall transaction distribution during the selected time range. Values furthest above 0 are the most anomalous.
-
Time Range: The configurable time period for which you chose to display data. You can adjust the time range on the Filter Parameters panel.
-
Flows: Categories of flow labels assigned to the destination endpoints of the traffic analyzed during the time range you selected. Use the Filter Parameters panel to select which flows to include in your data.
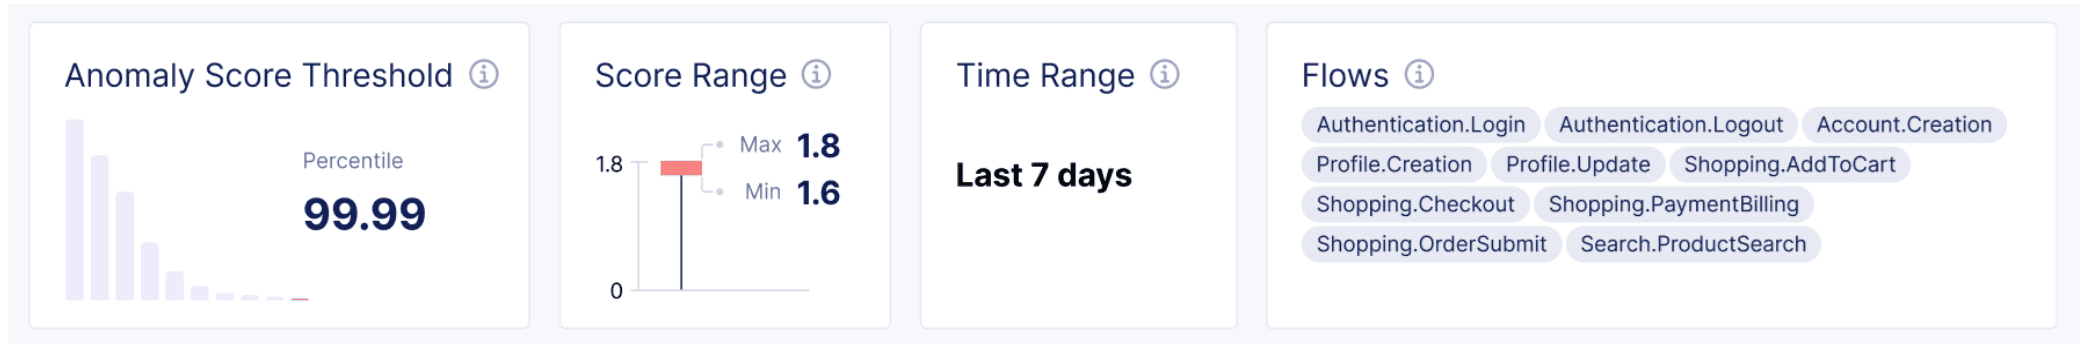
Figure: Summary Parameters

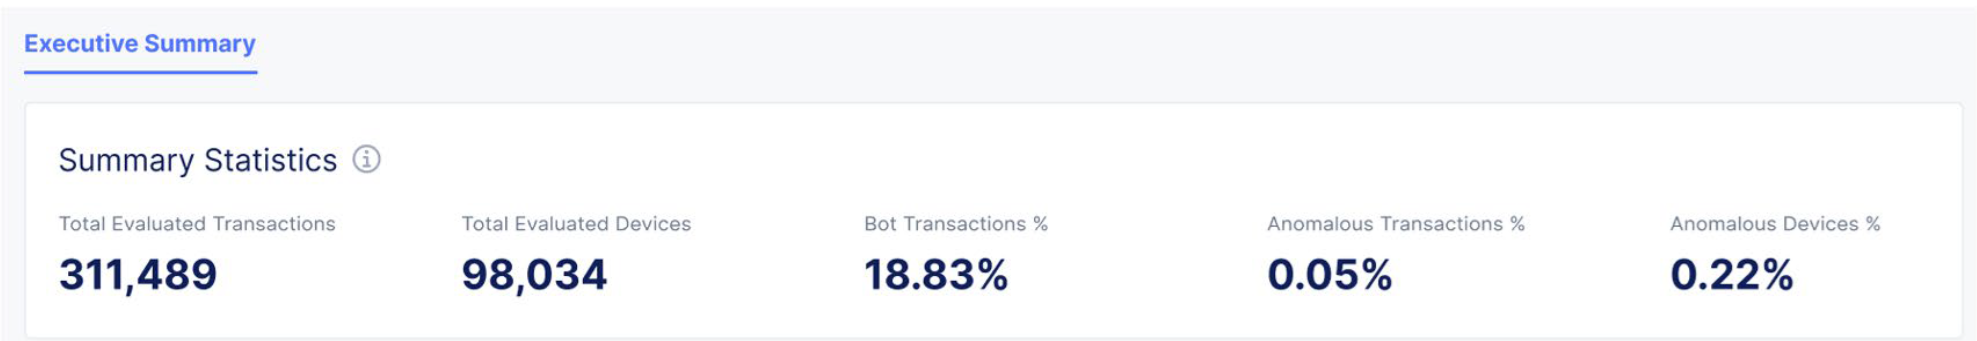
Summary Statistics: Key statistical metrics to help you assess the overall health of the application and identify high-level trends in your anomalous activity.
-
Total Evaluated Transactions: Total unique transactions analyzed for the selected traffic flow during the selected time range.
-
Total Evaluated Devices: Total unique device counts for the selected traffic flow during the selected time range.
-
Bot Transaction %: Percentage of total traffic that was determined to be bot traffic.
-
Anomalous Transactions %: Percentage of total traffic that was determined to be anomalous, based on the selected threshold, time range, and flow.
-
Anomalous Devices %: Percentage of total devices that were determined to be anomalous, based on the selected threshold, time range, and flow.
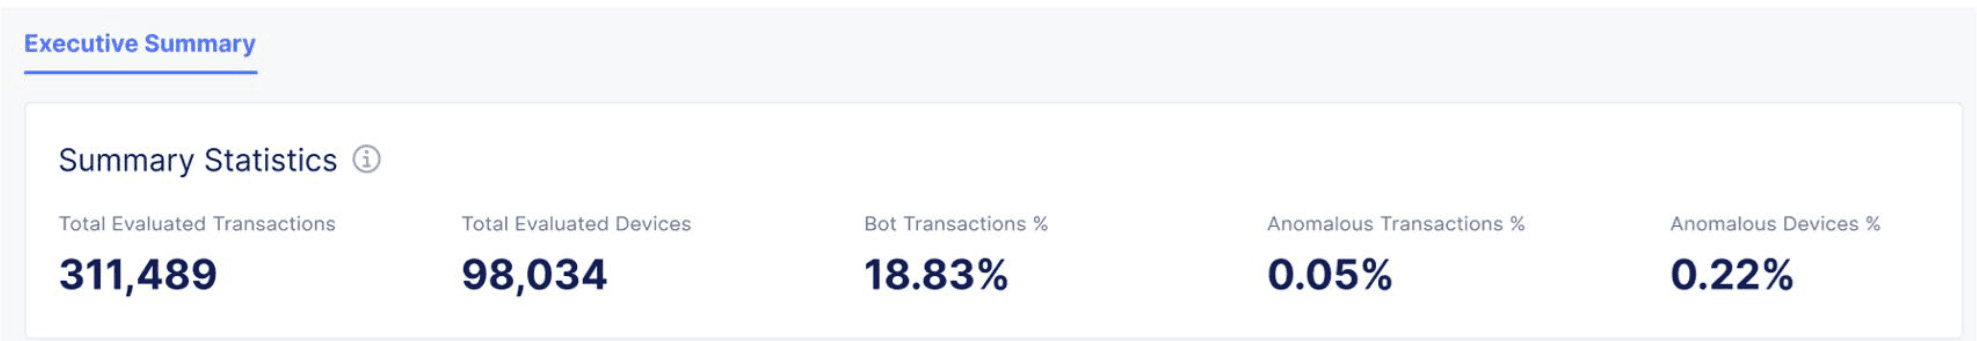
Figure: Summary Statistics
Transactions Over Time: Anomalous versus typical traffic over time, based on transactions from the past 30 days. View transactions over different time periods to observe trends in transaction volumes and anomaly patterns, for example, daily for observing trends in day of the week, and hourly for observing peak time during the day, to identify spikes or irregular patterns in transaction activity. Use this information to investigate root causes of anomalies.
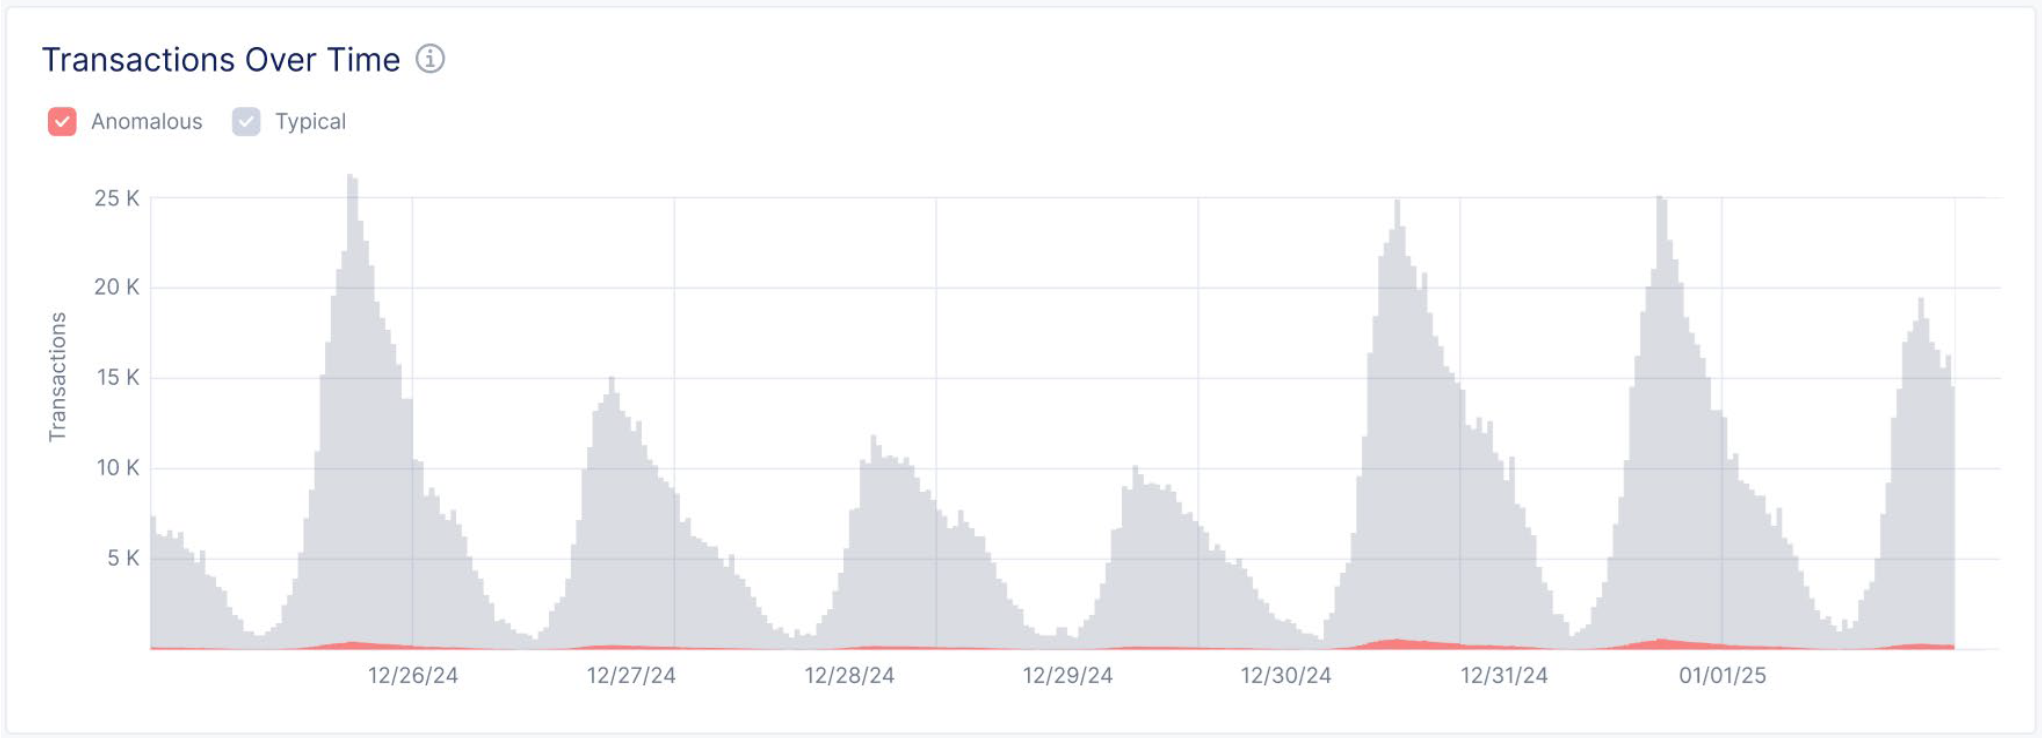
Figure: Transactions Over Time
Events by Reason: The top reasons traffic is marked as anomalous by category as a count and as a percentage of the total traffic, based on the selected threshold, time range, and flow. Use this information to identify root causes of anomalies and to understand the patterns contributing to various unusual activities.
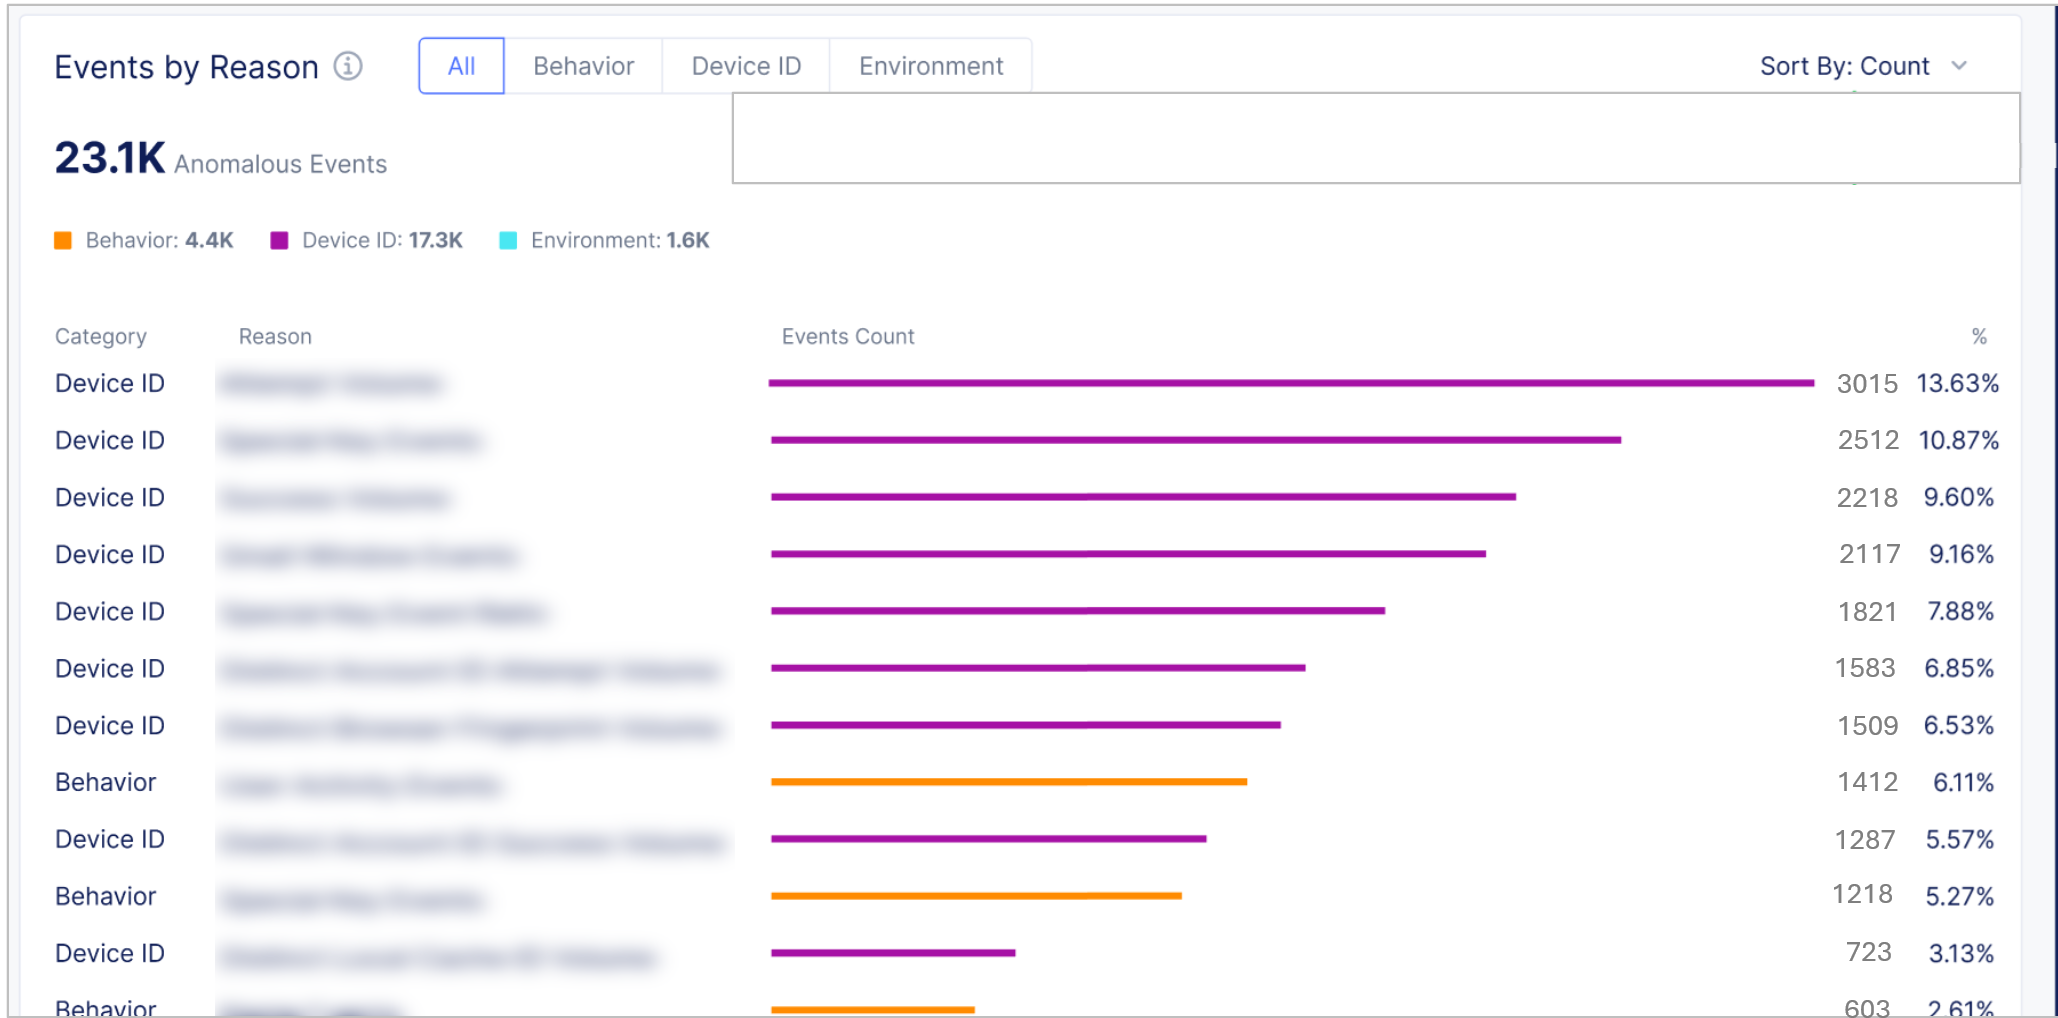
Figure: Events by Reason